Development of a hydraulic damping device to protect a centrifugal pump

Author: Fang Yilin, Kudashev S.
Journal: Бюллетень науки и практики @bulletennauki
Section: Технические науки
Article in issue: 7 т.10, 2024.
Free access
This study focuses on the utilization of hydraulic accumulators to mitigate hydraulic shock. The pressure energy within the system is converted into compressed gas energy in the accumulator. This continuous conversion between the two forms of energy allows for the absorption of hydraulic shock force, thereby ensuring system stability. The study involved the creation of experimental circuits, which were tested both with and without the inclusion of a hydraulic accumulator. The results confirmed that the accumulator has a substantial impact on reducing hydraulic shock phenomena. The study's findings demonstrate that the shocks in the hydraulic system can be efficiently managed by selecting an appropriate inflation pressure for the accumulator and utilizing various connection line data.
Hydraulic shock, hydraulic accumulator, damping calculation and analysis, experimental study
Short address: https://sciup.org/14130242
IDR: 14130242 | UDC: 62-752.2 | DOI: 10.33619/2414-2948/104/37
Разработка гидравлического демпфирующего устройства для защиты центробежного насоса
Данное исследование посвящено использованию гидравлических аккумуляторов для смягчения гидравлических ударов. Энергия давления в системе преобразуется в энергию сжатого газа в гидроаккумуляторе. Это непрерывное преобразование двух форм энергии позволяет поглощать гидравлическую ударную силу, обеспечивая тем самым стабильность системы. В ходе исследования были созданы экспериментальные схемы, которые испытывались как с включением, так и без включения гидравлического аккумулятора. Результаты подтвердили, что гидроаккумулятор оказывает существенное влияние на снижение гидравлических ударных явлений. Результаты исследования свидетельствуют о том, что удары в гидравлической системе можно эффективно регулировать, выбирая соответствующее давление накачки аккумулятора и используя различные данные соединительных линий.
Text of the scientific article Development of a hydraulic damping device to protect a centrifugal pump
Бюллетень науки и практики / Bulletin of Science and Practice
UDC 62-752.2
Бюллетень науки и практики / Bulletin of Science and Practice Т. 10. №7. 2024
Hydraulic transmission exhibits superior characteristics, such as a high power density ratio and the ability to achieve endlessly variable speeds, when compared to mechanical transmission [1]. The hydraulic transmission device lacks intricate mechanical mechanisms, hence streamlining machinery design. Hydraulic devices have the ability to enhance the arrangement of the mechanical structure and enable the achievement of downsizing and the demands of contemporary mechanical design.
However, hydraulic technology itself is not without its share of challenges. Energy loss is the consequence of the stability and reliability of hydraulic transmission, which are the two primary elements of significance [2]. Hydraulic shock, also known as water hammer, occurs when there is a rapid and significant increase in liquid pressure within a hydraulic circuit. The maximum pressure frequently exceeds the standard operating pressure [3]. The presence of vibration and noise often coincides with incorrect action of certain hydraulic components, leading to equipment damage. This is commonly caused by loose hydraulic seals resulting in oil leakage, which hinders the proper functioning of the system. Additionally, the significant energy loss caused by vibration greatly impacts the stability, reliability, and economy of the system [4].
These issues are especially noticeable in large-scale industrial equipment. In the context of heavy industrial machinery, the intricate operational conditions lead to fluctuations in the load, which in turn generate significant variations in pressure inside the system. These pressure changes give rise to a substantial impact, ultimately leading to the instability of the entire system. Hence, accurately examining the hydraulic shock mechanism, mitigating the detrimental effects of hydraulic shock, and enhancing the hydraulic system's performance have significant importance [5].
The schematic diagram of the experimental setup is shown in Figure 1.
I
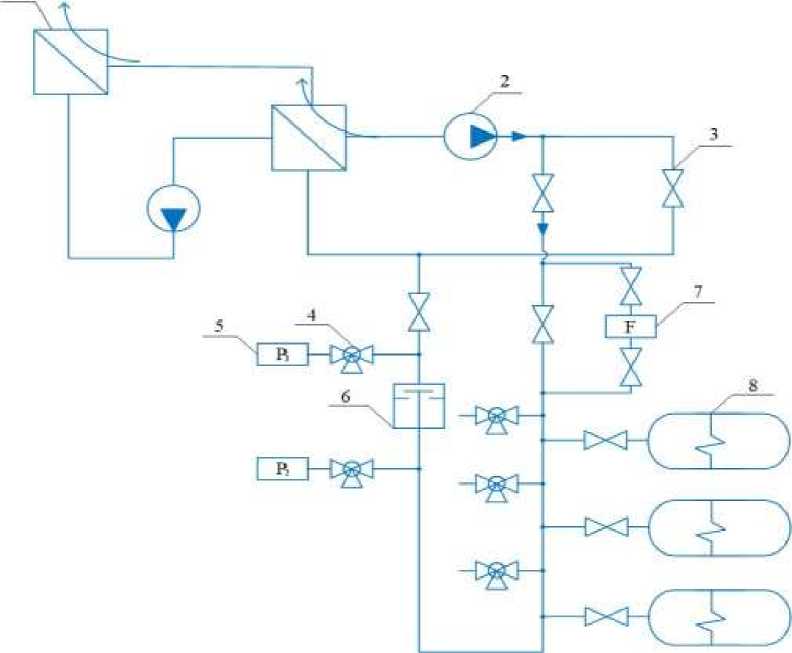
Figure 1. Scheme of the experimental setup. 1-Electric boiler Protherm (Proterm) SKAT 24K; 2-centrifugal pump; 3-check valve; 4-three-way valve; 5-pressure gauge; 6-shock valve; 7-flow meter;8-hudraulic accumulator
The water in the electric boiler flows into the pipeline via the valve. However, if the shock valve is abruptly closed, it can cause hydraulic shock across the entire experimental system. Currently, manipulate the valve located in front of the hydraulic buffer to either open or close it. By seeing and comparing the variations in pressure over time within the pipeline, you can effectively assess the hydraulic buffer's capacity to alleviate hydraulic shock.
The computer-linked sensors are utilized to retrieve the data from the pressure gauge and flow meter. Figure 2 displays the connecting diagram for the experimental setup.
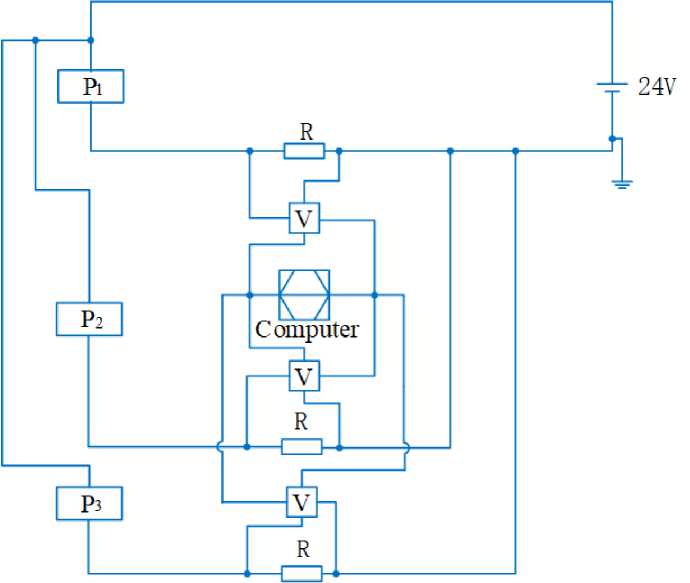
Figure 2. Sensors transmit and read experimental data
The experimental setup was established and investigated by placing the valve in front of the hydraulic accumulator in either the closed or open position. The experimental setup was checked to ensure that the experiment was implementable. The change in pressure over time was observed and recorded for various flow sizes utilizing the conducted experiment. The details regarding the experimental configuration are outlined below.
Experimental equipment information
Electric water heater, pump, hydraulic accumulators, digital to analog converter, pressure transmitter (transducer), flow meter were mainly used in the construction of the whole experiment.
The electric boiler is a wall-mounted, single circuit, electrically heated boiler for use in forced water circulation systems. Has an LCD display for showing temperature, operating mode and other parameters, as well as displaying fault codes. Cantilever pumps 80-50-200 (a) are designed for pumping water for industrial and technical purposes with pH from 6 to 9 (except for sea) and other liquids similar to water in density, viscosity and chemical activity in water supply, heating, and circulation systems. The size of solids is up to 0,2 mm with a volume concentration of no more than 0,1%. A digital-to-analog converter is an electronic circuit that converts any digital signal (such as a binary signal) into an analog signal (voltage or current). Designed for conversion of overpressure, overpressure-vacuum into standard (standardized) output signals of direct current or voltage in systems of automatic control, regulation and control of technological processes.
Specific information about the experimental equipment is shown in the Table 1-6 below:
EQUIPMENT INFORMATION ELECTRIC BOILER PROTHERM SKAT 24K
EQUIPMENT INFORMATION PUMPS-K 80-50-200A
Table 1
|
Installations |
Number |
Input Voltage/ V |
F/ Hz |
IP |
Q/ kW |
P/ kW |
η |
PMS/ bar |
T max / т |
V/ L |
|
Electric boiler Protherm SKAT 24K |
CC01320 741 |
3×230/400 |
50 |
40 |
24 |
23,9 |
99,50% |
3 |
85 |
71 |
Table 2
|
Unit Name |
K 80-50-200A |
||
|
Nomin. Flow rate, m³/h |
45 |
||
|
Nomin. Head, m |
40 |
||
|
Work Area |
Flow rate, m³/h |
Head, m |
|
|
28...58 |
35... 44 |
||
|
Cavit. Stock, m |
3.5 |
||
|
Electric motor** |
stamp |
Kw |
rpm |
|
AIR 132M2 |
11 |
3000 |
|
|
mm* |
|||
|
Overall dimensions of the unit |
L |
B |
H |
|
990 |
440 |
425 |
|
|
mm |
|||
|
Nozzle diameter, mm |
entrance |
exit |
|
|
80 |
50 |
||
|
Pump weight, kg* |
56 |
||
|
Unit weight, kg* |
172 |
||
-
* Dimensions and weights are for cast bed pumps. The dimensions and weight of the units on the welded frame differ to a lesser extent.
-
* * The power of the electric motors for the energy-saving versions of the pumps is shown in parentheses, while the flow and head do not change.
EQUIPMENT INFORMATION HYDRAULIC ACCUMULATORS
Table 3
|
Installations |
Diamete r/ m |
Pmax / bar |
T max / °C |
Scope |
Weight/ kg |
Volume/ L |
Height / m |
Connection |
|
Diaphragm tank for hot water and solar systems WESTER Premium WDV 12 l 12 bar (stainless steel) |
0,28 |
12 |
100 |
DHW, solar system s |
2,39 |
12 |
0,307 |
Male thread 3/4" |
Table 4
|
SPECIFICATIONS |
|
|
ADC |
|
|
Number of channels |
16 differential or 32 with "common ground" |
|
ADC Bit Depth |
14 bit |
|
Input Signal Measurement Sub-Ranges |
±10 V; ±2,5 V; ±0,625 V; ±0,156V |
|
Maximum Conversion Rate |
400 kHz |
|
Synchronization |
1.Internal |
|
2.From the sync signal, |
|
|
3.By Analog Signal Level |
|
|
Overload Immunity by Input Measurement Signal |
±30 V (power on) |
|
±10V (power off) |
|
|
Cross-channel traversal |
-78 dB (10 kHz sine wave) |
|
Digital Signal Processor |
|
|
Type |
ADSP-2185M |
|
Clock rate |
48 MHz |
|
Internal Data RAM |
16 CZK |
|
Internal RAM of programs |
16 Kslov |
|
FIFO Buffer ADC |
512 - 12288 Words |
|
FIFO DAC buffer |
512 - 4032 Words |
|
DAC (optional) |
|
|
Number of Voltage Outputs with Common Ground |
2 |
|
Bit width |
12 bit |
|
Establishment Time |
8 μs |
|
Output current, not more than |
2 mA |
|
Digital Inputs and Outputs |
|
|
Number of inputs |
16 (parallel, asynchronous) |
|
Number of outputs |
16 (parallel, asynchronous with common output resolution) |
|
Logic type |
TTL-Compatible |
|
Digital Input Voltage Range |
-0,2 to +0,6 V (logic zero) |
|
+2,4...+5,0 V ("logical unit") |
|
|
Voltage range at digital outputs |
0...+0,4 V ("logical zero") |
|
At least 2,4 V ("logical unit") |
|
|
Output current per 1 TTL channel, max |
±4 mA |
|
Total power consumption from all outputs |
0,5 W |
|
(TTL, DAC, external power outputs), no more than |
|
|
Powered by USB bus |
|
|
Consumption current |
Up to 400 mA |
|
Dimensions: 140×96×30 mm. Weight: no more than 0,2 kg |
|
DEVICE INFORMATION DIGITAL TO ANALOG CONVERTERS
Measured media: air, steam, liquids and other media neutral to the materials of the device in contact with the measured medium (stainless steel 12Kh18N10T, titanium alloy VT; sealing material-paronite for pressure up to 2,5 MPa, copper for pressure from 4 MPa and more; special rubber — for CRT 9 with an open membrane). Designed for conversion of overpressure, overpressure-vacuum into standard (standardized) output signals of direct current or voltage in systems of automatic control, regulation and control of technological processes.
DEVICE INFORMATION PRESSURE TRANSMITTER
Table 5
|
Insta llatio ns |
Pressure Basic Out Supply Weight/ Enclosure The temperature Ambient air ranges/ error/ signal voltage/ kg protection of the measured is temperature Mpa % / mA DC A from/ °C / °C |
|
value |
0-1,6 ±0,25; 4-20 9-30 not more IP65; -45°Cto+110°C - ±0,5; than IP67 40°Cto+86 ±1 0,175 °C |
Table 6
EQUIPMENT INFORMATION - FLOW METERS
|
Installations |
number |
Q/ (m3/h) |
P/ MPa |
accurate |
|
flow meter |
015045114 |
0,020~5 |
1,6 |
0,2%-0,5% |
Analysis and calculation of experimental data
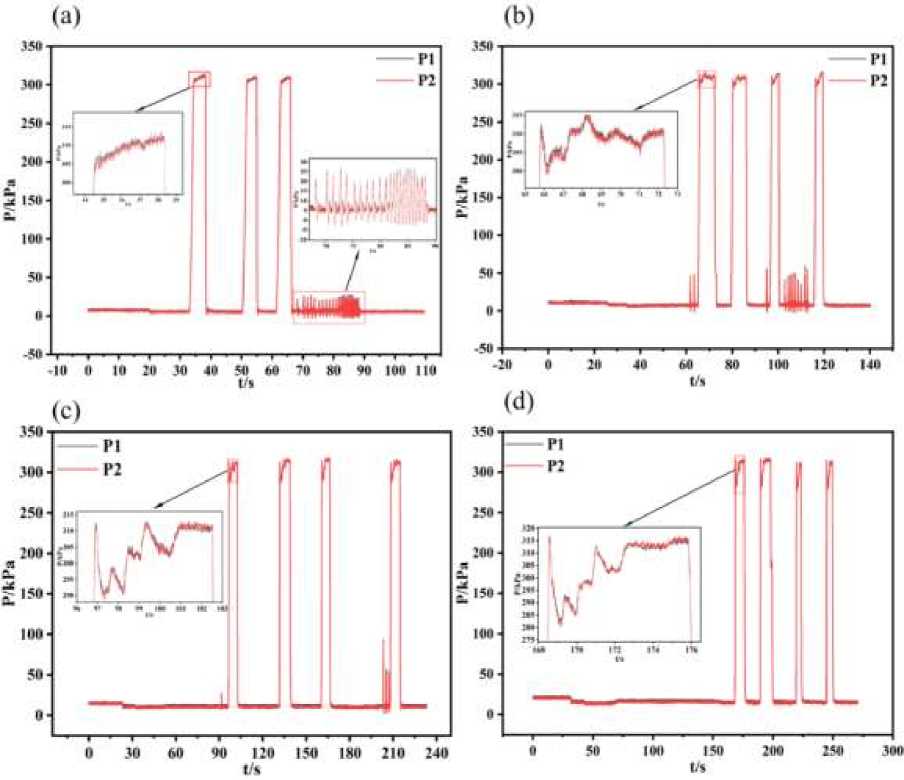
The experiment was divided into two main parts. The first part is to close the valve in front of the hydraulic accumulator and observe the pressure changes before and after the impact valve at different flow rates (0,108 m3/h; 0,201 m3/h; 0,306 m3/h; 0,401 m3/h; 0,505 m3/h; 0,600 m3/h; 0,685 m3/h; 0,746 m3/h). The second part is to open the valve in front of the hydraulic accumulator, because the hydraulic accumulator has the ability to relieve the hydraulic shock, at this time to observe the pressure change before and after the shock valve at different flow rates (0,209 m3/h; 0,300 m3/h; 0,403 m3/h; 0,505 m3/h; 0,600 m3/h; 0,639 m3/h; 0,736 m3/h; 0,970 m3/h) (Figure 3).
-
Figure 3. Figure 3.
Figure 3 while the system is operating normally, abruptly closing the valve will result in a rapid and significant increase in pressure within the pipe, leading to a hydraulic shock. When the shock valve is closed for an extended duration, a rectangular picture will be observed in Figure 2 (a), accompanied by an increase in pressure amplitude. When the shock valve rapidly closes and then opens, it generates a disrupted signal known as a short wave. Upon observing the figure, it is evident that the pressure values at the front and back of the shock valve experience a substantial decrease when the break signal is detected. This indicates that the hydraulic shock that occurred earlier has been alleviated as a result of the valve opening correctly.
Figure 3 and Figure 4 Figure 4.d isplay superimposed fluctuations. The observed superimposed amplitudes in the pressure change images before and after the vibrating valve in a hydraulic shock are typically caused by the combined effects of the operational characteristics of the vibrating valve and the parameters of the oil line on the propagation of the pressure wave. The characteristics of shock valves, such as the duration of opening and shutting, as well as the force required to open them, have a direct impact on the shape and magnitude of the pressure wave. Simultaneously, the characteristics of the oil pipeline, including its length, pipe diameter, material, etc., will influence the pace at which pressure waves propagate, as well as their attenuation and reflection. Consequently, these factors will ultimately affect the amplitude of the pressure wave. Therefore, the presence of several pressure wave pictures with comparable amplitude can indicate the combined impact of the vibrating valve and the oil pipeline.
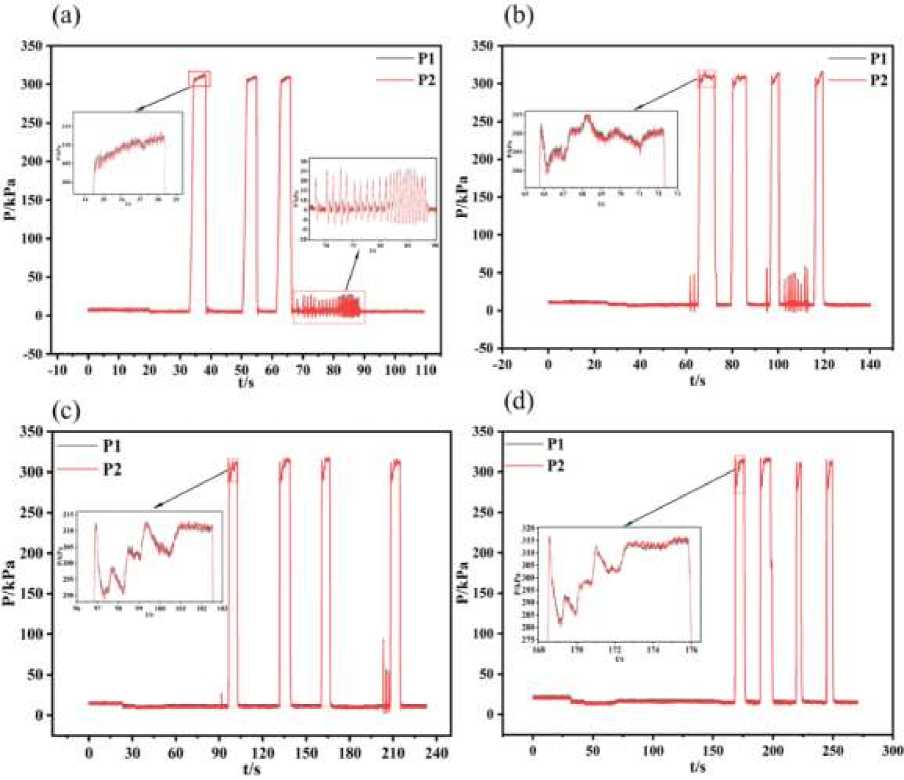
Figure 3. Trend of pressure change with time when the valve is suddenly closed. (a) Flow rate: 0,108 m3/h; (b) Flow rate: 0,201 m3/h; (c) Flow rate:0,306 m3/h; (d) Flow rate: 0,505 m3/h
Figure 3 and Figure 4 demonstrate that, aside from the overlaid variations, there is minimal disparity in pressure before and after the valve following certain duration subsequent to its abrupt closure. Despite the abrupt closure and subsequent reopening of the valve, the pressure differential before and after the valve remained minimal. This occurs due to the presence of inertia in the hydraulic system, which results in a relatively small pressure difference before and after the shock valve when it is abruptly closed or opened during a hydraulic shock. When a vibrating valve is abruptly shut, the fluid in the hydraulic system retains its inertia and generates a pressure wave that induces an immediate alteration in pressure as the wave spreads both ahead of and behind the valve.
By examining the localized enlargements in Figure 3 and Figure 4, it becomes evident that the oscillations in the top band of the chart exhibit a stepped pattern. The stepped peak band of the pressure wave is caused by the transient effect in the hydraulic system. When the shock valve is shut, the fluid in the hydraulic system generates a pressure wave that results in an immediate alteration in pressure. Due to the viscosity and inertia of the liquid, the pressure wave encounters resistance and reflection as it travels, leading to alterations in the form of the pressure wave.
As the wave travels from an area of high pressure to an area of low pressure, its speed drops, resulting in the waveform taking on an ascending step shape. As the wave travels from the area of low pressure to the area of high pressure, its velocity increases, resulting in the waveform taking on a descending step shape. Hence, the emergence of a step-like configuration in the pressure wave during a hydraulic shock is a result of a modification in the velocity at which the wave propagates.
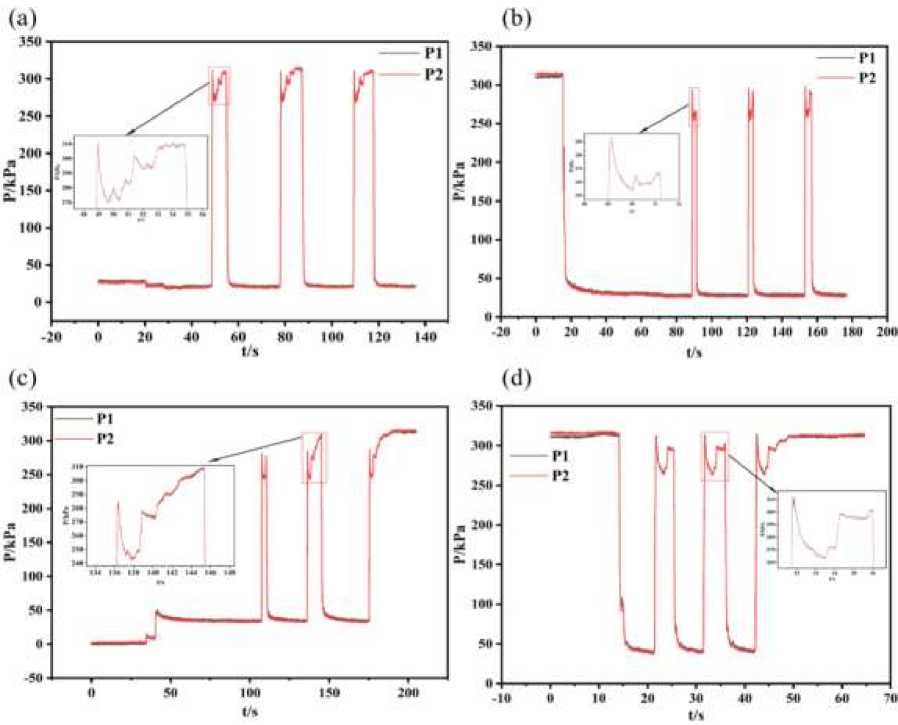
Figure 4. Trend of pressure change with time when the valve is suddenly closed. (a) Flow rate: 0,505 m3/h; (b) Flow rate: 0,600 m3/h; (c) Flow rate: 0,685 m3/h; (d) Flow rate: 0,746 m3/h
The experimental pipe is made of polypropylene and has an inner diameter of 16 mm and an outside diameter of 25 mm. During the analysis of the experimental data, it is necessary to determine the propagation speed of the hydraulic shock wave and draw a judgment regarding the required amount of damping. The shock propagation time is defined as the duration between the last pressure amplitude and the subsequent pressure amplitude. The velocity of propagation of the shock wave v [6]:
v = —( m/s )
Damping characteristic factor C [0] :
C = n dL ( pa • sm 2)
Damping factor D [7]:
D = CA ( N • s/m ) (3)
Damping force F [0 -0] :
F = - Dv ( N ) (4)
Among them, L is the length of the pipe (m); t is the impact propagation time (s); h is the viscosity of the liquid, and the value taken here is 1,002×10-3 Pa·s/m2; d is the inner diameter of the pipe (m), the nominal diameter of the Male thread 3/4” is DN20; A is the area of the effective surface of the action (m2).
Table 7
INITIAL CALCULATION PARAMETERS
|
Effective area/ m2 |
Fluid viscosity/ (Pa·s) |
Length/ m |
Inner diameter/ m |
Effective damping coefficient C/ (Pa·s/m2) |
Damping factor D/ (N·s/m) |
|
0,0314 |
0,001 |
6 |
0,016 |
1869,775 |
58,71094 |
Observe the experimental data in the experimental process, select the valid data with small error for calculation can ensure the accuracy of the experiment [7].
The physical parameters of the fluid in the tube are shown in Table 7, combined with different flow rates in the tube and the transmission speed of the shock wave when the valve is suddenly closed, the damping value that needs to be increased when the valve is suddenly closed at different flow rates can be calculated. The following table shows the damping calculations for closing the valve at various flow rates:
Table 8
CALCULATION OF THE ADDITIONAL DAMPING REQUIRED FOR SUDDEN VALVE CLOSURE AT A FLOW RATE OF 0,108 m3/h
|
close-0,108 |
P1 |
P2 |
|
First maximum amplitude/ kPa |
313,500 |
314,00 |
|
cyclicality/ s |
16,440 |
16,030 |
|
velocity/ (m/s) |
0,365 |
0,374 |
|
damping/ N |
-21,429 |
-21,958 |
|
Second maximum amplitude/ kPa |
311,000 |
311,500 |
|
cyclicality/ s |
11,190 |
11,440 |
|
velocity/ (m/s) |
0,536 |
0,524 |
|
damping/ N |
-31,469 |
-30,765 |
|
Third maximum amplitude/ kPa |
310,500 |
310,500 |
Table 9
CALCULATION OF THE ADDITIONAL DAMPING REQUIRED FOR SUDDEN VALVE CLOSURE AT A FLOW RATE OF 0,201 m3/h
|
close-0,201 |
P1 |
P2 |
|
First maximum amplitude/ kPa |
315,000 |
315,500 |
|
cyclicality/ s |
14,510 |
14,440 |
|
velocity/ (m/s) |
0,414 |
0,416 |
|
damping/ N |
-24,277 |
-24,395 |
|
Second maximum amplitude/ kPa |
312,000 |
311,500 |
|
cyclicality/ s |
16,880 |
17,030 |
|
velocity/ (m/s) |
0,355 |
0,352 |
|
damping/ N |
-20,869 |
-20,685 |
|
Third maximum amplitude/ kPa |
314,000 |
314,500 |
|
Table 10 CALCULATION OF THE ADDITIONAL DAMPING REQUIRED FOR SUDDEN VALVE CLOSURE AT A FLOW RATE OF 0,306 m3/h |
||
|
close-0,306 |
P1 |
P2 |
|
First maximum amplitude/ kPa |
313,000 |
313,000 |
|
cyclicality/ s |
36,740 |
36,830 |
|
velocity/ (m/s) |
0,163 |
0,163 |
|
damping/ N |
-9,588 |
-9,565 |
|
Second maximum amplitude/ kPa |
316,000 |
317,000 |
|
cyclicality/ s |
29,700 |
29,110 |
|
velocity/ (m/s) |
0,202 |
0,206 |
|
damping/ N |
-11,861 |
-12,101 |
|
Third maximum amplitude/ kPa |
318,000 |
318,000 |
|
Table 11 CALCULATION OF THE ADDITIONAL DAMPING REQUIRED FOR SUDDEN VALVE CLOSURE AT A FLOW RATE OF 0,685 m3/h |
||
|
close-0,685 |
P1 |
P2 |
|
First maximum amplitude/ kPa |
281,500 |
281,500 |
|
cyclicality/ s |
37,220 |
37,300 |
|
velocity/ (m/s) |
0,161 |
0,161 |
|
damping/ N |
-9,464 |
-9,444 |
|
Second maximum amplitude/ kPa |
309,000 |
309,500 |
|
Table 12 CALCULATION OF THE ADDITIONAL DAMPING REQUIRED FOR SUDDEN VALVE CLOSURE AT A FLOW RATE OF 0,401 m3/h |
||
|
close-0,401 |
P1 |
P2 |
|
First maximum amplitude/ kPa |
317,000 |
317,000 |
|
cyclicality/ s |
14,230 |
19,840 |
|
velocity/ (m/s) |
0,422 |
0,302 |
|
damping/ N |
-24,755 |
-17,755 |
|
Second maximum amplitude/ kPa |
317,000 |
318,000 |
|
cyclicality/ s |
55,270 |
54,010 |
|
velocity/ (m/s) |
0,109 |
0,111 |
|
damping/ N |
-6,374 |
-6,522 |
|
Third maximum amplitude/ kPa |
314,500 |
314,500 |
|
Ifcc) ® Тип лицензии CC: Attribution 4.0 International (CC BY 4.0) |
364 |
|
Бюллетень науки и практики / Bulletin of Science and Practice Т. 10. №7. 2024
Table 13
CALCULATION OF THE ADDITIONAL DAMPING REQUIRED FOR SUDDEN VALVE CLOSURE AT A FLOW RATE OF 0,505 m3/h
|
close-0,505 |
P1 |
P2 |
|
First maximum amplitude/ kPa |
311,500 |
311,000 |
|
cyclicality/ s |
35,660 |
30,900 |
|
velocity/ (m/s) |
0,168 |
0,194 |
|
damping/ N |
-9,878 |
-11,400 |
|
Second maximum amplitude/ kPa |
314,500 |
315,500 |
|
cyclicality/ s |
32,060 |
31,600 |
|
velocity/ (m/s) |
0,187 |
0,190 |
|
damping/ N |
-10,988 |
-11,148 |
|
Third maximum amplitude/ kPa |
311,000 |
312,000 |
|
Table 14 CALCULATION OF THE ADDITIONAL DAMPING REQUIRED FOR SUDDEN VALVE CLOSURE AT A FLOW RATE OF 0,600 m3/h |
||
|
close-0,600 |
P1 |
P2 |
|
First maximum amplitude/ kPa |
294,000 |
291,000 |
|
cyclicality/ s |
31,840 |
31,840 |
|
velocity/ (m/s) |
0,188 |
0,188 |
|
damping/ N |
-11,064 |
-11,064 |
|
Second maximum amplitude/ kPa |
296,000 |
294,500 |
|
cyclicality/ s |
32,460 |
32,460 |
|
velocity/ (m/s) |
0,185 |
0,185 |
|
damping/ N |
-10,852 |
-10,852 |
|
Third maximum amplitude/ kPa |
298,000 |
296,000 |
|
Table 15 CALCULATION OF THE ADDITIONAL DAMPING REQUIRED FOR SUDDEN VALVE CLOSURE AT A FLOW RATE OF 0,746 m3/h |
||
|
close-0,746 |
P1 |
P2 |
|
First maximum amplitude/ kPa |
312,000 |
310,500 |
|
cyclicality/ s |
10,040 |
10,140 |
|
velocity/ (m/s) |
0,598 |
0,592 |
|
damping/ N |
-35,086 |
-34,740 |
|
Second maximum amplitude/ kPa |
313,000 |
310,500 |
By examining Tables 8-15 and comparing the damping values, it becomes evident that altering the flow rate in a hydraulic shock will impact both the timing of the pressure peak and the level of extra damping. As the velocity of flow increases, the greater inertia and kinetic energy lead to a reduced time for the pressure to reach its maximum, and also need higher damping to regulate the pressure peak. However, within a specific range, as the flow rate increases, the required quantity of damping does not necessarily increase proportionally, but rather exhibits a pattern of initially increasing and then decreasing. The reason for this is that when the flow rate increases, there is a corresponding rise in the inertia and kinetic energy of the fluid. This leads to an increase in the inertial damping of the fluid, which in turn results in better control of the pressure peak. Based on the analysis of the data provided, it is evident that the size and rise in damping in hydraulic impacts should be evaluated and computed individually for each specific scenario.
The necessary damping would differ across various conditions. The precise amount of additional damping needed depends on the matching flow rate, and the magnitude of the damping is displayed in Tables 8-15. It should be noted that the amplitudes used for the calculations vary based on the images generated from the experimental data. This is due to the fact that there is an instantaneous increase in pressure in front of the valve as the flow in the pipe continues to increase. Therefore, only two specific amplitudes were obtained for the calculations in Tables 14 and 15, which are now explained. It is evident that when the hydraulic accumulator is open, if the valve is abruptly closed while the hydraulic pressure is being relieved, the pressure in front of the valve (P2) will be higher than the pressure after the valve (P1). As the rate of flow in the tube increases, the difference in pressure between P2 and P1 also grows progressively. This phenomenon occurs when the valve is abruptly shut, causing the fluid in the pipeline to rapidly cease flowing and generate a backflow. This, in turn, triggers the formation of a pressure wave that travels towards the valve. The hydraulic accumulator's capacity to absorb energy causes the principal pressure wave to be directed towards it. Consequently, the pipe positioned before the hydraulic accumulator will experience high pressure, specifically in front of the valve.
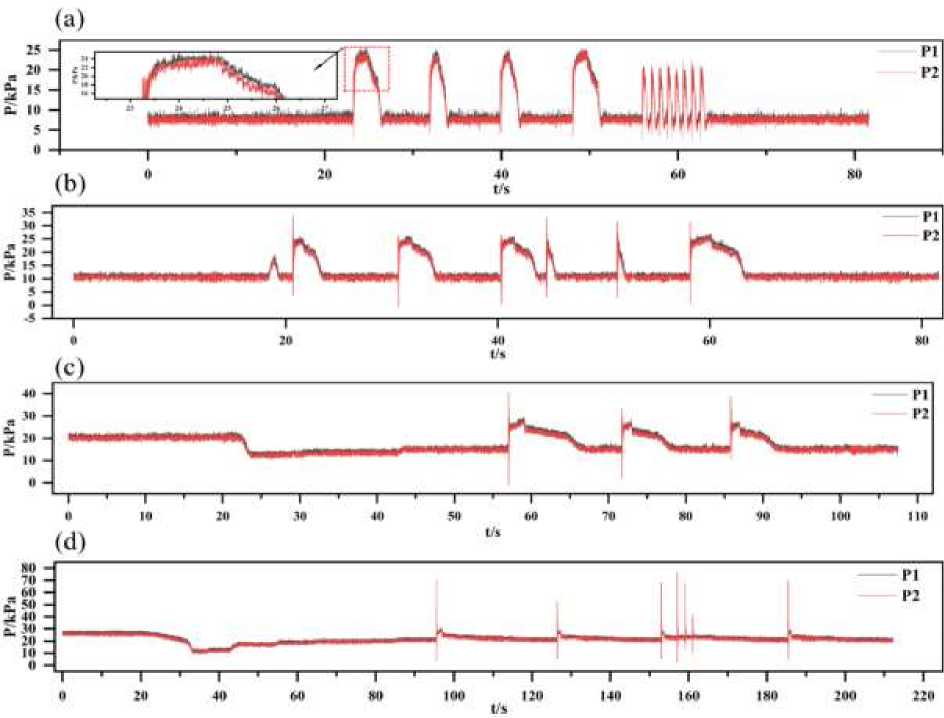
Figure 5. Trend of pressure with time when a hydraulic accumulator is opened and the valve is suddenly closed. (a) Flow rate: 0,209 m3/h; (b) Flow rate: 0,300 m3/h; (c) Flow rate: 0,403 m3/h; (d) Flow rate: 0,505 m3/h
However, when the flow rate in the tube increased to 0,970 m3/h, if the hydraulic accumulator is opened to release the hydraulic pressure and then the valve is abruptly closed, the pressure difference before and after the valve is not significant. This is because the hydraulic accumulator is able to absorb some of the energy. Here, the pressure wave generated by the reverse flow is directed towards the hydraulic accumulator upon valve closure.
The accumulator then absorbs this wave, resulting in a decrease in the pressure difference across the valve. Currently, the hydraulic accumulator is more effective in reducing pressure waves compared to inertia. When the flow rate reaches a certain level, the hydraulic accumulator can effectively mitigate most of the pressure wave, resulting in minimal pressure difference before and after the valve.
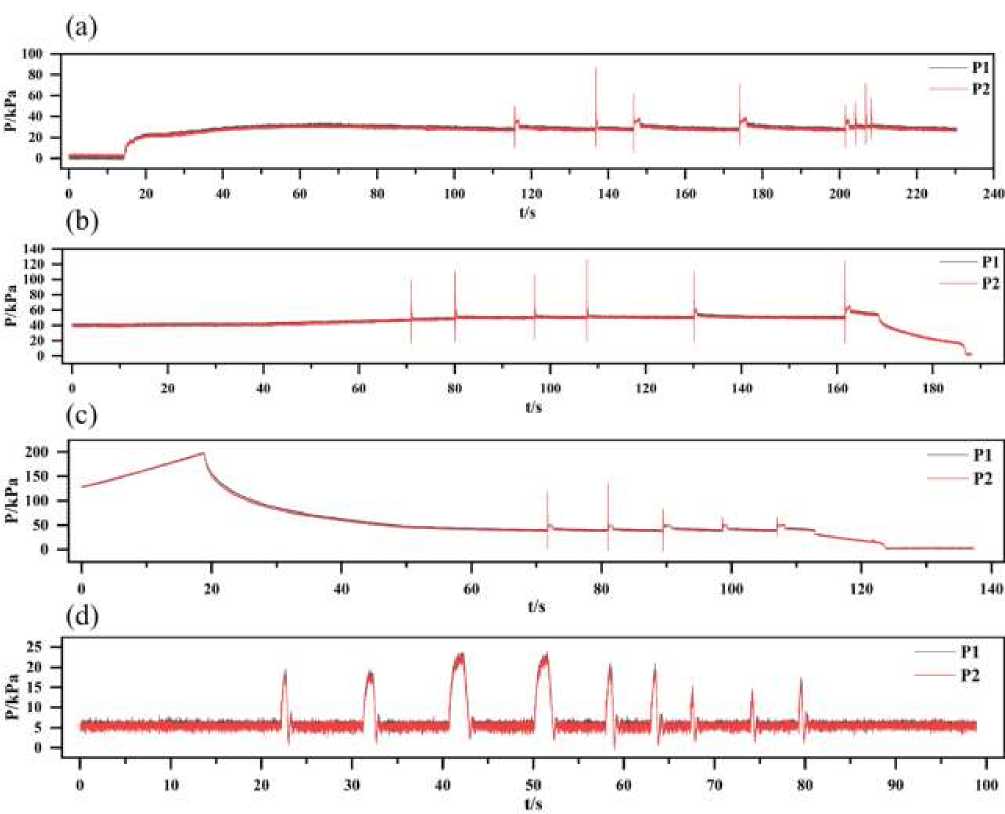
Figure 6. Trend of pressure with time when a hydraulic accumulator is opened and the valve is suddenly closed. (a) Flow rate is: 0,600 m3/h; (b) Flow rate is: 0,639 m3/h; (c) Flow rate is: 0,736 m3/h; (d) Flow rate is: 0,970 m3/h
Experiment results
Subsequent investigations confirmed that the utilization of hydraulic accumulators can effectively mitigate hydraulic shock in the system resulting from the inadvertent closure of the valve. During the analysis of the experimental data, it was discovered that the speed at which the hydraulic shock wave spreads is connected to the time interval between the last and next maximum amplitudes of the shock wave, when hydraulic buffers are not used. Nevertheless, there was no discernible association between the shock propagation time and the flow rate in the tube, even as the flow rate in the tube increased. This demonstrates that the speed at which a particular hydraulic shock wave spreads, when there is more resistance to its movement, must be evaluated individually for each situation.
The experimental data shows that the maximum damping force is 35,0864 N, and it occurs when the tube flow rate is 0,746 m3/h. Given that the overall maximum flow rate of the system is 0,746 m3/h, the hydraulic accumulator's capacity to reduce hydraulic pressure within the system is at least 35,0864 N, which meets the required criteria.
When the flow rate in the pipe changed between 0,108 m3/h and 0,403 m3/h, and 0,970 m3/h, the pressure without the hydraulic accumulator increased by approximately 270 kPa. This rise in pressure was aimed at safeguarding the system from hydraulic shocks. When the flow rate in the tube varied between 0,505 m3/h and 0,736 m3/h, the pressure without the hydraulic accumulator increased by approximately 100 kPa to 223 kPa.
Conclusion
The hydraulic accumulator in the hydraulic system continuously fills and discharges fluid to convert the pressure energy in the system and reduce hydraulic shock. The experiment's viability was verified through a literature review. During the hydraulic transmission trials, tests were conducted both with and without the inclusion of hydraulic accumulators in the hydraulic circuits. The purpose of this analysis is to determine the extent to which pressure increases in the absence of a damper at various costs, by manipulating the flow rate within the tube. In conclusion, this thesis confirms the efficacy of hydraulic accumulators in mitigating hydraulic shock by a comprehensive comparison and analysis of the gathered pressure response graphs. Hydraulic shock mitigation is more efficient at lower or higher flow rates. In the current hydraulic system, hydraulic shock is a frequently observed phenomenon. There are numerous theoretically possible solutions to address this issue. However, due to limitations in time and personal capabilities, it is necessary to have more comprehensive experimental equipment and facilities to validate these methods for mitigating hydraulic shock. Additionally, it is important to minimize the impact of external factors, such as environmental conditions, on the experimental results.
References Development of a hydraulic damping device to protect a centrifugal pump
- Roggenburg M., Esquivel-Puentes H. A., Vacca A., Evans H. B., Garcia-Bravo J. M., Warsinger D. M., Castillo L. Techno-economic analysis of a hydraulic transmission for floating offshore wind turbines // Renewable Energy. 2020. V. 153. P. 1194-1204. https://doi.org/10.1016/j.renene.2020.02.060.
- Wang F., Zhang Q., Wen Q., Xu B. Improving productivity of a battery powered electric wheel loader with electric-hydraulic hybrid drive solution // Journal of Cleaner Production. 2024. V. 440. P. 140776. https://doi.org/10.1016/j.jclepro.2024.140776.
- Cecchi N. J., Liu Y., Vegesna R. V., Zhan X., Yang W., Campomanes L. A. E., Camarillo D. B. A wearable hydraulic shock absorber with efficient energy dissipation // International Journal of Mechanical Sciences. 2024. V. 270. P. 109097. https://doi.org/10.1016/j.ijmecsci.2024.109097.
- Schickhofer L., Antonopoulos C. G. Cause-effect relationship between model parameters and damping performance of hydraulic shock absorbers // International Journal of Non-Linear Mechanics. 2024. V. 159. P. 104627. https://doi.org/10.1016/j.ijnonlinmec.2023.104627.
- Fang Yilin, Kudashev S. Ways to Protect Equipment from Hydraulic Shock // Бюллетень науки и практики. 2024. Т. 10. №6. С. 296-305. https://doi.org/10.33619/2414-2948/103/33.
- Zhang W., Wang G., Guo Y. Research on damping and energy recovery characteristics of a novel mechanical-electrical-hydraulic regenerative suspension system // Energy. 2023. V. 271. P. 127022. https://doi.org/10.1016/j.energy.2023.127022.
- Liu D., Li C., Malik O. P. Nonlinear modeling and multi-scale damping characteristics of hydro-turbine regulation systems under complex variable hydraulic and electrical network structures // Applied Energy. 2021. V. 293. P. 116949. https://doi.org/10.1016/j.apenergy.2021.116949.
- Wang S. K., Wang J. Z., Xie W., Zhao J. B. Development of hydraulically driven shaking table for damping experiments on shock absorbers // Mechatronics. 2014. V. 24. №8. P. 1132-1143. https://doi.org/10.1016/j.mechatronics.2014.09.001.
