Development of e-commerce in Russia: the influence of COVID-19 pandemic

Author: Batorova A.B.
Journal: Международный журнал гуманитарных и естественных наук @intjournal
Section: Экономические науки
Article in issue: 5-1 (80), 2023.
Free access
E-commerce and its development are one of the most important trends in the development of the Russian economy. This scientific work focuses on identifying the key changes in the dynamics of the sales volume of E-commerce in the Russian Federation in 2011-2022 and aims to forecast the sales volumes for 2023. The influence of the coronavirus pandemic on the dynamics of the development of E-commerce is given an assessment. The final conclusions are formulated within the framework of research problems.
E-commerce, coronavirus, consumer behavior, trend analysis, time series analysis, forecast
Short address: https://sciup.org/170199286
IDR: 170199286 | DOI: 10.24412/2500-1000-2023-5-1-200-206
Развитие электронной коммерции в России: влияние пандемии COVID-19
Электронная коммерция и ее развитие являются одним из важнейших направлений развития экономики России. Данная научная работа посвящена выявлению ключевых изменений в динамике объема продаж электронной торговли в Российской Федерации в 2011-2022 гг. Сделаны прогнозы объемов продаж на 2023 г. Дана оценка влиянию пандемии коронавируса на динамику развития электронной торговли. Сформулированы окончательные выводы в рамках задач исследования.
Text of the scientific article Development of e-commerce in Russia: the influence of COVID-19 pandemic
The COVID-19 pandemic and the subsequent quarantine restrictions have greatly complicated the situation in the real economy sector. There was a significant decrease in the level of consumption of non-food products by the population of the Russian Federation, largely due to the temporary closure of offline stores in 2020-2021. During the coronavirus restrictions introduced in March 2020, 85% of clothing stores and 75% of electronics stores suspended their work [1]. At the same time, these processes have largely positively influenced the development of online sales and Internet commerce, which determines the relevance of the subject of this scientific study.
The goal of the research is the analysis of the influence of COVID-19 pandemic on the development of E-Commerce in Russia.
The objectives are:
-
- to analyze economic indicators such as the share of E-commerce in the total volume of non-grocery retail, sales volumes of Ecommerce and average check.
-
- to educe the trend in the sales volume’s growth and to forecast for 2023.
-
- to determinate the main conclusions which can be made based on the data studied.
The problems of the pandemic and quarantine restrictions had a negative impact on consumption in full measure in the Russian Federation and in the world [2, 3]. This was largely due to the quarantine and social distancing on the one hand and costs optimization of the population in a crisis on the other hand. At the same time, the sphere of Internet commerce has developed significantly in this period.
An important aspect in the system of changing the consumer behavior of the population of the Russian Federation in the period before the pandemic and in the period 20202022 is the assessment of the level of changes in the share of online commerce in the total volume of non-grocery retail (Figure 1).
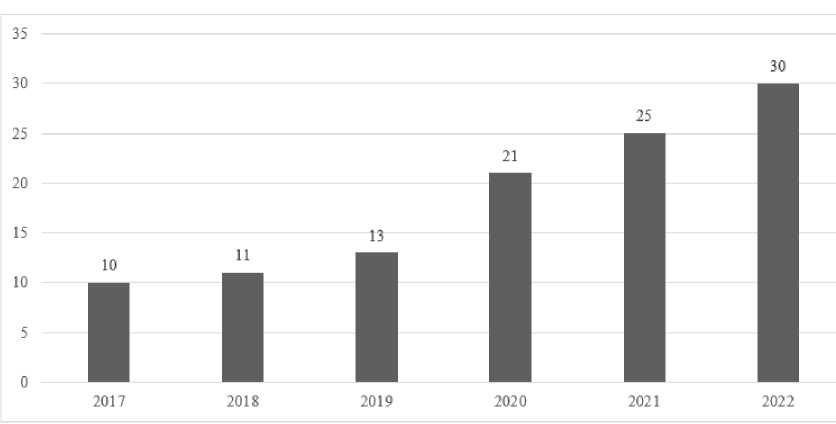
Figure 1. The share of E-commerce in the total volume of non-grocery retail in 2017-2022 (%)
As we can see, the share of E-commerce in the total volume of non-grocery retail doubled after the pandemic started (2020), from 1013% in 2017-2019 to 21-30% in 2020-2022.
Now, let us analyze the sales volume in the field of online commerce in the Russian Federation in the period 2011-2022 (Figure 2).
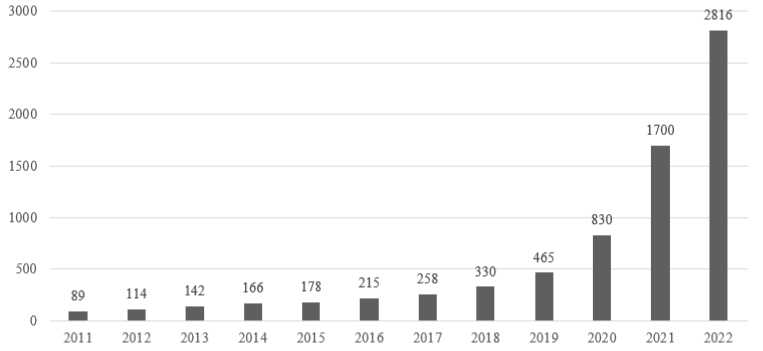
Figure 2. Sales volumes in the field of online commerce in 2011-2022 in the Russian Federation (in million orders) [4]
The above figure makes it clear that the coronavirus pandemic has greatly affected the growth in online sales. Over the period, sales increased by 2356.2% or 2097 million sales, from 89 million in 2011 to 2816 in 2022. In the period before the pandemic (2011-2019), the annual average indicator was at the level of 217.4 million sales, but in 2020-2022 it amounted to 1782 million sales. The growth before the pandemic was linear and steady, however, after the pandemic started the sales grew exponentially.
In the ‘Statistics for economists’ course, special attention is paid to forecasting based on trend equations. One of the simplest forecasting models used in practice is a trend model – a regression model in which the dependent variable is the indicator we are studying, and the independent variable is the time or observation number of this indicator. In other words, a trend is a mathematical description of the increases and decreases in the time series [4].
To predict the number of orders in 2023, let us make a trend equation. The chart allows to determine that this trend is exponential. The exponential trend equation has the form у = а • ebt. For calculations using the ‘least squares’ method, the equation is reduced to all the necessary calculations were made us-the form Zn(y) = Zn(a) + bt. ing MS Excel and are displayed in the form of
To find the parameters ‘a’ and ‘b’, we use a table (Table 1).
the ‘least squares’ method. For convenience,
Table 1. Calculations for the trend equation (of the sales volumes in million orders)
|
t |
t2 |
y |
ln(y) |
ln(y)*t |
ŷ |
ln(ŷ) |
(ln(y)-ln(y))2 |
(ln(y)- ln(ŷ))2 |
(t—t)2 |
(ln(y)- ln(y()2 |
|
|
1 |
1 |
89 |
4.49 |
4.489 |
67.49 |
4.21 |
2.48 |
0.076 |
30.25 |
1.685 |
|
|
2 |
4 |
114 |
4.74 |
9.472 |
89.87 |
4.50 |
1.66 |
0.057 |
20.25 |
1.104 |
|
|
3 |
9 |
142 |
4.96 |
14.867 |
119.66 |
4.78 |
1.00 |
0.029 |
12.25 |
0.691 |
|
|
4 |
16 |
166 |
5.11 |
20.448 |
159.32 |
5.07 |
0.51 |
0.002 |
6.25 |
0.455 |
|
|
5 |
25 |
178 |
5.18 |
25.909 |
212.14 |
5.36 |
0.18 |
0.031 |
2.25 |
0.366 |
|
|
6 |
36 |
215 |
5.37 |
32.224 |
282.46 |
5.64 |
0.02 |
0.074 |
0.25 |
0.173 |
|
|
7 |
49 |
258 |
5.55 |
38.871 |
376.08 |
5.93 |
0.02 |
0.142 |
0.25 |
0.055 |
|
|
8 |
64 |
330 |
5.80 |
46.393 |
500.75 |
6.22 |
0.18 |
0.174 |
2.25 |
0.000 |
|
|
9 |
81 |
465 |
6.14 |
55.278 |
666.74 |
6.50 |
0.51 |
0.130 |
6.25 |
0.126 |
|
|
10 |
100 |
830 |
6.72 |
67.214 |
887.75 |
6.79 |
1.00 |
0.005 |
12.25 |
0.873 |
|
|
11 |
121 |
1700 |
7.44 |
81.822 |
1182.03 |
7.07 |
1.66 |
0.132 |
20.25 |
2.728 |
|
|
12 |
144 |
2816 |
7.94 |
95.317 |
1573.85 |
7.36 |
2.48 |
0.338 |
30.25 |
4.649 |
|
|
S |
78 |
650 |
7303 |
69.4 |
492.3 |
6118.15 |
69.4 |
11.721 |
1.190 |
143 |
12.906 |
|
Mean |
6.50 |
54.17 |
608.6 |
5.79 |
41.03 |
509.85 |
5.79 |
0.98 |
0.10 |
11.92 |
1.08 |
The system of equations for finding the parameters of the trend equation looks like
an + bit = Sy
tat + bit2 = Syt For our data' the system of equations has the form
12a + 78b = 69,44
{78a + 650b = 492,3. Solving the equation'
we find a=3.926 and b=0.286. From here, the trend equation takes the form y=50,691·e0,286t.
Evaluation of the significance of the equation according to the Fisher’s exact test: Fcalc.=98.5, which is more than Ftabl.(0.05;1;10)=4.96. From this we can conclude that the equation is significant in Fisher’s test. Evaluation of the significance of the equation by Student's t-test: t-calc.=9.91, which is more than t-tabl.(0.05;10)=2.228. From this we can conclude that the equation is significant in t-test. The coefficient of determination is 0.908. All of these criterions allow us to determine that the equation is suitable for forecasting.
Forecast: y(13)=50,691·e0,286*13=2095.56
million orders.
For clarity, the results are shown in the figure (Figure 3).
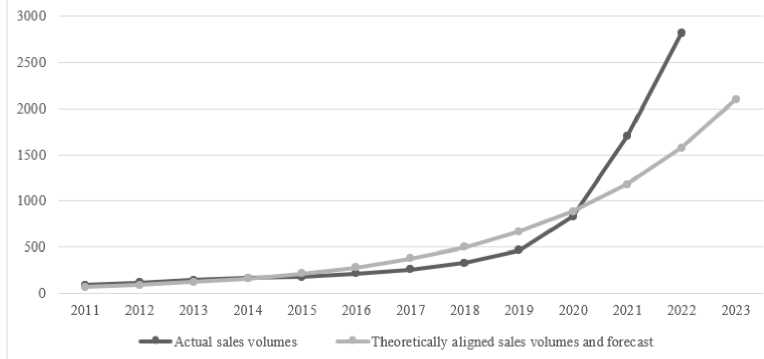
Figure 3. Sales volumes in the field of E-commerce in 2011-2022 in the Russian Federation (in million orders) and forecast for 2023
Let us analyze the same indicator in monetary terms (Figure 4).
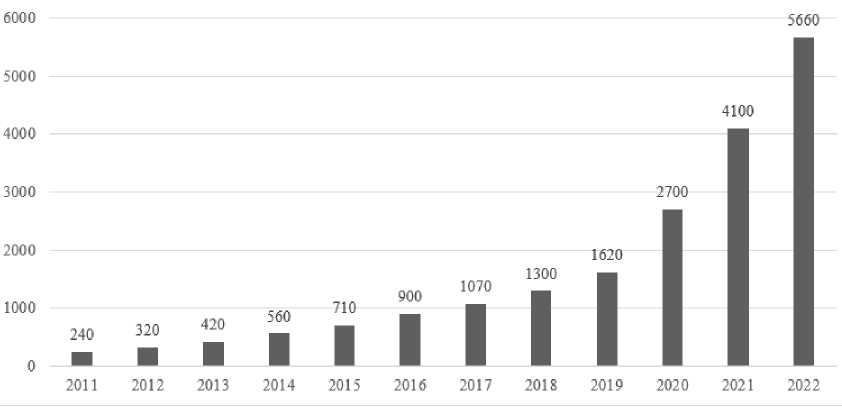
Figure 4. Sales volumes in the field of online commerce in 2011-2022 (in billion rubles) [4]
The above figure allows us to determine that there is a similar situation with the growth of online sales in monetary terms. Thus, over the period, sales increased by 2258.3% or 5420 billion rubles, from 240 billion rubles in 2011 to 5660 billion rubles in 2022. In the period before the pandemic the annual average indicator was at the level of 793.3 billion rubles, but in 2020-2022 it amounted to 4153.3 billion rubles.
To predict the volume of sales in the field of online commerce in 2022, we will make a trend equation. Similarly, the chart allows you to determine that this trend is exponential.
For convenience, all the necessary calculations were made using MS Excel and are displayed in the form of a table (Table 2).
Table 2. Calculations for the trend equation (of the sales volumes in billion rubles)
|
t |
t2 |
y |
ln(y) |
ln(y)*t |
ŷ |
ln(ŷ) |
(ln(y)-ln(y))2 |
(ln(y)- ln(ŷ))2 |
(t-t)2 |
(ln(y)-ln(y))2 |
|
|
1 |
1 |
240 |
5.48 |
5.481 |
232.17 |
5.45 |
2.25 |
0.0011 |
30.25 |
2.154 |
|
|
2 |
4 |
320 |
5.77 |
11.537 |
305.02 |
5.72 |
1.51 |
0.0023 |
20.25 |
1.393 |
|
|
3 |
9 |
420 |
6.04 |
18.121 |
400.72 |
5.99 |
0.91 |
0.0022 |
12.25 |
0.825 |
|
|
4 |
16 |
560 |
6.33 |
25.312 |
526.45 |
6.27 |
0.47 |
0.0038 |
6.25 |
0.385 |
|
|
5 |
25 |
710 |
6.57 |
32.826 |
691.64 |
6.54 |
0.17 |
0.0007 |
2.25 |
0.147 |
|
|
6 |
36 |
900 |
6.80 |
40.814 |
908.65 |
6.81 |
0.02 |
0.0001 |
0.25 |
0.021 |
|
|
7 |
49 |
1070 |
6.98 |
48.828 |
1193.75 |
7.08 |
0.02 |
0.0120 |
0.25 |
0.001 |
|
|
8 |
64 |
1300 |
7.17 |
57.361 |
1568.31 |
7.36 |
0.17 |
0.0352 |
2.25 |
0.049 |
|
|
9 |
81 |
1620 |
7.39 |
66.512 |
2060.40 |
7.63 |
0.47 |
0.0578 |
6.25 |
0.195 |
|
|
10 |
100 |
2700 |
7.90 |
79.010 |
2706.88 |
7.90 |
0.91 |
0.00001 |
12.25 |
0.907 |
|
|
11 |
121 |
4100 |
8.32 |
91.506 |
3556.21 |
8.18 |
1.51 |
0.02025 |
20.25 |
1.878 |
|
|
12 |
144 |
5660 |
8.64 |
103.694 |
4672.03 |
8.45 |
2.25 |
0.03680 |
30.25 |
2.865 |
|
|
г |
78 |
650 |
19600 |
83.381 |
581.001 |
18822.2 |
83.4 |
10.65 |
0.172 |
143 |
10.82 |
|
Mean |
6.5 |
54.17 |
1633.33 |
6.948 |
48.417 |
1568.52 |
6.95 |
0.89 |
0.014 |
11.92 |
0.902 |
For above data, the system of equations , „ - ( 12a + 78b = 83,381
has the form . Solv-
(. 78a + 650b = 581,001
ing the equation, we find a=5.17 and b=0.273.
From here, the trend equation takes the form y=176,72·e0.273t.
Evaluation of the significance of the equation according to the Fisher’s exact test: Fcalc.=619.186, which is more than
Ftabl.(0.05;1;10)=4.96. From this we can conclude that the equation is significant in Fisher’s test. Evaluation of the significance of the equation by Student's t-test: t-calc.=25.116, which is more than t-tabl.(0.05;10)=2.228. From this we can conclude that the equation is significant in t-test.
The coefficient of determination is 0.98. All of these criterions allow us to determine that the equation is suitable for forecasting.
Forecast: y(13)=176,72^e0273 * 13 =6137.96 billion rubles.
For clarity, the results are shown in the figure (Figure 5).
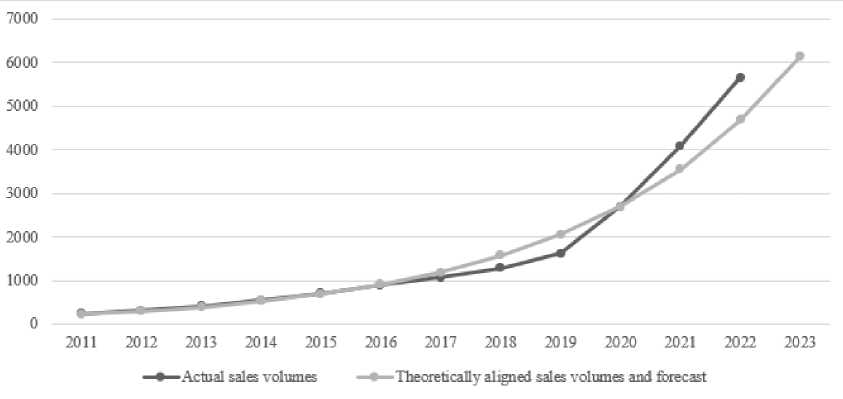
Figure 5. Sales volumes in the field of E-commerce in 2011-2022 in the Russian Federation (in billion rubles) and forecast for 2023
In general, it can be determined that the growth rate in million orders exceeded the growth rate in monetary terms, which was caused by a decrease in the average check (Figure 6).
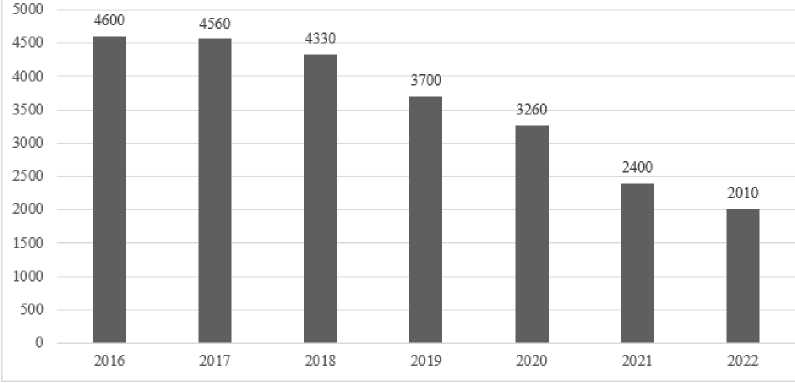
Figure 6. The average check in the field of online commerce in 2016-2022 (rubles) [4]
Although the data does not cover the whole period of 2011-2022, the above chart shows that the average check in E-commerce has been decreasing throughout the period of 2016-2022, and the coronavirus pandemic has accelerated this process. In the period before the pandemic (2016-2019) the average rate of increase (calculated using the Geometric mean formula) was at the level of -7% per year, but throughout the period of 2020-2022 it dropped to -18% per year.
This makes it possible to determine that along with the increase in the volume of online commerce, there was a significant expansion of the purchased range of goods, with a shift towards less expensive products, which was due to a decrease in the cost of delivery.
As a result of this research work, the following conclusions can be drawn:
-
1. The coronavirus pandemic has significantly affected the changes in consumer preferences of the population of the Russian Federation, which manifested in the fact of an increase of the volume of e-commerce and online sales.
-
2. The share of E-commerce in the total
volume of non-grocery retail doubled after the pandemic started (2020), from 10-13% in 2017-2019 to 21-30% in 2020-2022.
-
3. The coronavirus pandemic has greatly affected the growth in online sales. Over the period, sales increased by 2356.2% or 2097 million orders, from 89 million in 2011 to 2816 in 2022. In the period before the pandemic (2011-2019), the annual average indicator was at the level of 217.4 million orders, but in 2020-2022 it amounted to 1782 million orders. The growth before the pandemic was linear and steady, however, after the pandemic started the sales grew exponentially. The
exponential growth of the sales makes the task of forecasting much more interesting and, using trend model method, we forecasted the sales volume in 2023 to be on the level of 2095 million orders.
-
4. Similarly, the growth of the sales volumes in billion rubles was exponential, with a high jump in the period of the pandemic. Thus, over the period (2011-2022), sales increased by 2258.3% or 5420 billion rubles, from 240 billion rubles in 2011 to 5660 bil-
lion rubles in 2022. In the period before the pandemic the annual average indicator was at the level of 793.3 billion rubles, but in 20202022 it amounted to 4153.3 billion rubles. Again, using trend model method, we forecasted the sales volume in 2023 to be on the level of 6138 billion rubles.
-
5. Along with the increase of the volume of online commerce, there was a significant expansion of the purchased range of goods, with a shift towards less expensive products, which was due to a decrease in shipping costs, which led to a decrease in the average check in online commerce.
References Development of e-commerce in Russia: the influence of COVID-19 pandemic
- Ласенко Д.В. Российский ретейл в период пандемии // IN SITU. - 2022. - №1.
- Chernova V. Yu. Changes in the behavior of food market entities under the influence of the COVID-19 pandemic // Industrial economics. - 2021. - №4.
- Zhilina I. Yu. World trade during the COVID-19 pandemic // Economic and social problems of Russia. - 2021. - №4 (48).
- E-commerce in Russia 2022 (Research done by Data Insight). - [Электронный ресурс]. - Режим доступа: https://datainsight.ru/sites/default/files/DI_eCommerce_Russia_2022_0.pdf (дата обращения 10.04.2023).
- Svetunkov I.S. Methods of socio-economic forecasting in 2 volumes. V.2 models and methods: textbook and workshop for universities / I.S. Svetunkov, S.G. Svetunkov. - Moscow: Urait Publishing House, 2023. - 447 с. - (Higher education). - 978-5-534-02804-1.
- ISBN: 978-5-534-02804-1
