Development of small and medium-sized enterprises in the regions of Russia: cluster analysis taking into account the economic development of the territory

Author: Zakharova K.A., Baburina N.A.
Journal: Economic and Social Changes: Facts, Trends, Forecast @volnc-esc-en
Section: Regional economy
Article in issue: 4 т.16, 2023.
Free access
Regional economic processes determine the scale of functioning and performance of small and medium-sized enterprises due to their specific involvement in the economy of a territorial entity and quick response to changes in the external environment. The unevenness and high differentiation of economic development in the territories determine the heterogeneity and differences in the level of entrepreneurship development in Russia. In this regard, the aim of our study is to arrange Russian regions into clusters according to indicators reflecting the development of small and medium-sized enterprises and macroeconomic parameters characterizing the economic environment of their functioning, which either acts as a driving force or creates obstacles. The novelty of the approach consists not only in the fact that it integrates enterprises’ development indicators and indicators of the external economic environment of their functioning into the clustering parameters, but also in the formation of final clusters, taking into account the grouping of regions for each year of the period under consideration. This makes it possible to determine the stability of the territory in the group or to track the movement between groups. The k-means method is chosen for clustering. Clustering was carried out according to Federal State Statistics Service data from 2015 to 2021 in 85 regions of Russia. Five clusters have been obtained, whose features confirm the assumption that the development of small and medium-sized enterprises is determined by the economic development of the territory as an external environment of their functioning. Nevertheless, a special second cluster was identified, with the presence of restrictions on the use of the potential of the economic environment, which includes regions that differ in the average level of development of small and medium-sized enterprises against the background of high economic development. The results obtained can be used in the elaboration and implementation of policies to improve the sphere of small and medium-sized businesses at the level of the state as a whole and at the level of a particular region. Further development of our findings may consist in changing indicators or including other clustering algorithms, further typologizing regions or conducting correlation and regression analysis within individual clusters.
Small and medium-sized entrepreneurship, small and medium-sized enterprises, regions of Russia, grouping of regions, clustering, nonhierarchical cluster analysis, k-means method
Short address: https://sciup.org/147241612
IDR: 147241612 | UDC: 334.012.63-65 | DOI: 10.15838/esc.2023.4.88.6
Text of the scientific article Development of small and medium-sized enterprises in the regions of Russia: cluster analysis taking into account the economic development of the territory
The research was supported by Russian Science Foundation grant 23-28-01690, project/23-28-01690/.
Small and medium-sized enterprises (hereinafter referred to as SMEs) are in the focus of state development programs at both the national and regional levels. This is primarily due to its important role in ensuring employment and economic growth (Ayyagari et al., 2007; Toomsalu et al., 2019). The special significance of SMEs lies in their deep involvement in regional economic processes. They act as key subjects of the region’s economy, contribute to regional development, support business climate and competitive environment, influence productivity growth, the labor market and improving the region’s standard of living, contribute to more active implementation of import substitution, etc. SMEs, unlike large businesses, are more adaptive, responsive and effecient to changes in the external environment of functioning (Genc et al., 2019).
SMEs, due to their deep integration into the regional economy, build their activities primarily based on the needs of the local market, the volume and structure of local demand (Filonova, Bukreeva, 2013). The high degree of differentiation and the uneven level of economic development of Russia’s regions determine the territorial differences in the indicators of SMEs (Barinova et al., 2022). Changes in consumer behavior and business activity, wellfare of economic entities, employment and other indicators of the region’s economic development have an active impact on them. The relationship between the development of entrepreneurship (Zemtsov, 2020) and entrepreneurial activity (Obraztsova, Chepurenko, 2020) with the regional development has been repeatedly noted in the works of researchers. Thereby, it seems significant to evaluate the development of SMEs in the context of the regions’ economic development.
Russia is a complexly structured state that unites territories, heterogeneous in terms of economic development, with unique conditions for the activities of SMEs characterized by a multiplicity of parameters. This fact creates the need to group heterogeneous regions according to the level of development of SMEs, taking into account the determinants that have developed within the cluster. It is possible to divide a set of objects into homogeneous groups using clustering. Clustering helps to distinguish objects of interest in a group by certain criteria and plays an important role in management and decision-making processes (Sun et al., 2017). Therefore, in order to develop policy and make competent management decisions, it is necessary to cluster regions according to the indicators of development of SMEs and macroeconomic parameters characterizing the external economic environment of their functioning. It is the purpose of this research.
To achieve this goal, we solve the following tasks:
-
1) to consider theoretical and methodological approaches to cluster analysis of small and mediumsized enterprises;
-
2) to determine indicators of development of SMEs and macroeconomic indicators characterizing the economic environment of their functioning, which will be the basis for clustering, and their testing;
-
3) to conduct cluster analysis on selected indicators;
-
4) to identify and describe the clusters obtained, to interpret the results obtained.
The novelty of the approach lies in the fact that clustering is carried out not only according to indicators characterizing the development of SMEs, but also takes into account the indicators of economic development of the territory in which companies carry out their activities. In addition, the proposed dynamic approach to cluster analysis makes it possible to determine the stability of finding a region in a certain cluster or to track movements between classification groups.
Identification of groups of homogeneous regions based on a variety of heterogeneous data on the level of development of SMEs and economic development of the territory contributes to understanding the similarity of regions within a homogeneous cluster and the differences between the clusters themselves, allows identifying trends, challenges and threats, determinants and features of entrepreneurship development. The research significance lies in the possibility of applying the results obtained both for planning activities and for making managerial decisions on the development of SMEs in Russia both at the state level as a whole and at the level of individual regions.
Overview of existing approaches to cluster analysis of small and medium-sized enterprises
The use of cluster analysis of SMEs development has become widespread both in the foreign and in the Russian research field in the context of solving various research tasks. Classification of SMEs development is carried out by applying hierarchical or non-hierarchical clustering, as well as by combining these approaches.
We use cluster analysis to classify both on the basis of microdata, data of specific SMEs obtained from reporting or by conducting a questionnaire, and on the basis of aggregated data on the functioning of SMEs in individual regions.
In the foreign research field, clustering is primarily used in the analysis of data obtained on the functioning of specific SMEs from reports or surveys. In particular, we carried out cluster analysis to understand production strategies (Lorentz et al., 2016), to assess the factors determining the propensity to export (Haddoud et al., 2018), to study the impact of strategic orientation and knowledge management mechanisms on business efficiency (Jamie Pour, Asarian, 2019), to consider international strategy (Hagen et al., 2012), the introduction of lean manufacturing into activities (Zhou, 2016), the identification of problems and limitations of innovation (Bozic, Rajh, 2016), etc.
The Russian research field as a whole is represented by works based on cluster analysis of aggregated data by region. This approach is applied due to the complexity of the country’s structure and high degree of territories’ differentiation in terms of socio-economic development, which makes it possible to carry out economic and mathematical calculations on secondary regional data collected by the Federal State Statistics Service. The study of the works devoted to the assessment of the development of SMEs in Russia through the use of cluster analysis also revealed that the approaches differ not only by the chosen clustering methods, but also by the indicators that formed the basis of the grouping. In general, researchers conduct clustering, either taking into account indicators of the development of SMEs only (Filonova, Bukreeva, 2013; Levush-kina, 2015; Zemtsov, 2016; Shpak et al., 2019; Smirnov, 2021), or supplementing them with separate indicators of the development of the region (Obraztsova, Popovskaya, 2017; Sukhanova et al., 2019) or indicators of state financial support for entrepreneurship (Kuznetsov, Perova, 2020).
The works of researchers most often used the following indicators characterizing the development of SMEs in the region: the number of SMEs, their turnover, investments in fixed assets, the net financial result of activities, etc. Nevertheless, based on the goals set by the scientists, the set of indicators varied.
In particular, the work of Yu.A. Kuznetsov and V.I. Perova (Kuznetsov, Perova, 2020) analyzed the development of small business by applying neural network modeling methods for clustering regions. When performing cluster analysis, we used indicators of small business activity, such as the number, turnover, investments in fixed assets, the net financial result of the activities of the enterprises under consideration, the amount of subsidies allocated from the federal budget for state support of small business to the budgets of Russia’s constituent entities. They were applied in absolute values, without scaling, but at the same time monetary indicators were adjusted for inflation. Authors identified significant differences in the number of regions in the five clusters obtained by the results of the analysis, as well as a rather pronounced unevenness in the development of small businesses in Russia’s regions.
A similar set of indicators characterizing the development of SMEs in different combinations was used in the works of other authors (Pinko-vetskaya, 2014; Levushkina, 2015; Sibirskaya et al., 2016; Shpak et al., 2019). At the same time, the values of the indicators were brought to a comparable level for comparison, normalized either for the SME entity, or for the average number of employees, or for the population.
When selecting indicators for the typology of Russian regions for the development of SMEs, S.P. Zemtsov (Zemtsov, 2016) optimized a set of indicators, selected three variables characterizing the level, dynamics and potential of the development of the SME sector. In particular, to characterize entrepreneurial activity, the author proposed using the ratio of the number of small and medium-sized enterprises to the number of economically active population, to assess the growth of the SME sector – the ratio of revenue of small and medium-sized enterprises in 2013 to 2010, %; to determine the growth potential of the SME sector, the ratio of investment to revenue for the SME sector, %.
As a rule, clustering is carried out only according to the indicators of the development of SMEs without taking into account the socio-economic parameters of the regions. There are a few studies, where an attempt is made to integrate them into cluster analysis, which at the same time is not an independent tool for justifying the directions and selection of mechanisms for the development of SMEs or eliminating existing imbalances in its spatial development. In particular, in the article by E.I. Sukhanova, S.Yu. Shirnaeva, E.O. Konstantinova (Sukhanova et al., 2019) attempts to assess the development of small businesses using cluster analysis and econometric modeling. As factors, the authors selected variables characterizing the level of socioeconomic development of regions, indicators of the development of construction, industry, trade, education and employment of the population, and as an effective indicator – one of the main indicators of small business activity – the turnover of small enterprises. At the same time, the selected determinants do not fully characterize the economic environment of the functioning of SMEs, and the paper does not provide a justification for their choice. At the same time, only one indicator was chosen as characteristics of the development of small business – turnover, which, without taking into account other parameters of the company’s activity, does not reflect the state and development of the subject under consideration.
Studying the previous theoretical and empirical works has shown that clustering of regions based on the criteria of SMEs development does not lose relevance, allows solving many tasks, but at the same time is extremely truncated for complex accounting not only of indicators of the subject’s development, but also of the environment in which it operates. The exception is the study of O.I. Obraztsova, E.V. Popovskaya (Obraztsova, Popovskaya, 2017), who use multidimensional statistical analysis to characterize the external conditions of entrepreneurship development. The authors included a wide range of social, economic, institutional and other conditions in the region in the composition of the indicators of the external context of entrepreneurial activity, for the assessment of which 144 indicators are used, folding them using the method of principal components. Researchers in the context of the contextual approach to the analysis of entrepreneurial activity note that it is necessary to take into account the dependence of the entrepreneurial activity level in the region not only on the framework conditions of entrepreneurial activity at a particular time, but also on the parameters of their dynamics. Thus, along with level variables, incremental indicators are used in one multidimensional model. This work makes a significant contribution to the deepening of the methodology of multidimensional analysis in relation to the assessment of the external conditions of entrepreneurial activity and the use of its capabilities in order to determine the content and set of tools of state support programs to activate the entrepreneurial potential of the population.
The analysis of the presented approaches makes it possible to note that, despite the use of a wide range of indicators over several years, including the use of dynamic indicators in clustering, the studies do not take into account the movement of the region from cluster to cluster as a result of changes in entrepreneurial activity under the influence of changes in the external economic environment of the SMEs functioning. As a rule, one multidimensional model is built over several years. Our work proposes a different approach involving the construction of a multidimensional model for each year of the research period. Studying the movement of regions between clusters is of significant practical importance for determining the development potential or sensitivity of SMEs to changes in the external economic environment of functioning.
Methods and data
We chose the clustering method as the main method of grouping and typologization in the work. Clustering makes it possible to understand the structure of many indicators for the development of SMEs and the economic development of the territory by dividing them into groups of similar objects. This will make it possible to further optimize the subsequent data processing and improve the efficiency of management decisions based on the results obtained for each cluster separately.
Clustering was primarily based on the k-means method (McQueen, 1967), aimed at dividing n observations into k clusters. This method belongs to the class of nonhierarchical clustering, is characterized by simplicity, ease of implementation and clarity of interpretation of the results obtained.
A large number of observations are distributed over a certain number of clusters, where each observation belongs to the nearest cluster. Affiliation is determined using a cluster mean.
Clustering was carried out for the period from 2015 to 2021. Clusters were built for each year of the period. This approach allows tracking the movement of a region between clusters, as well as identifying the stability of finding a region in a certain group. The final clusters were determined based on the principle of the majority of years the region was in the cluster. We carried out clustering using an environment for statistical computing and graphics R.
We used indicators of not only the development of SMEs, but also indicators of the economic environment as characteristics when classifying regions by clustering. The indicators underlying clustering are presented in Table 1 . In conducting this study, we used the Federal State Statistics Service data. To assess the development of SMEs, we took the data from the statistical collection “Small and medium-sized entrepreneurship in Russia”, in particular from the appendix, which provides information in the context of the constitute entities Russian Federation. All indicators are given to a comparable form. To take into account the size of the territory and
Table 1. Indicators underlying regions’ clustering by the development level of SMEs taking into account the economic development of the territory
|
Designation |
Name of indicator |
Justification |
|
Indicators characterizing economic development of a region |
||
|
Х1 |
Investments in fixed capital per capita, rubles |
Investment and technological development acts as a guarantee of economic development and influences SME development (Pinkovetskaya, 2018; Gherghina et al., 2020) |
|
X2 |
Share of investments aimed at reconstruction and modernization in the total volume of investments in fixed assets, % |
|
|
Х3 |
Gross regional product per capita, rubles |
Economic growth promotes SME development (Surya et al., 2021); GRP at the regional level, like GDP (GNI) at the country level, is a key indicator of economic development and a criterion for SME growth (Golikova, Kuznetsov, 2017; Tambunan, 2008) |
|
X4 |
Indices of physical volume of gross regional product per capita, % |
|
|
X5 |
Unemployment rate, % |
Unemployment affects entrepreneurial activity (Tarunina, Mavrina, 2015) and creation of new firms (Storey, 1991; Mazzarol et al., 1999); the unemployment rate is one of the key indicators of the state of the labor market (Lukyanova, Oshchepkov, 2007); the duration of unemployment characterizes the tension of the labor market, is an indicator sensitive to external changes, is a sensitive criterion of changes in the economic environment, complementing the unemployment rate (Corak, Heisz, 1996; Nanavian, 2012) |
|
Х6 |
Average duration of job search by the unemployed, months |
|
|
Х7 |
Average per capita money income, rubles |
The standard of living affects the functioning of SMEs; the availability of capital and purchasing demand, provided by high incomes of the population, act as key factors in the development of entrepreneurship (Kremin, Rossoshansky, 2020). Demand contraction negatively affects the number of SMEs (Zemtsov, Mikhailov, 2021), and the change in its structure towards a lower price segment as a result of negative economic consequences due to income reduction and poverty growth negatively affect the business activity of SMEs in the economy (Kelarev, 2021) |
|
Х8 |
Ratio of average per capita money income to the subsistence minimum level, % |
|
|
Х9 |
Population with money income below the subsistence minimum level, % |
|
|
Х10 |
Consumer expenditures on average per capita per month, rubles |
|
End of Table 1
When choosing indicators for the development of SMEs and the economic development of territories, we took into account the specifics of the formation of statistical indicators of the Federal State Statistics Service. It is also worth noting that all cost indicators have been cleared of the impact of price changes and brought to the price level of the base year. To improve the quality of clustering, we carried out an assessment of indicators for multicollinearity, according to the results of which the indicator X3 was excluded from the indicators taken into account during classification. Table 2 gives descriptive statistics of the studied variables X1–X2, X4–X15. To optimize the size of the table, the data is presented at the beginning, middle and end of the analyzed period.
The coefficient of variation for all the studied years indicates that most indicators are characterized by a high spread of values. Thus, with the
Table 2. Descriptive statistics of the indicators of development of SMEs selected for clustering, taking into account the economic development of the territory
|
Indicator |
Year |
Average value |
Minimum value |
Maximum value |
Variation coefficient, % |
|
Х1 |
2015 |
136385.22 |
16088.00 |
2625863.99 |
235.72 |
|
2018 |
141093.38 |
25352.84 |
1912070.55 |
195.86 |
|
|
2021 |
145858.63 |
32036.55 |
1701090.30 |
170.59 |
|
|
Х2 |
2015 |
18.59 |
1.50 |
36.50 |
41.96 |
|
2018 |
18.55 |
3.10 |
36.40 |
41.83 |
|
|
2021 |
18.27 |
2.41 |
44.97 |
43.95 |
|
|
Х4 |
2015 |
100.07 |
94.30 |
108.30 |
2.86 |
|
2018 |
102.40 |
92.60 |
114.40 |
2.30 |
|
|
2021 |
105.03 |
97.10 |
120.30 |
3.46 |
|
|
Х5 |
2015 |
6.76 |
1.80 |
30.50 |
56.07 |
|
2018 |
6.00 |
1.20 |
26.60 |
56.83 |
|
|
2021 |
5.92 |
2.00 |
31.10 |
66.72 |
End of Table 2
|
Indicator |
Year |
Average value |
Minimum value |
Maximum value |
Variation coefficient, % |
|
Х6 |
2015 |
7.44 |
5.36 |
12.28 |
16.80 |
|
2018 |
7.43 |
3.92 |
11.51 |
17.09 |
|
|
2021 |
7.00 |
3.46 |
12.77 |
21.71 |
|
|
Х7 |
2015 |
27731.35 |
15190.61 |
72146.20 |
39.75 |
|
2018 |
27079.99 |
14047.65 |
72449.96 |
43.66 |
|
|
2021 |
27649.89 |
14003.02 |
78906.49 |
47.39 |
|
|
Х8 |
2015 |
271.07 |
158.80 |
426.60 |
21.18 |
|
2018 |
275.43 |
156.80 |
500.10 |
22.04 |
|
|
2021 |
288.57 |
165.40 |
568.50 |
23.96 |
|
|
Х9 |
2015 |
15.18 |
7.10 |
36.90 |
34.19 |
|
2018 |
14.26 |
5.80 |
34.40 |
35.83 |
|
|
2021 |
13.08 |
4.60 |
29.30 |
36.09 |
|
|
Х10 |
2015 |
20108.89 |
7485.00 |
48277.00 |
31.67 |
|
2018 |
20532.68 |
8604.20 |
48446.49 |
31.79 |
|
|
2021 |
20938.72 |
8081.13 |
47822.56 |
30.47 |
|
|
Х11 |
2015 |
112.88 |
110.33 |
127.64 |
2.03 |
|
2018 |
104.22 |
101.84 |
106.00 |
0.78 |
|
|
2021 |
108.46 |
103.67 |
111.82 |
1.18 |
|
|
Х12 |
2015 |
274364.80 |
17109.38 |
1150280.19 |
60.92 |
|
2018 |
257374.50 |
29268.75 |
1179351.59 |
61.82 |
|
|
2021 |
262857.79 |
34799.91 |
944921.35 |
58.93 |
|
|
Х13 |
2015 |
0.08 |
0.01 |
0.18 |
37.50 |
|
2018 |
0.08 |
0.01 |
0.15 |
37.50 |
|
|
2021 |
0.07 |
0.01 |
0.18 |
42.86 |
|
|
Х14 |
2015 |
13.41 |
1.56 |
31.94 |
40.12 |
|
2018 |
14.41 |
1.96 |
42.60 |
48.23 |
|
|
2021 |
12.87 |
2.75 |
33.74 |
43.51 |
|
|
Х15 |
2015 |
116079.73 |
-387053.00 |
434044.07 |
83.83 |
|
2018 |
184118.59 |
49975.26 |
1067081.26 |
82.46 |
|
|
2021 |
312378.54 |
-150254.22 |
1039113.47 |
49.75 |
According to: Federal State Statistics Service data.
exception of the GRP per capita physical volume index, the average duration of job search by the unemployed, the ratio of the average per capita money income to the subsistence minimum, the consumer price index, all other indicators of economic development and the development of SMEs differ significantly by Russia’s regions. This is the basis for the assumption about the possibility of forming clusters due to the high degree of differentiation of regions by the SMEs development level and the economic environment of their functioning.
Research results
Clustering by the k-means method is used for a predetermined number of clusters, the finding of which is a priority task. To solve this problem, first of all, we applied the “elbow method” (Yuan, Yang, 2019) ( Fig. 1 ). Also, to clarify the results, we carried out the construction of hierarchical clustering by the Ward method (Ward, 1963), which is recommended to be used at the initial stage of clustering (Punj, Stewart, 1983) ( Fig. 2 ). Evaluation of the results showed that the optimal number of clusters in most years of the analyzed period is five.
Figure 1. The optimal number of clusters by the “elbow method”
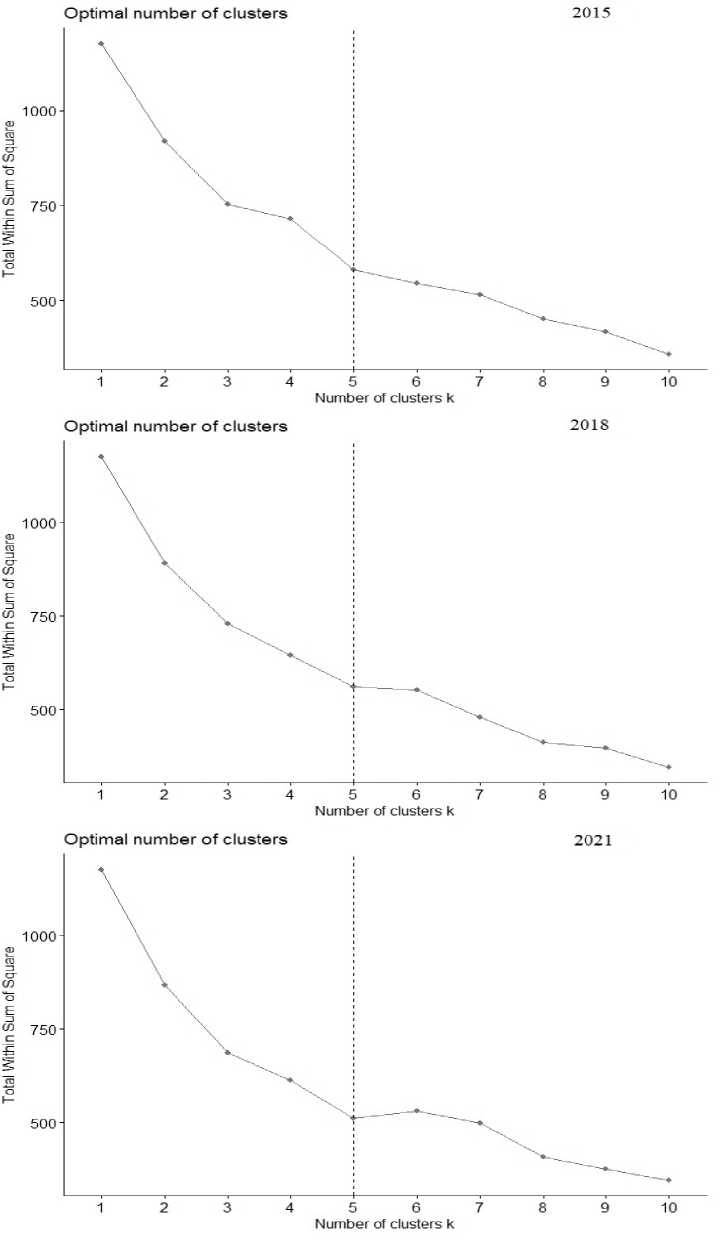
Source: own compilation.
Figure 2. Hierarchical clustering by Ward method to determine the optimal number of clusters
10 15 20 0 5 10 15 20 25 0 5 10 15 20
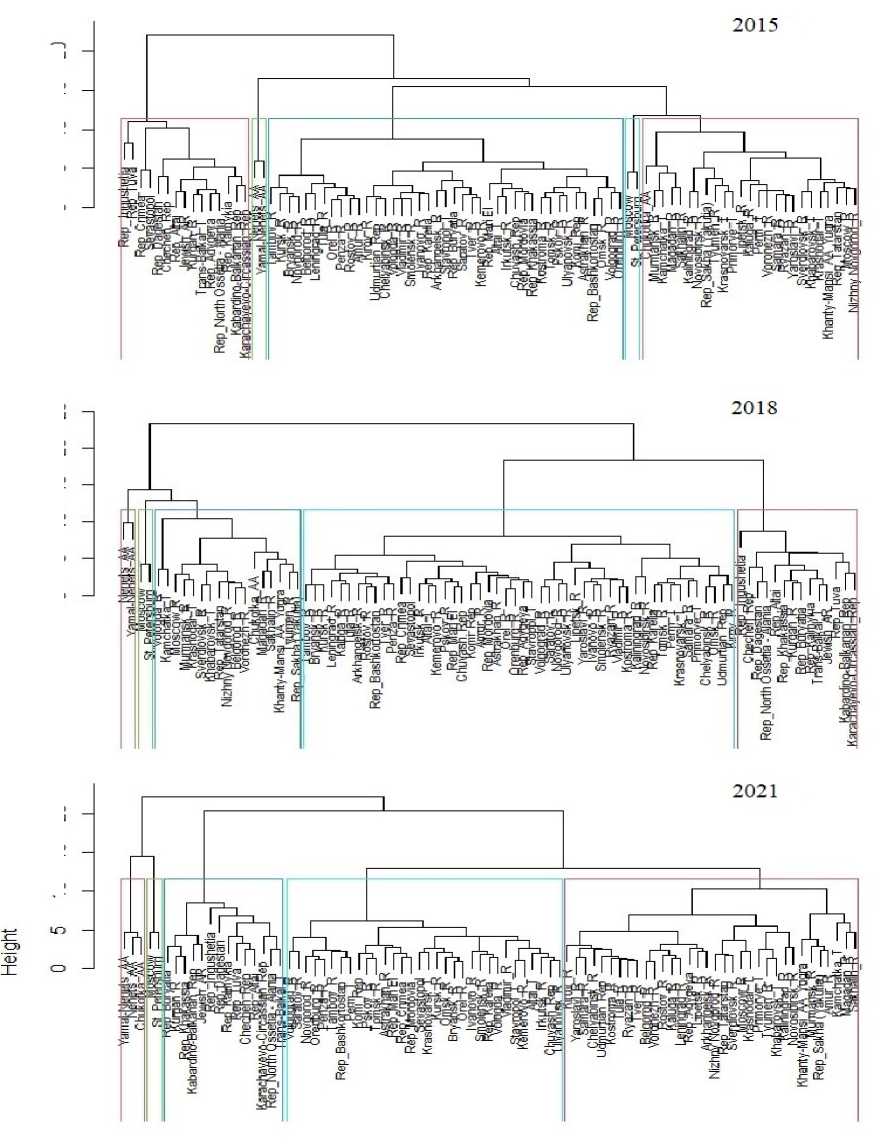
Source: own compilation.
Cluster analysis by the k-means method allowed of clustering, as well as earlier tests for the optimal identifying five groups of homogeneous regions number of clusters, are given at the beginning, for each year of the analyzed period. The results middle and end of the analyzed period ( Fig. 3 ).
Figure 3. Results of cluster analysis of the RF regions by the development level of SMEs, taking into account the economic development of the territory by the k-means method
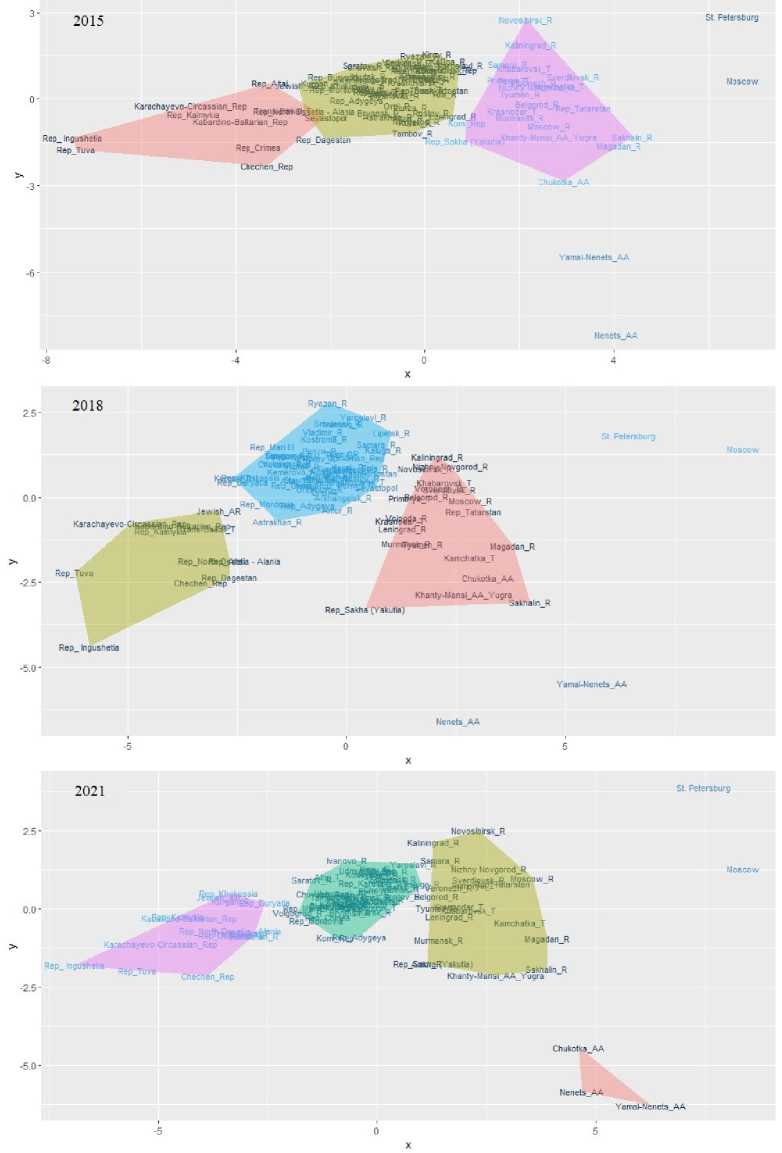
Source: own compilation.
In order to visualize the movement of separate Russia’s constitute entities in clusters or to determine the constancy of their presence in a certain group for the period from 2015 to 2021, we present a summary of the results of cluster analysis in Figure 4.
Figure 4. Results summary of the cluster analysis of the RF regions on the development level of SMEs, taking into account the economic development of territories for 2015–2021
1 2 3 4 5
Belgorod Obl.
Bryansk Obl.
Vladimir Obl.
Voronezh Obl.
Ivanovo Obl.
Kaluga Obl.
Kostroma Obl.
Kursk Obl.
Lipetsk Obl.
Moscow Obl.
Orlov Obl.
Ryazan Obl.
Smolensk Obl.
Tambov Obl.
Tver Obl.
Tula Obl.
Yaroslavl Obl.
Moscow м
Rep. of Karelia
Rep. of Komi
Nenets AO
Archangelsk Obl. (without AO)
Vologda Obl.
Kaliningrad Obl.
Leningrad Obl.
Murmansk Obl.
Novgorod Obl.
Pskov Obl.
Saint Petersburg и
Rep. of Adygea
Rep. of Kalmykia
Rep. of Crimea
Krasnodarsky Krai Astrakhan Obl.
Volgograd Obl.
Rostov Obl.
Sevastopol
Rep. of Dagestan
Rep. of Ingushetia
Kabardino-Balkaria Rep.
Karachay-Cherkessia Rep.
Rep. of North Ossetia-Alania
Chechen Rep.
Stavropol Krai
Rep. of Bashkortostan
Rep. of Mari El
Rep. of Mordovia
Rep. of Tatarstan Udmurtia Obl.
Chuvash Rep. - Chuvashia
Perm Krai
Kirov Obl.
Nizhny Novgorod Obl.
Orenburg Obl.
Penza Obl.
Samara Obl.
Saratov Obl.
Ulyanovsk Obl.
Kurgan Obl.
Sverdlovsk Obl.
Khanty-Mansi AO – Yugra
Yamalo-Nenets AO
Tyumen Obl. (without AO) Chelyabinsk Obl.
Rep. of Altai
Rep. of Tyva
Rep. of Khakassia
Altai Krai
Krasnoyarsk Krai
Irkutsk Obl.
Kemerovo Obl. – Kuzbass Novosibirsk Obl.
Omsk Obl.
Tomsk Obl.
Rep. of Buryatia
Zabaikalsky Krai
Rep. of Sakha (Yakutia) Kamchatka Krai
Primorsky Krai Khabarovsk Krai
Amur Obl.
Magadan Obl.
Sakhalin Obl. х
Jewish AO Chukotka AO
■ 2015 ■2016 ^2017 «2018 12019 ■ 2020 * 2021
Source: own compilation.
During the study of the regional composition of clusters in dynamics from 2015 to 2021, we revealed the features of the trajectory of movement of territories by groups. In particular, the regions are moving only one cluster up or one cluster down, with the exception of Sevastopol, which, under the influence of significant investment injections in 2014 and 2015 and a significant increase in living standards against a low base, moved from the fifth to the third cluster in 2016, but subsequently consolidated in the fourth cluster. Also, the trajectories of moving regions are, as a rule, within the zone of two clusters. The relocation occurs as a consequence of changes in economic processes in the region and the SMEs development potential. A region with the potential for economic development and the development of SMEs is moving from the most typical cluster on a temporary or permanent basis to a more developed one. And the region that is sensitive to the external impact of negative factors moves to the cluster below. It is necessary to monitor and interpret the repeated transitions of the region from one cluster to another and the consolidation of the territory for two or more periods in the group after the transition, since a one-time movement, as a rule, is not supported by long-term trends in the development of the economic environment and changes in the activities of SMEs, may be caused by the specifics of collecting statistical data in the region or individual emissions.
We carried out the final clustering according to the principle of most years of the region being in a certain group for the analyzed period. The map of Russia shows the geographical location of the clusters obtained ( Fig. 5 ).
The first cluster includes regions with a high level of development of SMEs against the background of a high level of economic development characterized by a very high standard of living and consumer spending. The cluster’s average indicators of the SMEs development are more than twice as high as the average indicators for the third cluster, which is characterized by an increased level of their functioning. The first cluster includes Moscow and Saint Petersburg.
Figure 5. Map of clusters of Russian regions by the SMEs development level, taking into account the economic development of the territory
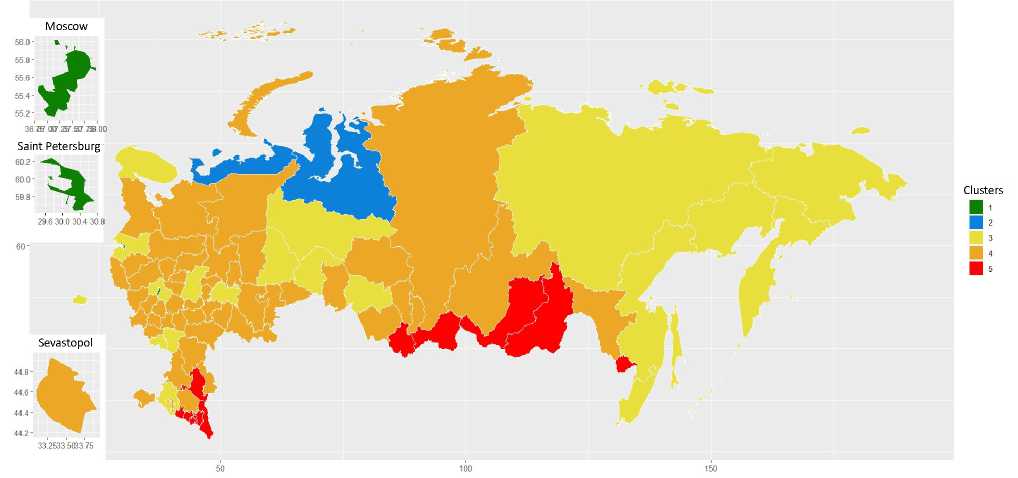
Source: own compilation.
A favorable economic environment characterized by very high consumer demand due to the high standard of living, the diversity of the consumer market and the efficient transport and logistics system of its service, the development of the service sector, entertainment, recreation and tourism, the concentration of business and financial activity, acts as a potential for the SMEs development in these regions. As a rule, agglomeration and institutional factors are the key factors ensuring the current position of the territories under consideration in the first cluster.
The third cluster gathered regions with an increased level of SMEs development against the background of an average level of economic development with pronounced increased living standards and consumer spending. The regions of this cluster are fairly stable in it. The only region with the potential to move to another cluster is the Chukotka Autonomous Okrug. Since 2020, it has been moving to the second cluster due to more dynamic economic growth, an increase in fixed capital investment per capita, an increase in living standards while reducing the growth rate of key indicators of the functioning of SMEs relative to other regions of this group. The position of the regions in the third cluster as a whole is provided by resource, institutional, geographical factors. Basically, the position is formed under the influence of the effects of interregional interaction, favorable geographical location and wealth of natural resources of individual regions, human capital, developed infrastructure and institutions. A feature of this cluster is also the determination of SME development by high solvent demand against the background of a high standard of living.
The fourth cluster is formed by regions with an average level of development of SMEs against the background of an average level of economic development. In general, they also differ in the stability of being in a group. Nevertheless, there are regions in this cluster that have been in other groups for two or more years. For example, the Republic of Crimea, which moved in 2017 from the fifth cluster directly to the fourth, and Sevastopol, which in 2016 moved from the fifth cluster immediately to the third, but, having failed to maintain the set growth rates of the indicators under consideration, in 2018 found itself in the fourth cluster, in which it gained a foothold. The transition was ensured by high growth rates of key indicators of economic development and SMEs development as a result of the implementation of programs for the development of these territories and the formation of a free economic zone, as a result – a significant increase in investment in fixed assets, a decrease in inflation, an increase in living standards and the activation of entrepreneurial initiatives.
Also, in the fourth cluster there are regions characterized by instability and sensitivity to changes. In particular, the Kurgan Oblast and the Republic of Khakassia have been classified in the fifth cluster since 2019. The transition was primarily due to a decrease in per capita income with a simultaneous increase in inflation, which caused a reduction in effective demand and affected the reduction in the number of SMEs and employees in the sector per capita. The statistics of the following years will show whether the movement of these regions will be final or a temporary deterioration of the situation. Based on the chosen principle of assigning a region to a particular cluster, they remain in the fourth cluster for the time being.
In the fifth cluster, which includes regions with a low level of development of SMEs and a low level of economic development, there are almost all subjects of the North Caucasus Federal District (except Stavropol Krai), as well as the republics of
Kalmykia, Altai, Tyva, Buryatia, Zabaikalsky Krai, the Jewish Autonomous Oblast. The entry of most regions into this cluster is due to the low level of investment development, low rates of economic growth, an unfavorable institutional environment, a high level of informal employment, and a weak level of entrepreneurship development.
Table 3 presents the characteristics of the final clusters in more detail.
The results obtained based on the results of the cluster analysis generally confirm the assumption that the economic environment acts as a driver or forms constraints on the development of SMEs. The most significant is the first cluster, which accounts for 26% of all registered SMEs and almost 32% of turnover, while it is represented by only two regions. The attractiveness of the environment, the high level of business activity, the availability of resources for development, developed institutions are the key determinants that stimulate the development
Table 3. Clusters of regions according to the development level of SMEs, taking into account the economic development of the territory
|
no |
Cluster characteristics |
Regions included in the cluster |
Performance indicators of SMEs in 2021 |
||
|
% of enterprises |
% of turnover |
Turnover per organization, million rubles |
|||
|
1. |
High level of SMEs development against the background of a high level of the region’s economic development characterized by very high living standards and consumer spending levels |
Moscow, Saint Petersburg |
26.25 |
32.20 |
36.72 |
|
2. |
Average level of SMEs development against the background of high level of economic development of the region |
Nenets Autonomous Okrug, Yamalo-Nenets Autonomous Okrug |
0.21 |
0.23 |
32.28 |
|
3. |
Higher level of SMEs development against the background of an average level of economic development with pronounced higher standards of living and consumer spending |
Belgorod Oblast, Voronezh Oblast, Moscow Oblast, Kaliningrad Oblast, Leningrad Oblast, Murmansk Oblast, Krasnodar Krai, Republic of Tatarstan, Nizhny Novgorod Oblast, Sverdlovsk Oblast, Khanty-Mansi Autonomous Okrug – Yugra, Tyumen Oblast (without AO), Novosibirsk Oblast, Republic of Sakha (Yakutia), Kamchatka Krai, Primorsky Krai, Khabarovsk Krai, Magadan Oblast, Sakhalin Oblast, Chukotka Autonomous Okrug |
31.11 |
31.48 |
30.29 |
End of Table 3
|
no |
Cluster characteristics |
Regions included in the cluster |
Performance indicators of SMEs in 2021 |
||
|
% of enterprises |
% of turnover |
Turnover per organization, million rubles |
|||
|
4. |
Average level of development of SMEs against the average level of economic development of the region |
Bryansk Oblast, Vladimir Oblast, Ivanovo Oblast, Kaluga Oblast, Kostroma Oblast, Kursk Oblast, Lipetsk Oblast, Orel Oblast, Ryazan Oblast, Smolensk Oblast, Tambov Oblast, Tver Oblast, Tula Oblast, Yaroslavl Oblast, Republic of Karelia, Komi Republic, Arkhangelsk Oblast (without AO), Vologda Oblast, Novgorod Oblast, Pskov Oblast, Republic of Adygea, Republic of Crimea, Astrakhan Oblast, Volgograd Oblast, Rostov Oblast, Sevastopol city, Stavropol Krai, Republic of Bashkortostan, Republic of Mari El, Republic of Mordovia, Udmurt Republic, Chuvash Republic, Perm Krai, Kirov Oblast, Orenburg Oblast, Penza Oblast, Samara Oblast, Saratov Oblast, Ulyanovsk Oblast, Kurgan Oblast, Chelyabinsk Oblast, Republic of Khakassia, Altai Krai, Krasnoyarsk Krai, Irkutsk Oblast, Kemerovo Oblast – Kuzbass, Omsk Oblast, Tomsk Oblast, Amur Oblast |
40.02 |
34.68 |
25.94 |
|
5. |
Low level of development of SMEs against the background of low level of economic development of the region |
Republic of Kalmykia, Republic of Dagestan, Republic of Ingushetia, Republic of Kabardino-Balkaria, Republic of Karachay-Cherkessia, Republic of North Ossetia-Alania, Chechen Republic, Republic of Altai, Republic of Tyva, Republic of Buryatia, Zabaikalsky Krai, Jewish Autonomous Oblast |
2.41 |
1.41 |
17.51 |
Source: own compilation based on the results of cluster analysis, calculations of indicators are based on the Federal State Statistics Service data and the Unified Register of SMEs of the Federal Tax Service (https://ofd. .
of entrepreneurship in these regions. At the same time, the unfavorable economic environment determines the low level of development of SMEs. The fifth cluster is represented by twelve regions, which account for only 2.41% of registered SMEs, 1.41% of their turnover, and one organization has the smallest turnover of all clusters (17.51 million rubles).
Discussion
In the paper, we proposed an approach to determine the parameters for conducting a cluster analysis of the development of SMEs, based on the use of not only indicators of the company’s development, but also indicators of the environment in which the company operates. The contribution of this study to the development of the methodology of SMEs analysis is the use of the k-means clustering method to take into account the indicators of economic development of the territory and the development of SMEs in the classification together.
To carry out cluster analysis, we selected the key indicators of the region’s economic development, which form the external economic environment of the functioning of SMEs. The results obtained do not contradict the conclusions of modern research and complement them, thereby developing ideas about the influence of the environment and individual determinants on the development of SMEs.
Among the key indicators that determine the economic environment of functioning and affect the SMEs development, researchers highlight investment development and economic growth, unemployment and inflation, and living standards. Investments in fixed assets have an impact on regional economic development and the SMEs growth turnover (Pinkovetskaya, 2018; Gherghina et al., 2020). In territories with a higher level of GDP (GRP) per capita, higher production scales of SMEs are recorded (Golikova, Kuznetsov, 2017), real gross domestic product per capita positively affects the growth of SMEs (Tambunan, 2008) and economic growth is a determinant of increasing the productivity of small and medium-sized enterprises (Surya et al., 2021). Researchers have repeatedly raised the issue of the impact of unemployment and its duration on entrepreneurial activity (Tarunina, Mavrina, 2015) and the creation of new firms (Storey, 1991; Mazzarol et al., 1999). The impact of inflation on the development of entrepreneurship is also in the focus of modern research (Bekeris, 2012; Ipinnaiye et al., 2017).
Economists also note that to characterize the state of the economy, it is important to take into account the income and consumption of the population (Kuznetsova, 2021). The standard of living has a direct impact on the SMEs development. High incomes ensure the availability of capital and consumer demand, which are factors of entrepreneurship development (Kremin, Rossoshansky, 2020), the compression of which negatively affects the number of SMEs (Zemtsov, Mikhailov, 2021). The economic environment is important for the development and growth of enterprises, as well as the market, driven primarily by real incomes per capita (Tambunan, 2009). A reduction in income and an increase in poverty entail negative economic consequences, which manifest themselves in a decrease in the purchasing power of the population and a change in the structure of demand toward a lower price segment, negatively affect the business activity of SMEs in the economy (Kelarev, 2021).
The questions raised in the works of researchers about the impact of macroeconomic indicators on the development of SMEs are significant for understanding the features of the functioning of SMEs in Russia’s regions, characterized by uneven and high degree of differentiation of economic development. The obtained clustering results confirm the assumption that it is the economic environment determined by the set of determinants under consideration that acts as either a driver or a limiter of the SMEs development. In economically depressed regions, the development of entrepreneurship is at a low level. In economically developed regions, with a high standard of living, SMEs are characterized by an increased development level.
The presented study has limitations that form opportunities for future research. First of all, we set the task to study the grouping of regions by the SMEs development level against the background of the regions’ economic development. But the resulting clusters contain regions with different social, geographical, technological, institutional and other profiles, indicators of which can be included in the analysis in order to identify additional features of the development of SMEs and work out a more targeted policy to improve the effectiveness of their activities. Also, in the work, we use secondary data for cluster analysis, which assume a limited number of variables collected by statistical bodies, and thereby the impossibility of including comprehensive indicators of the effectiveness and sustainability of the functioning of SMEs in the model.
In addition, the development of the results of the conducted research may be in the plane of using other clustering algorithms or a combination of them for comparative characteristics of the obtained values. It is also possible to apply the research results for subsequent correlation and regression analysis within individual clusters in order to identify the determinants of the development of SMEs.
Conclusion
In the course of the research, we carried out the clustering of regions using the k-means method. For clustering, we used the Federal State Statistics Service data reflecting the development of SMEs and the economic development of 85 Russia’s regions from 2015 to 2021. As indicators characterizing the economic development of the region and influencing the development of entrepreneurship, we took into account investments in fixed assets per capita, the share of investments aimed at reconstruction and modernization in the total volume of investments in fixed assets, gross regional product per capita, indices of the physical volume of gross regional product per capita, the unemployment rate, average duration of job search by the unemployed, average per capita money income, the ratio of the average per capita money income to the subsistence minimum level, the number of people with money incomes below the subsistence minimum level, consumer spending on average per capita, consumer price index. To characterize the SMEs activities, we selected the following indicators: the number of SME enterprises per 1,000 people of the population, the turnover of small and medium-sized enterprises per capita, the net financial result of small and mediumsized enterprises per employee, the number of employees of small and medium-sized enterprises per capita.
To determine the number of clusters and obtain more reliable results, we simultaneously used the Ward method hierarchical clustering approach and the “elbow method”. We have found that the optimal number is 5 clusters. The conducted nonhierarchical cluster analysis by the k-means method allowed obtaining the following results. The first cluster includes regions with a high level of development of SMEs against the background of a high level of economic development of the territory. The second cluster is regions with an average level of development of SMEs against the background of a high level of economic development of the territory. The third cluster is regions with an increased level of SMEs development against the background of an average level of economic development with pronounced increased living standards and consumer spending. The fourth is regions with an average level of development of SMEs against the background of an average level of economic development of the territory. The fifth cluster is regions with a low level of development of SMEs against the background of a low level of economic development of the territory. In general, it is confirmed that the economic environment of functioning determines the level of development of SMEs. At the same time, there are special regions, such as Nenets and Yamalo-Nenets Autonomous okrugs, in which, despite a very high level of economic development, the performance indicators of SMEs are at an average level.
We also built a map of the final clusters, which helps to visually see their distribution across Russia’s territory, therefore, visualize the spatial features of the development of SMEs against the background of the economic development of territories and thereby take them into account in future studies, for example, when building spatial econometrics models.
The paper proposed a dynamic approach to the study of changes in the composition of clusters. The analysis of the movement of regions in clusters over the seven years of the analyzed period allowed determining the trajectories of their movement, stability or instability of the location of individual territories in the cluster. A feature of the trajectories was the movement only within the boundaries of the two clusters. Temporary or permanent relocation to a higher cluster is observed in regions with the potential for the development of SMEs against the background of improving indicators of economic development of the territory, and regions sensitive to negative changes in the external environment move to the cluster below. The transition of regions to higher clusters can be ensured not only due to the intensification of economic development, taking into account the individual characteristics of a particular territory and maintaining high dynamics of indicators, but also by eliminating the limitations of the economic environment for the development of SMEs. The existing limitations of effective demand in the regions of the fourth cluster, which hinder the development of SMEs, can be overcome through its stimulation by improving the standard of living, the implementation of projects in the tourism and entertainment spheres to attract citizens from other regions, the development of the retail market. It is also possible to shift the focus to measures to support SMEs in priority areas for each region, which, on the one hand, will attract financial resources for development, on the other hand, will reduce costs and the cost of final products and services, thereby stimulating consumer demand. For example, it can be subsidizing loans and leasing agreements, expanding subsidies for agribusiness, etc. For the second cluster, the key to improving the effectiveness and level of activity of SMEs can be the expansion of the sales market by developing transport infrastructure and improving logistics, improving the quality and expanding the range of products and services, including leisure and household, the development of services aimed at servicing large businesses, by transferring noncore areas to SMEs and the implementation of large infrastructure projects in the fuel and energy sector.
The obtained results contribute to the development of the methodology of analysis of SMEs through the use of cluster analysis and can be used in further research to study in more depth the reasons for the relocation of regions to other clusters. Such an analysis, supplemented by a profile of regions reflecting distinctive characteristics, strengths and weaknesses, can be used to develop point-based and differentiated management decisions aimed at the formation and implementation of state policy to enhance the development and efficiency of SMEs, taking into account the economic environment of their activities.
References Development of small and medium-sized enterprises in the regions of Russia: cluster analysis taking into account the economic development of the territory
- Ayyagari M., Beck T., Demirguc-Kunt A. (2007). Small and medium enterprises across the globe. Small Business Economics, 29, 415–434. DOI: 10.1007/s11187-006-9002-5
- Barinova V.A., Gladkii A.S., Demidova K.V. et al. (2022). Malyi i srednii biznes v regionakh Rossii: trendy, draivery i antikrizisnaya politika: Natsiona’nyi doklad [Small and Medium-Sized Business in Russian Regions: Trends, Drivers and Anti-crisis Policy: National Report]. Moscow: Rossiiskaya akademiya narodnogo khozyaistva i gosudarstvennoi sluzhby pri Prezidente Rossiiskoi Federatsii.
- Bekeris R. (2012). The impact of macroeconomic indicators upon SME’s profitability. Ekonomika, 91(3), 117–128. DOI: 10.15388/Ekon.2012.0.883
- Božić L., Rajh E. (2016). The factors constraining innovation performance of SMEs in Croatia. Economic Research-Ekonomska Istraživanja, 29(1), 314–324. DOI: 10.1080/1331677X.2016.1168040
- Corak M., Heisz A. (1996). Alternative measures of the average duration of unemployment. Review of Income and Wealth, 42, 63–74. DOI: 10.1111/j.1475-4991.1996.tb00146.x
- Cui M. (2020). Introduction to the k-means clustering algorithm based on the elbow method. Geoscience and Remote Sensing, 3, 9–16. DOI: 10.23977/geors.2020.030102
- Filonova E.S., Bukreeva Yu.V. (2013). Analysis of the situation in central federal district regions based on small- and medium-business companies’ performance. Vestnik Finansovogo universiteta=Bulletin of the Financial University, 6(78), 35–47 (in Russian).
- Genc E., Dayan M., Genc O.F. (2019). The impact of SME internationalization on innovation: The mediating role of market and entrepreneurial orientation. Industrial Marketing Management, 82, 253–264. DOI: 10.1016/j.indmarman.2019.01.008
- Gherghina Ș.C., Botezatu M.A., Hosszu A., Simionescu L.N. (2020). Small and medium-sized enterprises (SMEs): The engine of economic growth through investments and innovation. Sustainability, 12, 347. DOI: 10.3390/su12010347
- Golikova V., Kuznetsov B. (2017). Suboptimal size: Factors preventing the growth of Russian small and medium-sized enterprises. Foresight and STI Governance, 11(3), 83–93. DOI: 10.17323/2500-2597.2017.3.83.93
- Haddoud M.Y., Beynon M.J., Jones P., Newbery R. (2018). SMEs’ export propensity in North Africa: A fuzzy c-means cluster analysis. Journal of Small Business and Enterprise Development, 25(5), 769–790. DOI: 10.1108/JSBED-02-2017-0077
- Hagen B., Zucchella A., Cerchiello P., De Giovanni N. (2012). International strategy and performance – clustering strategic types of SMEs. International Business Review, 21(3), 369–382. DOI: 10.1016/j.ibusrev.2011.04.002
- Ipinnaiye O., Dineen D., Lenihan H. (2017). Drivers of SME performance: A holistic and multivariate approach. Small Business Economics 48, 883–911. DOI: 10.1007/s11187-016-9819-5
- Jami Pour M., Asarian M. (2019). Strategic orientations, knowledge management (KM) and business performance: An exploratory study in SMEs using clustering analysis. Kybernetes, 48(9), 1942–1964. DOI: 10.1108/K-05-2018-0277
- Kelarev V.V. (2021). Poverty as a phenomenon of the Russian economy and its negative impact on the practical development of small business in the country. Gosudarstvennoe i munitsipal’noe upravlenie. Uchenye zapiski=State and Municipal Management. Scientific Notes, 4, 86–92. DOI: 10.22394/2079-1690-2021-1-4-86-92 (in Russian).
- Kremin A.E., Rossoshanskii A.I. (2020). Small business and living standards of the population: Mutual influence and management issues. Ekonomicheskie i sotsial’nye peremeny: fakty, tendentsii, prognoz=Economic and Social Changes: Facts, Trends, Forecast, 13(2), 214–229. DOI: 10.15838/esc.2020.2.68.14 (in Russian).
- Kuznetsov Yu.A., Perova V.I. (2020). Dynamics of small business development in Russia in the context of harmonization of state and business strategies. Vestnik Nizhegorodskogo universiteta im. N.I. Lobachevskogo. Seriya: Sotsial’nye nauki=Vestnik of Lobachevsky State University of Nizhni Novgorod, 1(57), 28–36 (in Russian).
- Kuznetsova O.V. (2021) The economy of Russian regions in a pandemic: Do resilience factors work? Regional’nye issledovaniya, 3(73), 76–87. DOI: 10.5922/1994-5280-2021-3-7 (in Russian).
- Leitne K., Guldenberg S. (2010). Generic strategies and firm performance in SMEs: A longitudinal study of Austrian SMEs. Small Business Economy, 35, 169–189. DOI: 10.1007/s11187-009-9239-x
- Levushkina S.V. (2015). Systematic approach to the implementation chronotopic cluster analysis of development of small and medium business. Fundamental’nye issledovaniya=Fundamental Research, 5–4, 753–757 (in Russian).
- Li Y., Huang J., Tsai M. (2009). Entrepreneurial orientation and firm performance: The role of knowledge creation process. Industrial Marketing Management, 38, 440–449. DOI: 10.1016/j.indmarman.2008.02.004
- Lorentz H., Hilmola O.-P., Malmsten J., Srai J.S. (2016). Cluster analysis application for understanding SME manufacturing strategies. Expert Systems with Applications, 66, 176–188. DOI: 10.1016/j.eswa.2016.09.016
- Luk’yanova A.L., Oshchepkov A.Yu. (2007). Functioning of regional labor markets: wages and unemployment. In: Sotsial’naya politika: realii XXI veka. Vyp. 3 [Social Policy: Realities of the 21st century. Volume 3.]. Moscow: Nezavisimyi institut sotsial’noi politiki (in Russian).
- MacQueen J.B. (1967). Some methods for classification and analysis of multivariate observations. In: Proceedings of 5-th Berkeley Symposium on Mathematical Statistics and Probability. Berkeley: University of California Press.
- Mazzarol T., Volery T., Doss N., Thein V. (1999). Factors influencing small business start‐ups: A comparison with previous research. International Journal of Entrepreneurial Behavior & Research, 5(2), 48–63. DOI: 10.1108/13552559910274499
- Nanavyan A.M. (2012). Estimation of unemployment flows and long-term unemployment on the Russian labor market. Natsional’nye interesy: prioritety i bezopasnost’=National Interests: Priority and Security, 42, 44–50 (in Russian).
- Obraztsova O.I., Chepurenko A.Yu. (2020). Entrepreneurial activity in Russia and its cross-regional differences. Zhurnal Novoi ekonomicheskoi assotsiatsii=Journal of the New Economic Association, 2(46), 198–210. DOI: 10.31737/2221-2264-2020-46-2-12 (in Russian).
- Obraztsova O.I., Popovskaya E.V. (2017). An essay of the multidimensional statistical methods to characterize the entrepreneurial context in Russian regions. Sotsiologicheskie issledovaniya=Sociological Studies, 4(396), 93–106 (in Russian).
- Pinkovetskaya Yu.S. (2014). Small and medium entrepreneurship in the Russian Federation: Regularities of spatial distribution. Vestnik UrFU. Seriya: Ekonomika i upravlenie, 1, 27–36 (in Russian).
- Pinkovetskaya Yu.S. (2018). Factors influencing small and medium enterprises turnover: Evaluation of Russian regions data. Ars Administrandi. Iskusstvo upravleniya=Ars Administrandi. The Art of Governance, 10(2), 199–216. DOI: 10.17072/2218-9173-2018-2-199-216 (in Russian).
- Punj G., Stewart D.W. (1983). Cluster analysis in marketing research: Review and suggestions for application. Journal of Marketing Research, 20(2), 134–148. DOI: 10.1177/002224378302000204
- Shpak A.S., Shatalova A.S., Sal’nikov K.N. (2019) Evaluation of small business development in the Far Eastern federal district. Fundamental’nye issledovaniya=Fundamental Research, 12-1, 211–217. DOI: 10.17513/fr.42650 (in Russian).
- Sibirskaya E.V., Ivanov H., Sheremet N.G. (2016). Cluster analysis of small and middle business in the regions of Russia. Srednerusskii vestnik obshchestvennykh nauk=Central Russian Journal of Social Sciences, 4, 127–135. DOI: 10.12737/21327 (in Russian).
- Smirnov V.V. (2021). The content analysis of regional entrepreneurship. Natsional’nye interesy: prioritety i bezopasnost’=National Interests: Priorities and Security, 17, 3(396), 556–584. DOI: 10.24891/ni.17.3.556 (in Russian).
- Storey D.J. (1991). The birth of new firms? Does unemployment matter? A review of the evidence. Small Business Economics, 3(3), 167–178. DOI: 10.1007/bf00400022
- Sukhanova E.I., Shirnaeva S.Yu., Konstantinova E.O. (2019). Statistical analysis and modeling of the influence of socio-economic factors on the level of small business development in the regions of the Russian Federation. Fundamental’nye issledovaniya=Fundamental Research, 5, 126–132 (in Russian).
- Sun L., Chen G., Xiong H., Guo С. (2017) Cluster analysis in data‐driven management and decisions. Journal of Management Science and Engineering, 2(4), 227–251. DOI: 10.3724/SP.J.1383.204011
- Surya B., Menne F., Sabhan H. et al. (2021). Economic growth, increasing productivity of SMEs, and open innovation. Journal of Open Innovation: Technology, Market, and Complexity, 7(1), 20. DOI: 10.3390/joitmc7010020
- Tambunan T. (2008). SME development, economic growth, and government intervention in a developing country: The Indonesian story. Journal of International Entrepreneurship, 6, 147–167. DOI: 10.1007/s10843-008-0025-7
- Tambunan T.T.H. (2009). SME development pattern: A theoretical consideration. In: SMEs in Asian Developing Countries. London: Palgrave Macmillan. DOI: 10.1057/9780230250949_2
- Tarunina E.N., Mavrina E.O. (2015). Level of economic development as a factor of early entrepreneurial activity. Vestnik Nizhegorodskogo universiteta im. N.I. Lobachevskogo. Seriya: Sotsial’nye nauki=Vestnik of Lobachevsky State University of Nizhni Novgorod. Series: Social Sciences, 2(38), 9–17 (in Russian).
- Toomsalu L., Tolmacheva S., Vlasov A., Chernova V. (2019). Determinants of innovations in small and medium enterprises: A European and international experience. Terra Economicus, 17(2), 112–123. DOI: 10.23683/2073-6606-2019-17-2-112-123
- Ward J.H. (1963). Hierarchical grouping to optimize an objective function. Journal of the American Statistical Association, 58(301), 236¬–244. DOI: 10.1080/01621459.1963.10500845
- Yuan C., Yang H. (2019). Research on k-value selection method of k-means clustering algorithm. J – Multidisciplinary Scientific Journal, 2(2), 226–235. DOI: 10.3390/j2020016
- Zemtsov S.P. (2016). Typology of Russian regions for development purposes of small and medium-size business. Gosudarstvennoe i munitsipal’noe upravlenie. Uchenye zapiski=State and Municipal Management. Scientific Notes, 4, 99–102 (in Russian).
- Zemtsov S.P. (2020). Institutes, entrepreneurship, and regional development in Russia. Zhurnal Novoi ekonomicheskoi assotsiatsii=Journal of the New Economic Association, 46(2), 168–180. DOI: 10.31737/2221-2264-2020-46-2-9 (in Russian).
- Zemtsov S.P., Mikhailov A.A. (2021). Trends and factors of development of small and medium-sized businesses in Russian regions during corona crisis. Ekonomicheskoe razvitie Rossii=Russian Economic Development, 28(4), 34–45 (in Russian).
- Zhou B. (2016). Lean principles, practices, and impacts: A study on small and medium-sized enterprises (SMEs). Annals of Operations Research, 241, 457–474. DOI: 10.1007/s10479-012-1177-3
