Diabetes mellitus data classification by cascading of feature selection methods and ensemble learning algorithms

Author: Kemal Akyol, Baha Şen
Journal: International Journal of Modern Education and Computer Science @ijmecs
Article in issue: 6 vol.10, 2018.
Free access
Diabetes is a chronic disease related to the rise of levels of blood glucose. The disease that leads to serious damage to the heart, blood vessels, eyes, kidneys, and nerves is one of the reasons of death among the people in the world. There are two main types of diabetes: Type 1 and Type 2. The former is a chronic condition in which the pancreas produces little or no insulin by itself. The latter usually in adults, occurs when insulin level is insufficient. Classification of diabetes mellitus data which is one of the reasons of death among the people in the world is important. This study which successfully distinguishes diabetes or normal persons contains two major steps. In the first step, the feature selection or weighting methods are analyzed to find the most effective attributes for this disease. In the further step, the performances of AdaBoost, Gradient Boosted Trees and Random Forest ensemble learning algorithms are evaluated. According to experimental results, the prediction accuracy of the combination of Stability Selection method and AdaBoost learning algorithm is a little better than other algorithms with the classification accuracy by 73.88%.
Diabetes mellitus, feature selection, ensemble learning, AdaBoost, Gradient Boosted Trees, Random Forest
Short address: https://sciup.org/15016768
IDR: 15016768 | DOI: 10.5815/ijmecs.2018.06.02
Text of the scientific article Diabetes mellitus data classification by cascading of feature selection methods and ensemble learning algorithms
Published Online June 2018 in MECS DOI: 10.5815/ijmecs.2018.06.02
Diabetes is a chronic disease related to the rise of levels of blood glucose [1]. The disease that leads to serious damage to the heart, blood vessels, eyes, kidneys, and nerves is one of the reasons of death among the people in the world [2]. According to the World Health Organization (WHO)1 some of key facts are as follows:
-
a) 1 in 3 adults aged over 18 years is overweight and
-
1 in 10 is obese. 1.6 million deaths are related to diabetes each year directly.
-
b) 422 million adults have diabetes. Also, it is extrapolated that directly 1.6 million deaths were caused by diabetes in 2015.
-
c) There are two main types of diabetes: Type 1 and Type 2. The former is a chronic condition in which the pancreas produces little or no insulin by itself. The latter usually in adults, occurs when insulin level is insufficient.
The idea that the identification of best feature sets will lead manifold contributions to the classification of this disease. Furthermore, these features set may help field specialist. In this context, the main aim of this study is to investigate the importance of attributes. The performance comparison of well-known feature selection methods are discussed in order to determine the best feature sets. This study contains two major steps. The first one is to demonstrate the important attributes for the disease. The second one is to present the experimental results based on Gradient Boosted Trees (GBT), AdaBoost (AB) and Random Forest (RF) ensemble learning methods.
The rest of this paper is organized as follows. Section 2 examines related studies. Section 3 states the dataset. Section 4 explains the design process and the methods utilized. Section 5 presents experimental results. Finally, Section 6 contains the conclusion.
-
II. Related Works
There are already many approaches in bordered of classifier algorithms and data mining techniques which were presented in literature for this subject. Dewangan and Agrawal designed an ensemble model by combining Bayesian classification and Multilayer Perceptron [2]. Shetty and Joshi designed and implemented a diabetes prediction and monitoring system. The symptoms rising diabetes are defined and applied to the prediction model in this system. This system uses Iterative Dichotomiser 3 algorithm in order to help the user to know whether they are diabetic or non-diabetic [3]. Jain and Raheja presented promising approach in order to correct prediction the diabetes by deal with the different parameters. Their approaches, fuzzy verdict technique, handled out the information gathered from the patients. This technique, which takes into account both rules and physicians’ knowledge, has better accuracy as compared to other prediction approaches [4]. Choubey and Paul proposed a methodology which is the combination of Genetic Algorithm and Multilayer Perceptron Neural Network classifier algorithm for Pima Indian Diabetes prediction. Genetic Algorithm is used for feature selection [5]. Bozkurt et al. classified the Pima Indian Diabetes data by using eight classifiers such as neural networks and its derivatives, the artificial immune system, and the Gini algorithm [6]. Osman and Aljahdali pointed out a method improving the accuracy based on the extracted significant diabetes attributes. In this context, they proposed an approach which integrated the Support Vector Machine algorithm with K-means clustering algorithm [7]. Kou et al. sought the ethnicity influences cardiovascular outcomes and complications in patients with type 2 diabetes. For the purpose of this, they determined whether cardiovascular outcomes in type 2 diabetes differ according to ethnicity, and whether ethnicity influences the effect of gender on these outcomes in Caucasians, East-Southeast-Asians, MiddleEasterners, South-Asians and Pacific-Islanders in [8]. Campbell et al. investigated the relationship between individual categories of adverse childhood experience and diabetes in adulthood in a sample of United States adults [9]. Karegowda et al. exemplified the applications of various ensemble methods for enhanced classification accuracy. Their model comprises of two stages. In the first stage, k-means clustering is employed to identify and eliminate wrongly classified instances. In the second stage, ensemble learning methods were performed [10]. In [11], the authors compared the performances of Linear Discriminant Analysis, Quadratic Discriminant Analysis, Naive Bayes and Gaussian process based classifiers in order to classify diabetes data. Gaussian process-based algorithm includes three kernels; linear, polynomial and radial and it is better than others. Moreover, the studies that demonstrate the relationship of this disease which has an important place in human health and other diseases are present too. For example, in [12], the authors focused on whether diabetes is associated with Alzheimer's disease and neurodegeneration in frame of clinical studies. In [13], the authors investigated the relationship between changes in glucose metabolism and various liver diseases as well as the particularities related with the diagnosis and monitoring of diabetes in liver disease patients. In [14], the authors asserted that Alzheimer's disease is a risk factor for type 2 diabetes and vice versa, and a growing body of evidence indicates that these diseases are connected both at epidemiological, clinical and molecular levels. In [15], the authors explored the novel findings in animal model and clinical studies involving the use of anti-diabetic compounds as promising therapeutics for Alzheimer's disease.
-
III. Dataset
The publicly available Pima Indian diabetes dataset2 is discussed in this study. All patients female at least 21 years old, have the highest prevalence of diabetes [16-17] and incidence of non-insulin-dependent diabetes mellitus also referred to Type II Diabetes in the world [16, 18]. Table 1 shows the structure of the dataset, which have 9 attributes as 8 input and 1 output.
Table 1. Pima Indian Diabetes dataset attributes.
|
Attribute no. |
Attribute |
|
1 |
Number or times pregnant (NTP) |
|
2 |
Plasma glucose concentration (PGC) |
|
3 |
Diastolic blood pressure (mmHg) (DBP) |
|
4 |
Triceps skin-fold thickness (mm) (TSFT) |
|
5 |
2-h serum insulin (mu U/mL) (H2SI) |
|
6 |
Body mass index (kg/m2) (BMI) |
|
7 |
Diabetes pedigree function (DPF) |
|
8 |
Age |
|
9 |
Class 0 and 1 (Diagnosis of type 2 diabetes disease) |
The dataset consists of 768 patients; 268 patients are diabetic and the rest of them are non-diabetic. The output variable takes ‘0 or ‘1’ values, where ‘0’ and ‘1’ are depict the non- diabetic instance and diabetic instance respectively. The chart which reflects data distribution is presented in Figure 3. As can be seen in this figure, the prediction of disease based on knowledge of these attributes which have mixed structure is very difficult.
Г I Pozitive
EZZ1 Negative
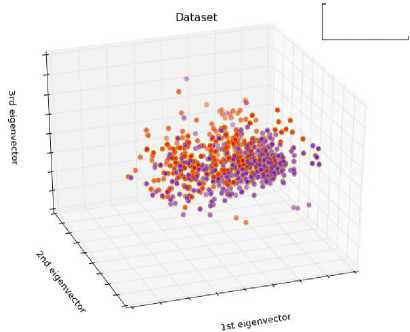
Fig.1. Data distribution.
-
IV. Design Process
-
A. Data Normalization
The min-max normalization which protects the relationships among the original values [19] is a preprocess applied in order to perform the machine learning more efficiently. Original datum is converted into a value between the minimum and maximum, i.e. zero and one as given in (1) [20].
х' =
• t • mtn
•max-^mtn
where X’ is the normalized value, Xi is the processed value, Xmin is the minimum value and Xmax is the maximum value in all X values.
-
B. Feature Selection
Irrelevant features in dataset may confuse learning algorithms leading to false results and also consume memory and time [21]. By reducing the entire feature space to the best features set, over-fitting of the classifier can be block [22]. So, the classification performance is better. There are many studies on this subject in the literature. Alia and Taweel developed a new Feature Selection algorithm based on hybrid Binary Cuckoo Search and rough set theory in order to classify the nominal datasets. Their proposed algorithm achieves quite successful [23]. Enshaei and Faith applied the ‘Targeted Projection Pursuit (TPP)’ dimension reduction technique for feature selection on a range of gene expression datasets. They compared the performance of TPP with other feature selection techniques [24]. Liu and Aickelin proposed a novel concept of feature matrix, which constitutes the foundation for the irregular and big medical data, in order to detect the adverse drug reaction. They performed feature selection methods based on Student’s t-test and Wilcoxon rank-sum test on the feature matrix so as to detect the significant features for adverse drug reaction [25]. In this study, the Recursive Feature Elimination (RFE), Stability Selection (SS) and Iterative Relief (IR) methods which were introduced in [26-28] respectively are employed in order to detect the important attributes for the disease.
-
C. Performance Evaluation
The experimental and the actual results are evaluated by calculating the sensitivity (Sen), the specificity (Spe) and the Accuracy (Acc) metrics which are as follows:
Acc = (TP + TN)/(TP + FP + TN + FN)
Sen= TP/(TP+FN)
Spe = TN/(TN + FP)
where TP, TN, FP and FN are the numbers of true positive, true negative, false positive and false negative instances respectively. The Sen metric is the ratio of the number of actual positives found as disease to the number of total positives. The Spe metric is the ratio of the number of actual negatives found as non-disease to the number of total negatives. The Acc value is the ratio of the number of correctly diagnosed positive and negative instances to the total number of instances [29].
-
V. Experimental Results and Discussion
Figure 2 describes the block diagram of the proposed study. As shown in the flowchart, firstly, the dataset is normalized into range from 0 to 1 values by using the min-max normalization. After this step, this dataset is shuffled. And then, the dataset is divided into 60-40% 70-30% and 80-20% split of training and test sets respectively. That is, the dataset is separated randomly 3 times, part of 80,70 and 60% of dataset are used for learning step and part of 20-30 and 40% of dataset which are remaining parts are used for the testing step. Thus, three different train and test sets are obtained. In other words, 460 training and 308 test instances, 537 training and 231 test instances, 614 training and 154 test instances are obtained respectively. The information about obtained datasets is presented in Table 2.
Table 2. Train and test data.
|
Dataset 1 60 % Train and 40% Test |
Dataset 2 70 % Train and 30% Test |
Dataset 3 80 % Train and 20% Test |
||||
|
Train |
Test |
Train |
Test |
Train |
Test |
|
|
No |
308 |
192 |
358 |
142 |
408 |
92 |
|
Yes |
152 |
116 |
179 |
89 |
206 |
62 |
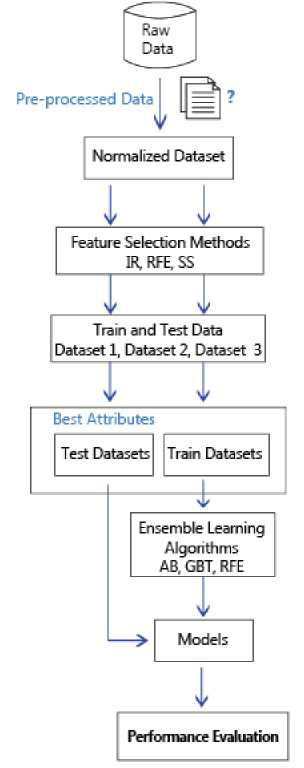
Fig.2. The block diagram of the proposed study.
Next, the RFE, SS and IR feature selection methods are applied to these datasets in order to find the best attributes set for outcome variable. The information of importance of attributes which are obtained by each algorithm is presented in Figure 3. Later, these datasets which include best attributes as input data are sent to the learning algorithms, and machine learning is performed for each one. So, the performances of the combination of feature selection and machine learning algorithms are handled.
Table 3. Experimental results for all training and test datasets.
|
IR-based models |
||||||||||||
|
Learning Algorithms |
||||||||||||
|
Datasets AB GBT RF |
||||||||||||
|
No |
Yes |
No |
Yes |
No |
Yes |
|||||||
|
Dataset 1 |
No Yes |
157 52 |
35 64 |
No Yes |
158 54 |
34 62 |
No Yes |
167 58 |
25 58 |
|||
|
Acc:71.75 Sen:55.17 Spe:81.77 |
Acc:71.43 Sen:53.45 Spe:82.29 |
Acc:73.05 Sen:50.0 Spe:86.98 |
||||||||||
|
No |
Yes |
No |
Yes |
No |
Yes |
|||||||
|
Dataset 2 |
No Yes |
123 38 |
19 51 |
No Yes |
118 41 |
24 48 |
No Yes |
125 46 |
17 43 |
|||
|
Acc:75.32 Sen:57.3 Spe:86.62 |
Acc:71.86 Sen:53.93 Spe:83.1 |
Acc:72.73 Sen:48.31 Spe:88.03 |
||||||||||
|
No |
Yes |
No |
Yes |
No |
Yes |
|||||||
|
Dataset 3 |
No Yes |
81 31 |
11 31 |
No Yes |
78 33 |
14 29 |
No Yes |
81 31 |
11 31 |
|||
|
Acc:72.73 Sen:50.0 Spe:88.04 |
Acc:69.48 Sen:46.77 Spe:84.78 |
Acc:72.73 Sen:50.0 Spe:88.04 |
||||||||||
|
— |
||||||||||||
|
Average Acc: 73.60 Acc: 70.92 Acc: 72.84 |
||||||||||||
|
RFE-based models |
||||||||||||
|
Datasets AB GBT RF |
||||||||||||
|
No |
Yes |
No |
Yes |
No |
Yes |
|||||||
|
Dataset 1 |
No Yes |
166 55 |
26 61 |
No Yes |
158 54 |
34 62 |
No Yes |
167 58 |
25 58 |
|||
|
Acc:73.70 Sen:52.59 Spe:86.46 |
Acc:71.43 Sen:53.45 Spe:82.29 |
Acc:73.05 Sen:50.0 Spe:86.98 |
||||||||||
|
No |
Yes |
No |
Yes |
No |
Yes |
|||||||
|
Dataset 2 |
No Yes |
123 47 |
19 42 |
No Yes |
122 46 |
20 43 |
No Yes |
125 47 |
17 42 |
|||
|
Acc:71.43 Sen:47.19 Spe:86.62 |
Acc:71.43 Sen:48.31 Spe:85.92 |
Acc:72.29 Sen:47.19 Spe:88.03 |
||||||||||
|
No |
Yes |
No |
Yes |
No |
Yes |
|||||||
|
Dataset 3 |
No Yes |
80 33 |
12 29 |
No Yes |
82 33 |
10 29 |
No Yes |
79 34 |
13 28 |
|||
|
Acc:70.78 Sen:46.77 Spe:86.96 |
Acc:72.08 Sen:46.77 Spe:89.13 |
Acc:69.48 Sen:45.16 Spe:85.87 |
||||||||||
|
Average Acc: 71.97 Acc: 71.65 Acc: 71.61 |
||||||||||||
|
SS-based models |
|||
|
Datasets |
AB |
GBT |
RF |
|
No |
Yes |
No |
Yes |
No |
Yes |
||||||||
|
Dataset 1 |
No Yes |
165 47 |
27 69 |
No Yes |
158 46 |
34 70 |
No Yes |
166 56 |
26 60 |
||||
|
Acc:75.97 Sen:59.48 Spe:85.94 |
Acc:74.03 Sen:60.34 Spe:82.29 |
Acc:73.38 Sen:51.72 Spe:86.46 |
|||||||||||
|
No |
Yes |
No |
Yes |
No |
Yes |
||||||||
|
Dataset 2 |
No Yes |
124 46 |
18 43 |
No Yes |
123 41 |
19 48 |
No Yes |
124 46 |
18 43 |
||||
|
Acc:72.29 Sen:48.31 Spe:87.32 |
Acc:74.03 Sen:53.93 Spe:86.62 |
Acc:72.29 Sen:48.31 Spe:87.32 |
|||||||||||
|
No |
Yes |
No |
Yes |
No |
Yes |
||||||||
|
Dataset 3 |
No Yes |
81 30 |
11 32 |
No Yes |
80 32 |
12 30 |
No Yes |
82 29 |
10 33 |
||||
|
Acc:73.38 Sen:51.61 Spe:88.04 |
Acc:71.43 Sen:48.39 Spe:86.96 |
Acc:74.68 Sen:53.23 Spe:89.13 |
|||||||||||
|
— |
|||||||||||||
|
Average |
Acc: 73.88 |
Acc: 73.16 |
Acc: 73.45 |
||||||||||
The experimental results are presented in confusion matrix structure and the performance metrics of algorithms are given related in parts in Table 4. The best results are bolded. According to the results for example, out of 116 data which is considered as positive, the SS-AB model found that 69 of them are positive. Also, out of 192 data which is considered as negative, it found that 165 of them is negative. Therefore, the SS-based AB model gives the values of 73.38% Acc on the Dataset 1 . Out of 89 data which is considered as positive, the same model found that 43 of them are positive. Also, out of 142 data which is considered as negative, it found that 124 of them is negative. Therefore, the SS-based AB model gives the values of 72.29% Acc on the Dataset 2. Out of 62 data which is considered as positive, the same model found that 32 of them are positive. Also, out of 92 data which is considered as negative, it found that 81 of them is negative. Therefore, the SS-based AB model gives the values of 73.38% Acc on the Dataset 3. The overall averages of the experimental results, which are obtained from each model, are given in Table 4. In this direction, this table presents the performance comparison of these learning algorithms.
Table 4. Overall accuracy results
|
Learning Algorithms |
|||
|
Feature Selection Algorithms |
AB |
GBT |
RF |
|
IR |
73.60 |
70.92 |
72.84 |
|
RFE |
71.97 |
71.65 |
71.61 |
|
SS |
73.88 |
73.16 |
73.45 |
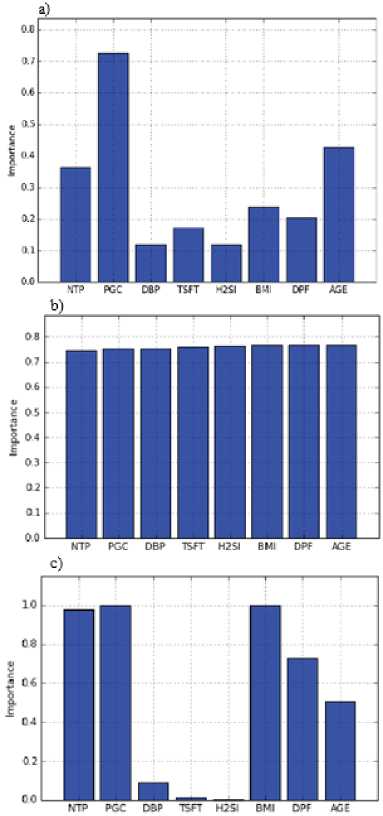
Fig.3. The importance of attributes; a) The results obtained with IR Method, b) The results obtained with RFE Method, c) The results obtained with SS Method.
-
VI. Conclusion
Diabetes which is a common cause of death is a chronic, metabolic disease related to the rise of levels of blood glucose. Besides many studies carried out, in this study the authors investigated the performances of the three ensemble learning methods. This study includes two phrases. In the first phrase, the dataset is divided 3 times randomly, parts of 60%, %70 and 80% of dataset for learning step and parts of 40%, 30% and 20% of dataset which are remaining parts for the testing step. Afterwards, feature selection algorithms are employed on these datasets in order to identify important attributes. In the second stage, the performances of the ensemble learning methods are evaluated. These datasets including important attributes as the input data sent to these learning algorithms. And so the best model is investigated. The proposed method is tested on public Pima Indian Diabetes dataset which has been well-placed in the literature. For this purpose, the performances of the cascade models which include well-known feature selection algorithms and the ensemble learning algorithms are evaluated on pre-processed dataset. The experimental results show that SS feature selection method more successful than other methods and SS-AB cascade model is more successful than other learning algorithms for all three datasets. Based on the experimental results, it may be stated that feature selection improves the performance of diabetes mellitus prediction. However, the fact that the performances of these studies are between 70% and 80%. The successes of the models are not very well even if machine learning is performed using important variables for outcome variable. Consequently, there is no strong discrimination of sample data space used for this disease. In other words, it can be interpreted that there are many other unknown factors for the disease.
Acknowledgements
The authors would like to thank the UCI Machine Learning Repository for providing the Pima Indian diabetes dataset.
References Diabetes mellitus data classification by cascading of feature selection methods and ensemble learning algorithms
- H. Wu, S. Yang, Z. Huang, J. He, X. Wang, “Type 2 diabetes mellitus prediction model based on data mining,” Informatics in Medicine Unlocked, vol. 10, pp. 100-107, 2018. DOI: 10.1016/j.imu.2017.12.006.
- A. K. Dewangan and P. Agrawal, “Classification of Diabetes Mellitus Using Machine Learning Techniques,” International Journal of Engineering and Applied Sciences (IJEAS), vol. 2, no. 5, pp. 145-148, May 2015.
- S. R. Priyanka Shetty and S. Joshi, “A Tool for Diabetes Prediction and Monitoring Using Data Mining Technique,” I.J. Information Technology and Computer Science, vol. 8, no. 11, pp. 26-32, 2016. DOI: 10.5815/ijitcs.2016.11.04.
- V. Jain and S. Raheja, “Improving the Prediction Rate of Diabetes using Fuzzy Expert System,” I.J. Information Technology and Computer Science, vol. 7, no. 10, pp. 84-91, 2015. DOI: 10.5815/ijitcs.2015.10.10.
- D. K. Choubey and S. Paul, “GA_MLP NN: A Hybrid Intelligent System for Diabetes Disease Diagnosis,” I.J. Intelligent Systems and Applications, vol. 1, pp. 49-59, 2016. DOI: 10.5815/ijisa.2016.01.06.
- M. R. Bozkurt, N. Yurtay, Z. Yılmaz, “Comparison of different methods for determining diabetes,” Turk J Elec Eng & Comp Sci, vol. 22, pp. 1044-1055, 2014. DOI: 10.3906/elk-1209-82.
- A. H. Osman, H. M. Aljahdali, “Diabetes Disease Diagnosis Method based on Feature Extraction using K-SVM,” International Journal of Advanced Computer Science and Applications, vol. 8, no. 1, pp. 237-244, 2017.
- S. Kou, J.Y. Cao, S. Yeo, D.J. Holmes-Walker, S.L. Lau, J.E. Gunton, “Ethnicity influences cardiovascular outcomes and complications in patients with type 2 diabetes,” vol. 32, no. 2, pp. 144-149, Feb 2018. DOI: 10.1016/j.jdiacomp.2017.10.016.
- J. A. Campbell, G. C. Farmer, S. Nguyen-Rodriguez, R. Walker, L. Egede, “Relationship between individual categories of adverse childhood experience and diabetes in adulthood in a sample of US adults: Does it differ by gender?”, J Diabetes Complications, vol. 32, no. 2, pp. 139-143, Feb 2018. DOI: 10.1016/j.jdiacomp.2017.
- A. G. Karegowda, M. A. Jayaram, A. S. Manjunath, “Cascading k-means with Ensemble Learning: Enhanced Categorization of Diabetic Data,” Journal of Intelligent Systems, vol. 21, no.3, pp. 237-253, 2012. DOI: 10.1515/jisys-2012-0010.
- M. Maniruzzaman, N. Kumar, Md. M. Abedin, Shaykhul Islam, H. S. Suri, A. S. El-Baz, J.S. Suri, “Comparative approaches for classification of diabetes mellitus data: Machine learning paradigm,” Comput Methods Programs Biomed, vol. 152, pp. 23-34, Dec 2017. DOI: 10.1016/j.cmpb.2017.09.004.
- M. Shinohara, N. Sato, “Bidirectional interactions between diabetes and Alzheimer's disease,” Neurochemistry International, vol. 108, pp. 296-302, 2017. DOI: 10.1016/j.neuint.2017.04.020.
- T. E. Silva, M. F. Ronson, L.L.Schiavon, “Challenges in diagnosing and monitoring diabetes in patients with chronic liver diseases,” Diabetes & Metabolic Syndrome: Clinical Research & Reviews, In Press, Corrected Proof, 2017. DOI: 10.1016/j.dsx.2017.12.013.
- M.N.N. Vieira A.S. Ricardo, Lima-Filho, F.G.De Felice, “Connecting Alzheimer's disease to diabetes: Underlying mechanisms and potential therapeutic targets,” Neuropharmacology, In Press, 10 Nov. 2017. DOI: 10.1016/j.neuropharm.2017.11.014.
- D. Baglietto-Vargas, J. Shi, M.D. Yaeger, R. Ager, F. M. LaFerla, “Diabetes and Alzheimer’s disease crosstalk,” Neuroscience & Biobehavioral Reviews, vol. 64, pp. 272-287, May 2016. DOI: 10.1016/j.neubiorev.2016.03.005.
- W.C. Knowler, P.H. Bennett, R.F. Hammam and M. Miller, “Diabetes incidence and prevalence in Pima Indians: a 19-fold greater incidence than in Rochester, Minnesota,” Am J Epidemiol, vol. 108, no.6, pp. 497-504, 1978.
- A. Krosnick, “The diabetes and obesity epidemic among the Pima Indians,” N J Med, vol. 97, no. 8, pp. 31-37, 2000.
- L.J. Baier, R.L. Hanson, “Genetic studies of the etiology of type 2 diabetes in Pima Indians: hunting for pieces to a complicated puzzle,” Diabetes, vol. 53, no. 5, pp. 1181-1186, 2004. DOI: 10.2337/diabetes.53.5.1181.
- Han J., Kamber M. and Pei J., (2012) Data Mining: Concepts and Techniques, 3rd ed., Waltham, MA, USA.
- Y.K. Jain, S.K. Bhandare, “Min Max Normalization Based Data Perturbation Method for Privacy Protection,” International Journal of Computer & communication Technology, vol. 2, no.8, pp. 45-50.
- R.P.L. Durgabai, “Feature Selection using ReliefF Algorithm,” International Journal of Advanced Research in Computer and Communication Engineering, vol. 3, no 10, Oct pp. 8215-8288, 2014.
- H. Hijazi, C. Chan, “A classification framework applied to cancer gene expression profiles,” J. Healthc. Eng., vol. no. 4, 255-284, 2012. DOI: 10.1260/2040-2295.4.2.255.
- A. F. Alia and A. Taweel, “Feature Selection based on Hybrid Binary Cuckoo Search and Rough Set Theory in Classification for Nominal Datasets,” I.J. Information Technology and Computer Science, vol. 9, no. 4, pp. 63-72, 2017. DOI: 10.5815/ijitcs.2017.04.08.
- A. Enshaei and J. Faith, “Feature Selection with Targeted Projection Pursuit,” I.J. Information Technology and Computer Science, vol. 7, no. 5, pp. 34-39, 2015. DOI: 10.5815/ijitcs.2015.05.05.
- Y. Liu and U. Aickelin, “Feature Selection in Detection of Adverse Drug Reactions from the Health Improvement Network (THIN) Database,” I.J. Information Technology and Computer Science, vol. 7, no. 3, pp. 68-85, 2015. DOI: 10.5815/ijitcs.2015.03.10.
- L. Breiman, “Random forests,” Mach Learn, vol. 45, pp. 5-32, 2011.
- F. Mordelet, J. Horton, A.J. Hartemink, B.E. Engelhardt, R. Gordân, “Stability selection for regression-based models of transcription factor–DNA binding specificity,” Bioinformatics, vol. 29, pp. i117–i125, 2013. DOI: 10.1093/bioinformatics/btt221.
- Yijun Sun and Jian Li, “Iterative RELIEF for feature weighting,” ICML '06 Proceedings of the 23rd international conference on Machine learning, pp. 913-920, Pittsburgh, Pennsylvania, USA, June 25-29, 2006. DOI: 10.1109/TPAMI.2007.1093.
- A. Baratloo, M. Hosseini, A. Negida and G.E. Ashal, “Part 1: Simple definition and calculation of accuracy, sensitivity and specificity,” Emerg (Tehran), vol. 3, pp. 48-49, 2015.
