Diabetes prediction: a deep learning approach

Author: Safial Islam Ayon, Md. Milon Islam
Journal: International Journal of Information Engineering and Electronic Business @ijieeb
Article in issue: 2 vol.11, 2019.
Free access
Nowadays, Diabetes is one of the most common and severe diseases in Bangladesh as well as all over the world. It is not only harmful to the blood but also causes different kinds of diseases like blindness, renal disease, kidney problem, heart diseases etc. that causes a lot of death per year. So, it badly needs to develop a system that can effectively diagnose the diabetes patients using medical details. We propose a strategy for the diagnosis of diabetes using deep neural network by training its attributes in five and ten-fold cross-validation fashion. The Pima Indian Diabetes (PID) data set is retrieved from the UCI machine learning repository database. The results on PID dataset demonstrate that deep learning approach design an auspicious system for the prediction of diabetes with prediction accuracy of 98.35%, F1 score of 98, and MCC of 97 for five-fold cross-validation. Additionally, accuracy of 97.11%, sensitivity of 96.25%, and specificity of 98.80% are obtained for ten-fold cross-validation. The experimental results exhibit that the proposed system provides promising results in case of five-fold cross-validation.
Diabetes, Deep Neural Network (DNN), Prediction, Evaluation Metrics
Short address: https://sciup.org/15016167
IDR: 15016167 | DOI: 10.5815/ijieeb.2019.02.03
Text of the scientific article Diabetes prediction: a deep learning approach
Published Online March 2019 in MECS
-
I. Introduction
Diabetes is a metabolic ailment of several etiology characterized by chronic hyperglycemia with disorders of carbohydrate, fats and protein metabolism due to imperfections in insulin secretion, insulin action, or both [1]. Diabetes is a life-long disease because of the high stages of sugar within the blood [2]. About more than 9095% of people worldwide affected by the Type 2 diabetes [3]. Day by day the number of diabetes patients are increasing rapidly. Diabetes is one of the key reasons for death and it causes a lot of death per year silently. In 2035 the number of affected people with diabetes will be 592 million which is almost double comparing the value of affected people today [4]. Diabetes raises the glucose level in blood and high plasma glucose destroys the tiny vessels of blood in the eyes, heart, nervous system and kidneys [5].
Medical diagnosis is one of the challenging and crucial tasks in medical science. To predict the diabetes disease, data are taken from patients like plasma glucose concentration, diastolic blood stress, and triceps skinfold thickness, serum insulin, body mass, age etc. Then the patient consults to a specialist doctor. The physician takes the decision using his/her knowledge and experience based on these factors. The process of taking the decision is very lengthy and sometimes takes a few weeks or months that make the physician work’s very difficult [6]. Nowadays, a huge number of medical datasets are easily available that are useful for research in different sectors in medical science. So, it is hard or sometimes become impossible to handle the massive data by a human. Therefore, effective computer-based approaches are taken place over the traditional modalities. The computer-based systems increase the correctness and save time as well as money.
The idea of deep learning is a fast-growing and it works quite like a human mind. It represents the data in multiple levels and able to solve the selectivity-invariance dilemma efficiently [7]. Deep learning techniques are used in a variety of forms in the field of medical prognosis. Many research works prove that deep learning techniques provide a better outcome, decline the classification error rate and more robust to noise than other strategies [8]. It can handle the massive amount of data and have the capability to decode a complex problem in an easy way. Recently, various machine learning techniques [9, 10] and bio-inspired computing technique [11] as well as deep learning techniques [14, 18] are used in several medical prognoses. To predict diabetes mellitus, we have used deep neural network which is recently very popular method in machine learning. In addition, before predicting diabetes the dataset is trained well so test dataset provides an accurate result in almost all cases. The accuracy results of previous work to predict diabetes using machine learning techniques is not sufficient. But in our system, the accuracy rate is much better than the state of the art, which is discussed in the result section.
Though a number modality has been demonstrated, none of the modalities are able to provide a correct and consistent result. This paper presents an approach to predict diabetes from the input features. Deep Neural Network has been used to diagnose diabetes with the proper outcome.
The remaining part of the paper is planned as follows. Section II provides a short view of the researchers that have been done in this field. Section III describes the background study. Section IV describes the diabetes diagnosis methodology. The experimental outcomes analysis is investigated in Section V. Finally, Section VI concludes the paper.
-
II. Related Works
There are several recent techniques have been developed There are numerous modern-day techniques have been established with the evolution of contemporary technology for the diagnosis of diabetes mellitus. The work associated with this area is drawn briefly as follows.
The author in [12] evaluated the performance of the machine learning algorithms for the prediction of diabetes mellitus. The algorithms used by the systems are support vector machine, artificial neural network, logistic regression, classification tree, and K-nearest neighbor. The performance of the system is appraised in terms of accuracy, specificity, sensitivity, precision, negative predictive value, false positive rate, rate of misclassification, F1 measure and receiver operating characteristic (roc) curve. The highest accuracy of 78% and rate of misclassification 0.22 is obtained by the system using Logistic Regression. The better precision and negative predictive value are of 82% and 73% using Naïve Bayes and Logistic Regression respectively. The dataset is split into tenfold cross-validation manner. Heydari et al. [13] compared multiple classification algorithms for the classification of diabetes in Iran. The algorithms that have been used by the system are artificial neural network, Bayesian network, decision tree, support vector machine, and nearest neighbors. The accuracy of 97.44% is obtained by the system using artificial neural network that demonstrated the best performance. The accuracy of 81.19, 90.85, 95.03, and 91.60 % is obtained by support vector machine, 5- nearest neighbor, decision tree, and Bayesian network respectively. The dataset that has been used for the system is for 2536 cases screened for type 2 diabetes, within the metropolis of Tabriz, Iran that was gathered from the Tabriz University of Medical Sciences during a three-month program in spring 2010. The authors used WEKA as a simulation tool.
Ashiquzzaman et al. [14] proposed a prediction framework for the diabetes mellitus using deep learning approach where the overfitting is diminished by using the dropout method. There are two fully connected layers each trailed by a dropout layer. The decision is found from the output layer with a single node. The system is applied to the Pima Indian diabetes dataset and the highest accuracy obtained by the system is 88.41%. Zhu et al. [15] proposed a system using multiple classifiers and improved the accuracy of complex disease prediction like diabetes. They proposed a dynamic weighted voting scheme for that system. The system is tested on T2DM data sets and Pima Indian diabetes dataset. The highest accuracy obtained by the system is 93.45% using MFWC with k=10 on Pima Indian diabetes dataset.
Mukesh Kumari et al. [16] used data mining techniques to predict diabetes mellitus. They extract knowledge from the dataset and understandable description of patterns. The system obtained the highest accuracy 99.51% using Bayesian network. Santhanam et al. [17] proposed a system to predict the diabetes diagnosis using K-Means, Genetic algorithm, and SVM (Support Vector Machine). The system trailed the following steps. First step, update all the missing values with the mean. Second step, the cleaned dataset is clustered using K-Means to eliminate outliers and unnecessary data and select the optimal feature using genetic algorithm to reduce the features. The highest accuracy of the system is 98.82% using SVM.
Vijayashree et al. [18] proposed a system that uses recursive feature elimination and principal component analysis for prediction of diabetes. They classify diabetes using deep neural networks and artificial neural networks. Using deep neural network their accuracy was 82.67% and using artificial neural network their accuracy was 78.62%. Goncalves et al. [19] introduced a system to predict diabetes using hierarchical Neuro-Fuzzy BSP method. They propose a new hierarchical neuro-fuzzy binary space partitioning (BSP) model devoted to pattern classification and rule extraction. They found the accuracy of 80.08% in the training set and 78.26% in the testing set. Han et al. [20] introduced the pair-wise and size-constrained K-means method to screen the high-risk population of diabetes mellitus.
-
III. Background Study
A deep neural network [9] is a complex structure of a neural network where a neural network with multiple hidden layers between the input and output layers. Neural network is developed for predicting results and discovering the relation and pattern within the data set. Here, different types of learning algorithms are used to find the result. In neural network, the elements or nodes are interconnected just like the human neuron. The accuracy of the output depends on the inter-unit connected strength. In deep neural network, there are many hidden layers and in every hidden layer, there are several neurons. A simple deep neural network architecture is shown in Fig. 1. In each layer of nodes, output depends on the previous layer’s output. In neural network, the output layer neurons most commonly don’t have an activation function because the last output layer is usually taken to represent the class labels.
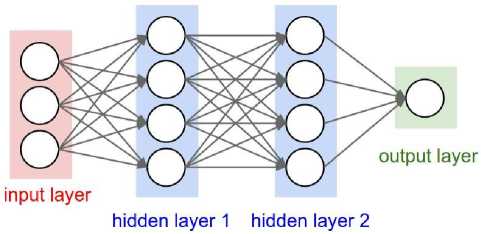
Fig.1. Deep Neural Network architecture.
In deep neural network, activation function performs a vital role. Activation functions are required to implement complicated mapping features that is non-linear in order to bring in the plenty-needed non-linearity property that permits them to approximate any function. Activation functions are also critical for squashing the limitless linearly weighted sum from neurons. It is also necessary to keep away from massive values gathering high up the processing hierarchy.
-
IV. Methods and Materials
To predict diabetes mellitus using deep learning, we follow the following steps. (i) Data collection, (ii) Data preparation, (iii) Implement deep neural network and (iv) Evaluation criteria.
-
A. Data Collection
The Pima Indian diabetes dataset is retrieved from the UCI machine learning repository database [21]. Within the dataset, all the patients are female and minimum of 21
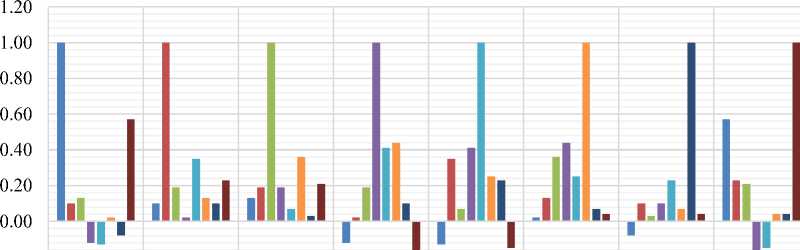
years old. There are 768 samples and also the sample is split into 8 attributes. Finally, the 9th attribute is the class distribution. Class 1 indicate that the diabetes test is positive and class 0 indicate the opposite. In the dataset, the number of instances of each class is (i) Class 0: Number of instances 500 (65.1%) (ii) Class 1: Number of instances 268 (34.9%). In Fig. 2 and Fig. 3 indicates the correlation between the eight parameters of “absence” and “present” samples where the high correlation between the parameters of these two classes of samples. We easily found out that in Fig. 2 that the “number of pregnant” parameter is negatively correlated with “triceps skin”, “serum insulin”, and “pedigree function”. All other parameters are positively correlated with the “number of pregnant”. Similarly, all the other parameters positively or negatively correlated which are shown in Fig. 2 when the class is “absence”.
-0.20
|
-0.40 |
pregnancis time |
plasma glucose |
blood pressure |
|
■ pregnancis time |
1.00 |
0.10 |
0.13 |
|
■ plasma glucose |
0.10 |
1.00 |
0.19 |
|
■ blood pressure |
0.13 |
0.19 |
1.00 |
|
■ triceps skin |
-0.12 |
0.02 |
0.19 |
|
■ serum insulin |
-0.13 |
0.35 |
0.07 |
|
■ body mass |
0.02 |
0.13 |
0.36 |
|
■ pedigree function |
-0.08 |
0.10 |
0.03 |
|
■ age |
0.57 |
0.23 |
0.21 |
|
triceps skin |
serum insulin |
body mass |
pedigree function |
age |
|
-0.12 |
-0.13 |
0.02 |
-0.08 |
0.57 |
|
0.02 |
0.35 |
0.13 |
0.10 |
0.23 |
|
0.19 |
0.07 |
0.36 |
0.03 |
0.21 |
|
1.00 |
0.41 |
0.44 |
0.10 |
-0.16 |
|
0.41 |
1.00 |
0.25 |
0.23 |
-0.15 |
|
0.44 |
0.25 |
1.00 |
0.07 |
0.04 |
|
0.10 |
0.23 |
0.07 |
1.00 |
0.04 |
|
-0.16 |
-0.15 |
0.04 |
0.04 |
1.00 |
Fig.2. Correlation for absence classes.
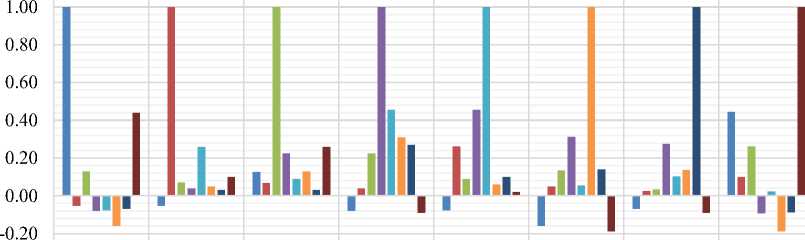
In the same way, Fig. 3 indicates the correlation between the two parameters when the class is “present”. As an example, “number of pregnant” is positively correlated with all the parameters except “plasma glucose”, triceps skin”, “serum insulin”, “body mass”, and “pedigree function” when the class is “present”.
-
B. Data Preparation
The performance of any system depends on the standard of the data. So, we check the dataset that there any missing value is present or not. We divided the data into 2 ways using k-fold cross-validation. i) Five-fold cross-validation and ii) Ten-fold cross-validation. We have used both validation techniques to compute the performance of the system.
-
C. Implement Deep Neural Network
For this system, we have chosen the hidden layer of the neural network is 4 and the number of neurons in those layers are 12,16,16,14 respectively. We try several hidden layer and different neurons in different layers for the diabetes prediction. We get the best outcome when the hidden layer is 4 and the number of neurons in every hidden layer is 12, 16, 16, and 14. The structure of the deep neural network that we have developed to predict diabetes is illustrated in Fig. 4. The input layer is 8 and the output layer is 1. In neural network, neurons are calculated the weighted sum according to (1) of its input, add bias and then decides whether it should be ‘fired’ or not. So, a specific neuron will be as follows.
Y = ^ ( input * weight ) + bias
The value of Y can be - ∞ to + ∞ . So, the neuron can’t decide whether it will fire or not. Here the activation function is used to decide the neuron will fire or not. We have used ReLU as an activation function.
1.20
|
-0.40 |
pregnancis time |
plasma glucose |
blood pressure |
triceps skin |
serum insulin |
body mass |
pedigree function |
age |
|
pregnancis time |
1.00 |
-0.05 |
0.13 |
-0.08 |
-0.08 |
-0.16 |
-0.07 |
0.44 |
|
plasma glucose |
-0.05 |
1.00 |
0.07 |
0.04 |
0.26 |
0.05 |
0.03 |
0.10 |
|
blood pressure |
0.13 |
0.07 |
1.00 |
0.23 |
0.09 |
0.13 |
0.03 |
0.26 |
|
triceps skin |
-0.08 |
0.04 |
0.23 |
1.00 |
0.46 |
0.31 |
0.27 |
-0.09 |
|
serum insulin |
-0.08 |
0.26 |
0.09 |
0.46 |
1.00 |
0.06 |
0.10 |
0.02 |
|
body mass |
-0.16 |
0.05 |
0.13 |
0.31 |
0.06 |
1.00 |
0.14 |
-0.19 |
|
pedigree function |
-0.07 |
0.03 |
0.03 |
0.27 |
0.10 |
0.14 |
1.00 |
-0.09 |
|
age |
0.44 |
0.10 |
0.26 |
-0.09 |
0.02 |
-0.19 |
-0.09 |
1.00 |
Fig.3. Correlation for present classes.
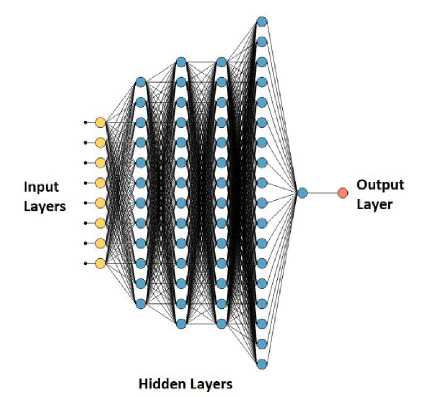
Fig.4. Structure of the deep neural network to predict diabetes.
TP = True Positive ( Correctly Identified )
TN = True Negative ( Incorrectly Identified )
FP = False Positive ( Correctly Rejected )
FN = False Negative ( Incorrectly Rejected )
Using the confusion matrix, the performance of the system can easily be calculated. The accuracy, sensitivity, specificity, F1 score and Matthews Correlation Coefficient are (MCC) are calculated as follows.
(TP + TN )
Accuracy (Acc ) = ------------------ (2)
(TP + TN + FP + FN )
Sensitivity ( Sen ) =----------- (3)
(TP + FN )
D. Evaluation Criteria
To visualize the performance of supervised learning algorithms, the confusion matrix is used. It is a summary of the prediction result in the classification problem. The definition of the terms that are related to the confusion matrix is given below:
Specificity ( Spec ) =---------- (4)
(TN + FPP)
F1 Score =
2 TP
(2 TP + FP + FN )
Matthews Correlation Coefficient (MCC )
_ ( TP X TN ) - ( FP X FN ) (6)
7( TP + FP )( TP + FN )(TN + FP )(TN + FN )
-
V. Results and Discussion
-
A. Experimental Setup
To predict diabetes mellitus, we have used deep neural network. In deep neural network, the input layer, hidden layer, and output layer are present. To predict diabetes, the data samples are partitioned into five-fold and tenfold cross-validation technique. Using five-fold and tenfold cross-validation, we check all the dataset into training set and testing set. It gives the accurate result for the whole dataset. We have used an Intel Core i5 powered computer with 8GB of RAM for processing purpose. We have used Scikit-learn which is open-source software for machine learning library in Python programming language. Spyder is an integrated development environment which is used to fulfill our goal.
-
B. Results Analysis
Confusion matrix of prediction result using DNN is tabulated in Table 1 for five-fold and Table 2 for ten-fold cross-validation. Fig. 5 represented the graphical view of the confusion matrix. Using the confusion matrix, the performance of the system both for five-fold and ten-fold is represented in Table 3. The graphical representation of the evaluation metrics is illustrated in Fig. 6 both for fivefold and ten-fold cross-validation. The result that is shown in Table 3 and Fig. 6 shows that deep neural network shows the best performance in the case of fivefold cross-validation. The accuracy, sensitivity, specificity obtained by the system are 98.35%, 97.39%, 99.80% for five-fold cross-validation. The F1 score and Matthews Correlation Coefficient are 0.98 and 0.97 for five-fold cross-validation whereas the F1 score and Matthews Correlation Coefficient are 0.97 and 0.95 for ten-fold cross-validation.
Table 1. Confusion matrix for five-fold cross-validation.
|
Predicted Class |
||||
|
Actual Class |
Absence |
Present |
Actual Total |
|
|
Absence |
494 (98.21%) |
6 (2.26%) |
500 |
|
|
Present |
9 (1.79%) |
259 (97.74%) |
268 |
|
|
Total Predicted |
503 |
265 |
768 |
|
Table 2. Confusion matrix for ten-fold cross-validation.
|
Predicted Class |
||||
|
Actual Class |
Absence |
Present |
Actual Total |
|
|
Absence |
489 (97.99%) |
11 (4.09%) |
500 |
|
|
Present |
10 (2.01%) |
258 (95.91%) |
268 |
|
|
Total Predicted |
499 |
269 |
768 |
|
Table 3. Evaluation Metrics of the diabetes prediction system.
|
Evaluation Metrics |
Five-fold |
Ten-fold |
|
Accuracy (%) |
98.04 |
97.27 |
|
Sensitivity (%) |
98.80 |
97.80 |
|
Specificity (%) |
96.64 |
96.27 |
|
F1 score |
0.99 |
0.98 |
|
MCC |
0.96 |
0.94 |
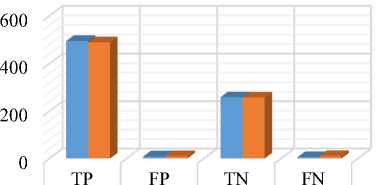
Five-Fold 494 9 259 6
Ten-Fold 489 10 258 11
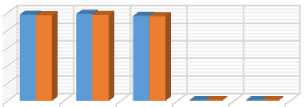
Fig.5. Classification result for five-fold and ten-fold cross-validation.
Acc Sen Spec F1 MCC score
98.04 98.8 96.64 0.99 0.96
97.27 97.8 96.27 0.98 0.94
Five-Fold
Ten-Fold
Fig.6. Evaluation metrics of the diabetes prediction system.
In the ROC (Receiver operating characteristic) curve, the X-axis contains the plots of false positive rate and the Y-axis contains the plots of true positive rate. The ROC for the diabetes prediction system is depicted in Fig. 7 where the AUC for five-fold and ten-fold cross-validation are 98% and 97% respectively.
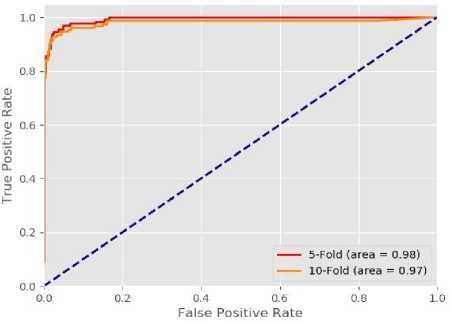
Fig.7. ROC curve of the diabetes prediction system.
-
C. Comparative Study
A comparative study of the state of the art and our proposed method is illustrated in Table 4. The author in [12] used several machine learning algorithms to predict diabetes and the highest accuracy 78% is obtained by using logistic regression. Ahmed et al. [22] used an improved genetic algorithm an obtained accuracy of 80.4%. Yilmaz et al. [23] obtained accuracy of 96.71% using Modified K-Means and SVM and Ribeiro et al. [24] measured the accuracy of 97.47% using SVM with efficient coding. The accuracy obtained by our system is of 98.35% using deep neural network for five-fold crossvalidation which is better than the state of the art.
Table 4. Comparison of the proposed work with state of the art in terms of accuracy.
|
Author(year) |
Method |
Accuracy (%) |
|
Dwivedi (2017) [12] |
Logistic Regression |
78 |
|
Ahmed F. et al. (2013) [22] |
Improved GA |
80.4 |
|
Yilmaz et al. (2014) [23] |
Modified K-Means + SVM |
96.71 |
|
Ribeiro et al. (2015) [24] |
SVM with efficient coding |
97.47 |
|
Our Study |
Deep Neural Network |
98.35 |
-
VI. Conclusion
Diabetes is a chronic ailment that has to be prevented before distresses people. Diabetes causes a lot of death per year throughout the world. So, the detection of diabetes in its initial stage is very important for the treatment. This study has implemented deep neural network to predict diabetes. This investigation has engaged deep neural network technique to identity of diabetes based on several medical factors. We found the accuracy is 98.35% for five-fold cross-validation which is comparatively high than other methods which are already used to predict diabetes mellitus. The proposed system will be supportive for the medical staffs and as well as general human beings.
References Diabetes prediction: a deep learning approach
- Diagnosis and Classification of Diabetes Mellitus, American Diabetes Association, Diabetes Care, vol. 33, Jan. 2010.
- R. Bellazzi, A. Abu-Hanna, “Data Mining Technologies for Blood Glucose and Diabetes Management,” Journal of Diabetes Science and Technology, vol. 3, pp. 603-612, May 2009.
- M. Panwar, A. Acharyya, R A. Shafik, D. Biswas, “K-Nearest Neighbor Based Methodology for Accurate Diagnosis of Diabetes Mellitus,” in Proc. Sixth International Symposium on Embedded Computing and System Design (ISED), pp. 132-136, 2016.
- Devi, M. Renuka, and J. Maria Shyla. "Analysis of Various Data Mining Techniques to Predict Diabetes Mellitus." International Journal of Applied Engineering Research 11.1, pp. 727-730, 2016.
- Goswami SK, Vishwanath M, Gangadarappa SK, Razdan R, Inamdar MN, “Efficacy of ellagic acid and sildenafil in diabetes-induced sexual dysfunction,” Pharmacogn Mag, vol. 10, 2014.
- Richard B. Balaban, “A Physician’s Guide to Talking About End-of-Life Care,” Journal of General Internal Medicine, vol. 15, pp. 195-200, Mar. 2017.
- Y. LeCun, Y. Bengio, G. E. Hinton, “Deep learning,” Nature, vol. 521, pp. 436–444, May 2015.
- A. Thammano, A. Meengen, “A New Evolutionary Neural Network Classifier,” Springer-Verlag Berlin, pp. 249-255, (9), 2005.
- M. M. Islam, H. Iqbal, M. R. Haque, and M. K. Hasan, “Prediction of Breast Cancer using Support Vector Machine and K-Nearest Neighbors,” in Proc. IEEE Region 10 Humanitarian Technology Conference (R10-HTC), pp 226-229, Dhaka, 2017.
- M. R. Haque, M. M. Islam, H. Iqbal, M. S. Reza, and M. K. Hasan, "Performance Evaluation of Random Forests and Artificial Neural Networks for the Classification of Liver Disorder," in Proc. International Conference on Computer, Communication, Chemical, Material and Electronic Engineering (IC4ME2), Rajshahi, pp. 1-5, 2018.
- M. K. Hasan, M. M. Islam, and M. M. Hashem, “Mathematical model development to detect breast cancer using multigene genetic programming,” in Proc. 5th International Conference on Informatics Electronics and Vision (ICIEV), pp. 574-579, Dhaka, 2016.
- A. Kumar Dwivedi, “Analysis of computational intelligence techniques for diabetes mellitus prediction,” Neural Comput. Appl., vol. 13, no. 3, pp. 1–9, 2017.
- M. Heydari, M. Teimouri, Z. Heshmati, and S. M. Alavinia, "Comparison of various classification algorithms in the diagnosis of type diabetes in Iran," International Journal of Diabetes in Developing Countries, pp. 1-7, 2015.
- A. Ashiquzzaman, A. K. Tushar, M. Islam, J.-M. Kim et al., ``Reduction of overfitting in diabetes prediction using deep learning neural network,'' arXiv preprint arXiv:1707.08386, 2017.
- J. Zhu, Q. Xie, K. Zheng. “An Improved Early Detection Method of Type-2 Diabetes Mellitus Using Multiple Classifier Systems”. Information Sciences, volume 292, pages 1-14, 2015.
- M. Kumari, Dr. R. Vohra, and A. Arora, “Prediction of Diabetes using Bayesian Network,” International Journal of Computer Science and Information Technologies, vol. 5, pp. 5174-5178, 2014.
- T. Santhanam and M.S Padmavathi, “Application of K-Means and Genetic Algorithms for Dimension Reduction by Integrating SNM for Diabetes Diagnosis,” Procedia Computer Science, vol. 47, pp. 76-83, 2015.
- J. Vijayashree and J. Jayashree, “ An Expert System for the Diagnosis of Diabetic Patients using Deep Neural Networks and Recursive Feature Elimination,” International Journal of Civil Engineering and Technology, vol. 8, pp. 633-641, Dec. 2017.
- L. B. Goncalves and M. M. Bernardes, “Inverted Hierarchical Neuro-Fuzzy BSP System: A Novel Neuro-Fuzzy Model for Pattern Classification and Rule Extraction in Databases,” in IEEE Transactions on Systems, Man, and Cybernetics, vol. 36, no. 2, pp. 236-248, Mar. 2006.
- L. Han, S. Luo, H. Wang, L. Pan, X. Ma and T. Zhang, "An Intelligible Risk Stratification Model Based on Pairwise and Size Constrained Kmeans," in IEEE Journal of Biomedical and Health Informatics, vol. 21, no. 5, pp. 1288-1296, Sept. 2017.
- Pima Indian Diabetes Data Set, [Online]. Available: https://archive.ics.uci.edu/ml/datasets/Pima+Indians+Diabetes., accessed on May 01, 2018.
- Ahmad F, Isa NA, Hussain Z, and Osman MK, “Intelligent medical disease diagnosis using improved hybrid genetic algorithm--multilayer perceptron network,” Journal of Medical Systems, vol. 37, Apr. 2013.
- N. Yilmaz, O. Inan, and M. S. Uzer, “A New Data Preparation Method Based on Clustering Algorithms for Diagnosis Systems of Heart and Diabetes Diseases,” Journal of Medical Systems, pp. 38-48, Apr. 2014.
- Ribeiro, U. Celeste, et al. “Diabetes classification using a redundancy reduction preprocessor,” Research on Biomedical Engineering, vol. 31, pp. 97-106, 2015.
