Diagnosis of atmospheric temperature anomalies in seismically active regions of Asia on the basis of satellite data

Author: Sverdlik Leonid G., Imashev Sanjar A.
Journal: Журнал Сибирского федерального университета. Серия: Техника и технологии @technologies-sfu
Article in issue: 8 т.11, 2018.
Free access
Results of diagnosis of temperature anomalies based on retrospective analysis of long-term time-series of temperature in separation zone of troposphere and stratosphere over epicenters of 10 strong earthquakes with magnitude of M>6.5 that occurred in different seismically active regions of Asia are presented. Anomalous temperature perturbations were observed in all the studied cases 1-8 days before the main seismic event.
Earthquake, satellite data, atmosphere, temperature time series, tropopause, anomalies, outgoing longwave radiation
Short address: https://sciup.org/146279562
IDR: 146279562 | UDC: 551.507; | DOI: 10.17516/1999-494X-0117
Диагностирование аномалий температуры атмосферы в сейсмически активных регионах Азии по спутниковым данным
Представлены результаты диагностирования аномалий температуры, основанные на ретроспективном анализе долговременных спутниковых данных в зоне раздела тропосферы и стратосферы над эпицентрами 10 сильных землетрясений магнитудой M>6,5, произошедших в различных сейсмически активных регионах Азии. Аномальные возмущения температуры наблюдались во всех рассмотренных случаях за 1-8 дней до основного сейсмического события.
Text of the scientific article Diagnosis of atmospheric temperature anomalies in seismically active regions of Asia on the basis of satellite data
One of the directions of complex monitoring of seismically active regions and interaction of geospheres is study a connection between dynamics lithospheric and atmospheric processes during earthquakes. At current time, using satellite remote sensing is a modern trend in detecting anomalous perturbations in atmosphere associated with seismic activity and main advantages of such method are global coverage, regular data obtaining, possibility of studying space-temporal structure of various atmospheric parameters, including temperature [1]. Thermal anomalies before strong earthquakes were observed at different levels, ranging from the surface of the earth to the upper cloud boundary, and were repeatedly recorded by many researchers [2, 3], but the results of such studies were not always unambiguous [4].
Meanwhile, as shown by satellite measurements, it is observed that in the layers of atmosphere separated by tropopause and characterized by different behavior of temperature gradient, the dynamics of amplitude and phase variation of temperature fluctuations have a fairly stable relationship with variations in seismicity. These tropospheric effects, which can be used for short-term forecasts of large seismic events were identified in [5] for the first time. The relationship between seismic activity and temperature variations in upper troposphere was clearly shown during the fatal earthquake in Japan in the spring of 2011 [6, 7], and also before the relatively strong seismic events in the Northern Tien-Shan [8, 9]. The main objective of this work, which is a continuation of these studies, consisted in additional test of effectiveness of the technique developed by the authors for diagnosing temperature perturbations in tropopause region, using as an example the strong earthquakes that occurred in seismically active regions of Asia.
Seismic and satellite data
According to the task, we construct a set of seismic data from earthquakes with magnitudes M > 6.5 using interactive service IEB [10]. These events occurred in Asia over the last few years (2011 - 2015) and for which satellite measurement are available in GIOVANNI system of visualization and analysis [11]. In order to ensure representativeness, temperature data were analyzed during the periods of preparation of 9 arbitrarily selected earthquakes with magnitudes from 6.6 to 8.6, which recorded in different geographic zones with high seismic risks from the equator to medium latitudes both over land and over the ocean: in Russia (Tuva, 27.12.2011, M = 6.6), Russia (Tuva, 26.02.2012, M = 6.7), Indonesia (Sumatra, 11.04.2012, M = 8.6), Pakistan (Balochistan, 24.09.2013, M = 7.7), China (Tibet, 12.02.2014, M = 6.8), Japan (Honshu island, 16.02.2015, M = 6.7), Nepal (Lamjung, 25.04.2015, M = 7.8), Japan (Honshu island, 12.05.2015; M = 6.8) and Japan (Ogasawara island, 30.05.2015, M = 7.8). The strongest regional seismic event in Kyrgyzstan (Suusamyr, 19.08.1992, M = 7.4), information about which is taken from the catalog of earthquakes [12] is also analyzed.
The time series of temperature T(t) with 12-hour time resolution ( ∆t = 12h) were reconstructed from satellite measurements at 10 isobaric levels ( p k ) from 500 to 70 hPa over each box of ±1º from the epicenters of earthquakes [11]. The duration of observation series was 12 months for the earthquake in Kyrgyzstan and 2-3 months before and after each of the other events.
Procedure of atmospheric temperature time series processing
The procedure for processing of temperature time series (documented in detail in [9]) is based on analysis of quasiperiodic components, whose period is ∼ 5 - 8 days. The validity of such approach is demonstrated by wavelet spectrograms (Morle) [13], clearly distinguishing variations of such a time scale before large earthquakes (Fig. 1).
At the initial stage, the time series T(t) were transformed to dimensionless form, altogether with the removal of nonlinearity of altitude temperature distribution by calculating the temporal dynamics of temperature anomalies ( ΘT ) at each isobaric level in the form of deviation of the current temperature from the average monthly level ( ∆T ) normalized by standard deviation ( σT ). The resulting series of temperature anomalies were averaged over two altitude ranges corresponding to the free troposphere ( ΘТFT ) and a region above the tropopause ( ΘТTP ), which were characterized by antiphased changes of ΘT due to difference in temperature gradient ( γ FT = ∆T/∆p < 0; γ TP = ∆T/∆p > 0) (Fig. 2).
The choice of isobaric levels, which were averaged over each range, was based on a correlation comparison of the behavior of temperature anomalies, based on the maximum similarity of the temporal variability of ΘT .
After that, ΘТ FT and ΘТ TP time series were converted using moving window, when each element in the final series was calculated as a variance of some number ( m ) of previous values. The size of the
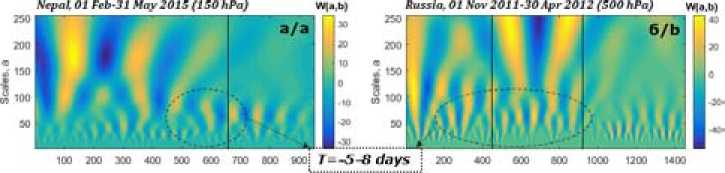
Fig. 1. Wavelet spectrograms of temperature time series ( ∆t = 3h) during periods of seismic activity in Nepal (150 hPa) (a) and Russia (500 hPa) (b). Vertical lines show the moments of strong earthquakes
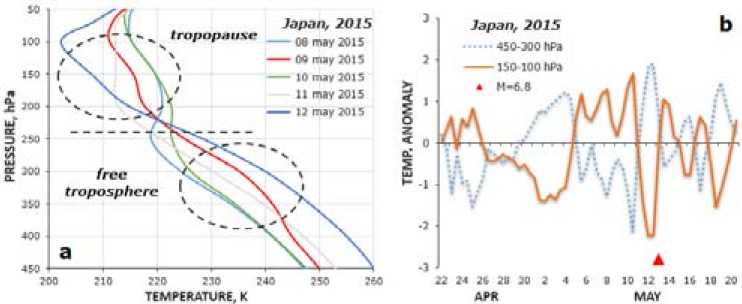
Fig. 2. Transformation of vertical temperature profiles (a) and time series of average values of temperature anomalies in 450 - 300 and 150 - 100 hPa layers (b) before the earthquake in Japan (marker indicates the moment of the earthquake M = 6.8 on May 12, 2015)
“window”, as a rule, was taken equal to m = 6, which allowed us to analyze the short-period temperature variations in the spectrum. Diagnostics of temperature perturbations is based on product of moving variances of time series of temperature anomalies in the free troposphere and above tropopause:
D = D Θ FTT ⋅ D Θ TPT .
The parameter D determines the position on a time scale of the anomalous temperature variations in both layers, significantly exceeds 1 for large values of DΘТ, but is significantly less than 1 in the absence of temperature fluctuations, when the natural variability does not exceed the average monthly values (∆T <σ ), or under the influence of random factors, when one of the multiplicands is less than T one (DΘFTT≤1 или DΘTPT≤1).
This procedure was tested in a series of relatively strong seismic events with energy class of K ≥ 13.0 that occurred in the Northern Tien-Shan in 2003-2015, showing that the anomalous temperature perturbations in tropopause region over the epicentral areas of the upcoming earthquakes showed a fairly stable trend which were observed in about 70% of all cases [8, 9].
Discussion of results of temperature anomalies diagnosing
Suusamyr earthquake (M = 7.4), August 19, 1992
On August 19, 1992, the strongest in the last decades, Suusamyr earthquake of magnitude M = 7.4 was registered in the Northern Tien Shan, after which an intensive activation of seismicity is began. The main seismic event was accompanied by a large number of aftershocks (636 and 527 seismic events in August and September, respectively, which is more than typical annual rate). The temperature variations at isobaric levels from 300 to 100 hPa in 1992 are shown in Fig. 3a.
Correlation between time series of temperature increment ∆T = T(ti+1) – T(ti) at levels of 300 and 100 hPa and calculated for the same time in moving window of m = 20 days, is shown in Fig. 3b.
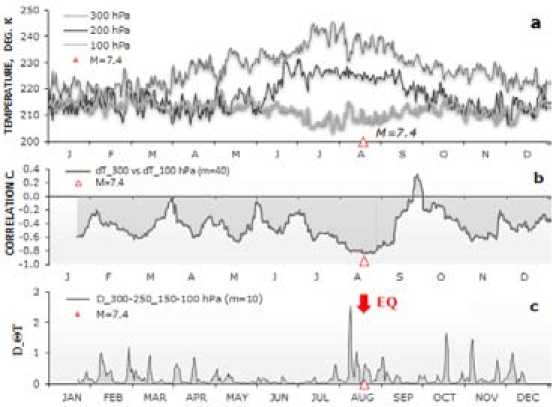
Fig. 3. Dynamics of temperatures at isobaric levels of 300, 200 and 100 hPa (a); correlation between ∆T for one moment of time (b); parameter D (c) in 1992 (marker indicates the moment of the earthquake M = 7.4 on August 19, 1992)
Increase in local correlation coefficients up to R = -0.84 before the strong seismic event is associated with both increase in amplitude of temperature fluctuations and with synchronous temperature changes. Immediately after the earthquake, there was a sharp decrease in the consistency of the internal dynamics of the series, which lasted more than two months. The results of diagnosing of temperature anomalies ( D parameter) in layers of 300-250 and 150-100 hPa, separated by tropopause, show an area with a high D = 2.5 for 8-9 days before the earthquake (Fig. 3c). Similar results were obtained using the product of moving variances of variations range ( RT ). Thus, it is clear coincidence of temperature anomaly with preparation period of a strong earthquake.
Anomalies of outgoing longwave radiation
In addition, to independently confirm formation of thermal anomalies before a strong earthquake we constructed the maps of spatial distribution of daily average values of outgoing long-wave radiation (OLR) [14]. Based on these data, we calculate zonal anomalies for each pixel, as a deviation of the current value from the average of the previous 5-year period (1987-1991) [15]. Calculations showed that OLR anomaly, observed on August 15, 1992, exceeded the level of 2 σ and approximately repeated the location of the active regional faults (shown with dashed lines) elongated in the latitudinal direction (Fig. 4a). Three days later, one day before the earthquake (August 18, 1992), the anomaly of outgoing long-wave radiation was recorded near the epicenter of the main seismic shock (Fig. 4b), which is consistent with similar results obtained earlier for the Tien-Shan earthquakes [8]. The size of the main OLR anomaly (> 3 σ ) was ~150×300 km.
Earthquakes with magnitude of M ≥ 6.5 in seismically active regions of Asia
Peculiarities of thermal regime of the upper troposphere in seismically active regions of Asia were characterized by significant differences, which were probably determined by overall effect of physical processes developing in the atmosphere and in the earth’s surface. One of such influencing factors was, probably, seismic activity. However, despite the amplitude and phase differences in temperature variations in tropopause region, the application of the technique made it possible to reveal general patterns (or signs) which were typical for all the studied earthquakes. As an example, Fig. 5 shows time series of average values of temperature anomalies in the indicated layers (upper figures) and product of moving variances calculated for m = 6 previous values ( D ) for earthquakes in Russia ( M = 6.6-6.7)
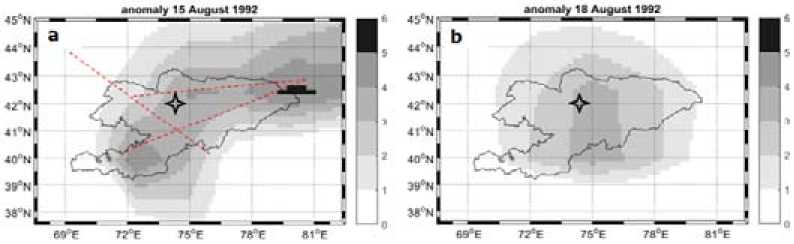
Fig. 4. Spatial distribution of anomalies of outgoing long-wave radiation near epicenter of the earthquake: a -August 15; b - August 18, 1992
and Sumatra ( M = 8.6) in winter and spring periods of 2011-2012. It is clear that the regions with the highest values of D parameter correlated with the main seismic shock, appearing several days before these events.
The results of diagnosing of atmospheric temperature anomalies, combined together to same moment of earthquake, are shown in Fig. 6a in the form of variations of D parameter for the time period from 14 days before the event up to 4 days after it. For comparison, similar data are given for earthquakes of energy class of K > 13.0 in Tien-Shan in 2003-2015 (Fig. 6b).
Obviously, both plots demonstrate a significant degree of similarity in high values of D parameter, which either coincide with seismic shocks, or precede them. In general, these regions correspond to more intense and correlated variations in atmospheric layers separated by tropopause during a period of time determined by the size of moving window which is approximately corresponding to half-
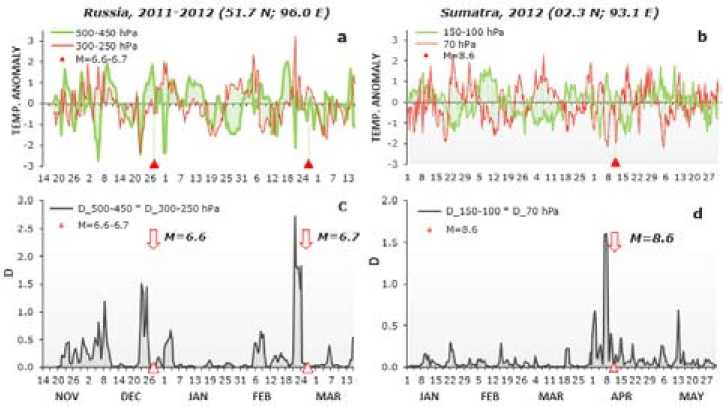
Fig. 5. Temporal dynamics of average temperature anomalies in the layers (a, b), moving variance and their product ( D ) (c, d) in Russia (from November 14, 2011 till March 15, 2012) and Sumatra (from 01 January till May 31, 2012). Time resolution ∆t = 12h, moving window size m = 6
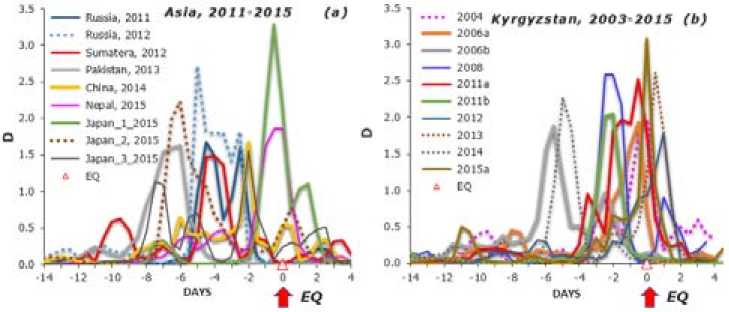
Fig. 6. Results of diagnosis of air temperature anomalies (parameter D ) before earthquakes in the Northern Tien-Shan ( K ≥ 13.0) in 2003-2015 (a) and in seismically active regions of Asia ( M > 6.5) in 2011-2015 (b)
period of the analyzed component of temperature variation spectrum (3-4 days). The criterion for the anomalous behavior of temperature in all the cases was the integral parameter D, exceeding 1.5 ( D > 1.5). This parameter can be used as a short-term precursor of a strong earthquake.
Summary and Conclusions
Analysis of satellite data showed that the considered sample of 10 strong seismic events ( M > 6.5), which occurred in different regions of Asia, was preceded by abnormal temperature change in area between troposphere and stratosphere and which appeared 1 - 8 days before the main shock. Taking into account that epicenters of earthquakes have significant differences in latitude and conditions of the earth's surface, which determine characteristics of thermal regime of atmosphere, the developed method showed acceptable efficiency of diagnosing temperature anomalies.
Despite the positive statistics accumulated to date on diagnosing of temperature anomalies in the upper troposphere, it is early to say that they apply to all major seismic events, and, thus additional studies are needed. The main purpose of our future studies will be extension of data statistics and also construction of a model showing how the processes occurring in during preparation of earthquakes cause abnormal temperature fluctuations in the upper troposphere and antiphase oscillations in tropopause.
Acknowledgments
References Diagnosis of atmospheric temperature anomalies in seismically active regions of Asia on the basis of satellite data
- Tronin A. Satellite Remote Sensing in Seismology. A Review. Remote Sens., 2010, 2(1), 124-150.
- Pulinets S.A., Ouzounov D.P., Karelin A.V., Davidenko D.V. Physical bases of the generation of short-term earthquake precursors: A complex model of ionization-induced geophysical processes in the lithosphere-atmosphere-ionosphere-magnetosphere system. Geomagnetism and Aeronomy, 2015, 55(4), 540-558.
- Jing F., Shen X.H., Kang C.L., Xiong P. Variations of multi-parameter observations in atmosphere related to earthquake. Nat. Hazards Earth Syst. Sci., 2013, 13, 27-33.
- Prakash R., Srivastava H.N. Thermal anomalies in relation to earthquakes in India and its neighbourhood. Current Science, 2015, 108(11), 2071-2082.
- Кашкин В.Б., Романов А.А., Григорьев А.С., Баскова А.А. Тропосферные землетрясения в Туве, наблюдаемые с искусственных спутников Земли. Журнал Сибирского федерального университета. Техника и технология, 2012, 5(2), 220-228.
- Kashkin V.B. Inner gravity waves in the troposphere. Atmospheric and Oceanic Optics, 2013, 26(10), 908-916.
- Imashev S.A., Sverdlik L.G. Temperature variations of atmosphere during high seismic activity in Japan in 2011. Science, new technologies and innovations, 2015, 1, 15-19.
- Свердлик Л.Г., Имашев С.А. Аномалии температуры атмосферы в периоды сейсмической активности. Журнал Сибирского федерального университета. Техника и технология. 2017, 10(6), 783-793.
- Sverdlik L.G., Imashev S.A. Atmospheric temperature regime change influenced by seismic activity. Science, new technologies and innovations, 2015, 4, 9-14.
- The IRIS Earthquake Browser (IEB). URL: http://ds.iris.edu/
- The NASA GES-DISC. URL: http://giovanni.gsfc.nasa.gov/
- Earthquakes catalog of Institute of Seismology of NAS KR and Research Station of RAS.
- Donoho D.L, Johnstone J.M. Ideal spatial adaptation by wavelet shrinkage. Biometrika, 1994, 81(3), 425-455.
- URL: http://www.esrl.noaa.gov/psd/cgi-bin/
- Venkatanathan N., Natyaganov V. Outgoing longwave radiations as pre-earthquake signals: preliminary results of 24 September 2013 earthquake (M 7.7). Current Science, 2014, 106(9), 1291-1297.
