Differential hikes in phenolic and flavonoid compounds in germinating soybean (glycine max) seeds under abiotic stresses
 seeds under abiotic stresses")
Author: Sirsat Ashwini K., Nadaf Heena L., Hivrale Vandana K.
Journal: Журнал стресс-физиологии и биохимии @jspb
Article in issue: 1 т.19, 2023.
Free access
Background: The current study focuses on the participation of total phenolic content (TPC), total flavonoid content (TFC) as well as antioxidant activity in germinating soybean seeds under abiotic stress. The context and purpose of the study: For this study, soybean seeds were subjected to three abiotic stresses namely drought, flood, and salinity for 3 days. Method: The estimation of TPC and TFC was performed by FTIR and spectrophotometric method. The spectrophotometric estimation of TPC and TFC was performed by Folin Ciocalteu and Aluminium Chloride method respectively. Results: The highest TPC (68.78 µg gallic acid/ml) and TFC content (6.23 µg quercetin/ml) found in drought treated seeds for one day. In terms of the DPPH scavenging assay, the highest (67.63%) and lowest (46.83%) percentage of inhibition was observed on the1st and 3rd day of salinity stress respectively. Results of the current study also showed a strong positive correlation between TPC and TFC analyzed by FTIR and Spectral data. Conclusion: The study supports the role of phenolic and flavonoid in germinating soybean seeds under abiotic stress.
Abiotic stress, phenolic, flavonoid, ftir, soybean (glycine max)
Short address: https://sciup.org/143179373
IDR: 143179373
Text of the scientific article Differential hikes in phenolic and flavonoid compounds in germinating soybean (glycine max) seeds under abiotic stresses
Soybean ( Glycine max ) is one of the most important cash crops and the third-largest leguminous crop cultivated in India (Khan et al. , 2009, Mutava et al. , 2015, Waqas et al. , 2019). Soybean is one of the major cash crop and it is a good source of oil and proteins for humans, cattle and aquaculture (Deshmukh et al. , 2014; Todayoshi and Goldsmith 2009). Abiotic stresses like drought, flood, and salinity hamper the plant growth and lower the yield of soybean worldwide (Waqas et al. , 2019).
The demand for food increases with time due to the increase in population. The ecological balance is disturbed by the severe climatic changes in the environment. Such adverse climatic changes impose various kinds of abiotic and biotic stresses on plants. Crop plants are extremely sensitive to these abiotic stresses such as drought, heat, cold, salinity, UV radiation, oxidative stress, mechanical stress, nutrient stress, and phytohormone- mediated stress (Bej and Basak 2014) which affect the plant performance and lead to reduced productivity. These abiotic factors are the major cause of severe losses in agriculture throughout the world (Barnabas et al. , 2008; Athar and Ashraf 2009). Adverse changes in the environmental conditions are also reducing the productivity of soybean crop.
Plants imposed by abiotic stresses shows anxious metabolism. Plant metabolomics plays a very important role in resisting adverse effects generated by stress conditions (Austen et al., 2019; Xu et al., 2022). To defeat with such drastic unfavorable environmental conditions plant exhibit alteration at physiological, molecular, and cellular level (Sahitya et al., 2018). The abiotic stress factors including drought, soil flooding, salinity and extreme temperatures, induce the major amendment in the plant metabolome make–up (Zandalinas et al., 2022). For crop development, knowledge of the acute function of primary and secondary metabolites in the stress tolerance process is required. The plant produces secondary metabolites due to distinct physiological alterations (Zandalinas et al., 2018). These secondary metabolites monitor the plant growth, development, survival and protect the plants facing various stressed environments (Athar and Ashraf 2009). The secondary metabolites can be classified into three groups namely phenolic compounds (flavonoids and phenylpropanoids), terpenes (isoprenoids), and nitrogen-containing compounds (cyanogenic glycosides, alkaloids, and glucosinolates). Among these, Phenolic compounds play an important role in plant growth, reproduction, and resistance to abiotic and biotic stress (Achakzai et al., 2009; Gimenez et al., 2014). Metabolomics is one of the important way by which the molecular mechanism of stress resistance can be analyzed adequately (Deshmukh et al., 2014).
In India, monsoon irregularity, groundwater depletion, and increasing population are the main reason for water scarcity and drought stress. Soybean production was reduced worldwide by 33.1-12.2% due to drought (Sahitya et al. , 2018). Under drought conditions, free radicals get increase and starts to steal electrons from lipids present in the cell membrane which shows damage and leakage in the plant cell membrane. This process is known as lipid peroxidation. (Gharibi et al. , 2016; Sarker and Oba 2018).
The commencement of flood is due to overindulgent irrigation, the low infiltration rate of soil and heavy rainfall. In submerged conditions, the rate of photosynthesis lowers because of the lack of carbon dioxide which further shows leaf chlorosis. The majority of soybean varieties are sensible to flooding and responsible for chlorosis, necrosis, stunting, defoliation, reduced nitrogen fixation, and plant death. Worldwide 16% of soybean production turns down due to flood stress. Soybean seed shows lower seed germination and survival rate as oxygen supply is not properly maintained in flooding conditions (Wu et al. , 2017). In addition to this fungus also affect the seed germination and seedling emergence in plants including Fusarium, Rhizoctonia, Phomopsis, Pythium and Phytophthora (Hussain and Farzana 2019, Wu et al., 2017).
Excess use of fertilizers and obstructive irrigation are the two main reasons behind cropland salinity. Currently near about 800 million hectares of the land in the world are influenced by salinity (Khan et al., 2009). Salinity is responsible for poor plant growth and reduced crop yield. Further, salinity is also associated with oxidative stress, osmotic stress and toxicity (Neves et al., 2010). During the salinity stress Na+ and Cl- ions aggregate in plant tissues. These increased Na+ concentrations prohibit the uptake of K+ ions which is crucial for plant growth and development. In these conditions, crop yield is reduced and can lead to plant death. The plant increases the production of reactive oxygen species ( OS) in such stressful situations. These OS pull down by antioxidant agents like phenolic and flavonoid (Gupta and Huang, 2014, Shah and Smith, 2020, Waqas et al., 2019). Salinity stress can lower the 40% of soybean yield (Cheng et al., 2020).
Abiotic stress like drought and salinity in plants shows oxidative damage (Chen et al. , 2013; Sarker and Oba, 2018). The oxidative damage further causes the generation of OS like OH-, H 2 O 2 and O 2 . This accumulated OS can directly attack membrane lipid, deactivate metabolic enzymes and damage nucleic acid, leading to cell death (Chung et al. , 2020). The plant encountered in such stressed conditions tries to defeat oxidative damage by the antioxidative defense system. This antioxidative defense of the system lowers the destruction created by OS (Khan et al. , 2009). Secondary metabolite like phenolic and flavonoid helps the plant to cope with the stressed condition by detoxifying the OS (Swigonska et al. , 2014; Sarker and Oba, 2018). Therefore, the present investigation has been carried out to evaluate the role of secondary metabolites in mitigating the adverse effect of various stress conditions like drought, flood, and salinity in soybean. The objective of the present study was to evaluate the level of total phenolic and flavonoid components in germinating soybean under abiotic stress by FTI and colorimetric analysis. A correlation is shown between total phenolic and flavonoid components analyzed by FTI and spectral data. The study also focused on the antioxidant activity of total phenolic and flavonoid components in germinating soybean seeds under the abiotic stress condition.
To the best of our knowledge, this is our first report in which FTI was used to examine the effect of three abiotic stresses, namely drought, flood and salinity on phenolic and flavonoid components in soybean during the germination period. The results of the study could be able to evaluate the role of phenolic and flavonoid component in defeating abiotic stress.
MATERIALS AND METHODS
Plant materials and treatments
Soybean seeds were obtained from the Krishi Seva Kendra, Akola, Maharashtra, India. Healthy and equalsized seeds were chosen, rinsed twice with sterilized distilled water to remove dust and surface sterilized with 0.1 % HgCl 2 for 10 minutes. After that, these seeds were thoroughly rinsed and soaked in sterilized water for six hours. Sterilized seeds were placed in clean sterilized petri plates with two layers of moistened filter paper. Ten seeds were added in each petri dish.
For the drought stress treatment, the soaked soybean seeds were placed in sterilized petriplates with dried filter paper (Hackenberg et al. , 2015; Hivrale et al. , 2016; Zhou et al ., 2010). For the flood stress treatment, the seeds were kept in a sterilized container with the water level maintained 5 cm above the seed surface (Pires et al ., 2018; Tan et al. , 2016; Wu et al. , 2017) and for the salinity stress, two ml of 200 mM NaCl was sprinkled on filter paper and soaked seeds kept on that. The controlled seed was watered regularly. Along with the control seeds, the stress treatment was continued for 1, 2, and 3 days. Each experiment was repeated three times.
Sample Preparation
Soybean seeds (100 mg) were crushed in 1 ml of 80% methanol for 1 hour, after this seeds were sonicated for 10 minutes and centrifuged at 8000 rpm for 10 minutes. The supernatant was collected and filtered through a 0.45μm syringe filter, and the extracts were stored in the dark at -20° C for further analysis (John et al ., 2017; Varela et al. , 2016).
Total Phenolic Content
The Folin–Ciocalteu method was used to determine the total phenolic content of the extract (Kamtekar et al., 2014; Baba and Malik, 2015). Methanol was added to 0.5 ml of seed extract to make the volume 1 ml, and 0.5 ml of Folin–Ciocalteu reagent was added and mixed well. 1.5 ml of 20% sodium carbonate was added, and the volume was made up to 10 ml with distilled water before incubating for 1 hour in the dark. After incubation, absorbance was measured at 750 nm using a Thermo Scientific Genesys 10S UV-Vis spectrophotometer instrument. The measurement was carried out in triplicate. The control was made with a reagent blank and solvent. Gallic acid (50µg/ml) was used as a control. The total phenolic content was calculated as µg of gallic acid equivalent weight (GAE) per ml.
Total Flavonoid Content
The aluminum chloride colorimetric assay was used to determine the total flavonoid content (Kamtekar et al. , 2014; Baba and Malik, 2015; Abdel-Moemin, 2016). In 0.5 ml of seed extract, Methanol was added to make the volume 1 ml, and 0.3 ml of 5% sodium nitrite was mixed and incubated for 5 minutes before adding 0.3 ml of 10% aluminum chloride and left stable for 6 minutes. Finally, 2 ml of 1 M sodium hydroxide was added, and the volume was increased to 10 ml with distilled water. The absorbance was measured at 510 nm using a Thermo Scientific Genesys 10S UV-Vis spectrophotometer. The blank was created with distilled water. As a control, 25 µg/ml of quercetin was used.
FT-IR analysis and spectral collection
The FTI spectra of extract of germinating soybean seeds were recorded in an FTI instrument (Model/Make: Bruker, Germany), with PC-based software controlling instrument operation and data processing. Using KBr, a small amount of powdered seed samples were formed into pellets for FTI analysis, and a thin film was formed by applying pressure. Infrared transmittance data was collected over a wave number range of 4000 cm-1 to 400 cm-1. All samples were examined in triplicate, with plain KBr pellets serving as a control. To identify the functional groups present in the sample, the spectral data were compared to a reference (Santos et al. , 2019).
DPPH free radical scavenging activity
The stock solution was made by dissolving 22 mg of DPPH in 50 ml of methanol and keeping it at – 20°C until needed. In methanol, different concentrations (0.1, 0.2 ml ----- to 1 ml) of extracts were prepared. Each extract was combined with 3.9, 3.8 ----- 3 ml DPPH respectively. This mixture was allowed to react for 30 minutes before being measured at 515 nm. In the control sample, the extract was not used. The following formula was used to calculate scavenging activity (Ahmed et al., 2012).
DPPH radical scavenging activity (%) = [ (Abs control – Abs sample) / Abs control ] x 100
Abs control =The absorbance of DPPH radical + methanol
Abs sample = The absorbance of DPPH radical + extracts
Statistical Analysis
Every sample was collected and examined in triplicate. Pearson's correlation test was used to investigate the relationship between total phenolic and flavonoid content. The mean standard deviation was used to analyse the results.
RESULTS
Total Phenolic Content esults presented in figure 2 revealed an analysis of the total phenolic content (TPC) of methanolic extract of germinated soybean seeds under drought, flood, salinity and control (without stress) conditions. The Gallic acid standard graph is shown in figure 1. The total phenolic content of all stress-treated and control seeds varied according to the treatments. On the first day, the total phenolic content was 13.68 µg/ml in the control while it was observed 68.78µg/ml, 6.25µg/ml, and 47.09µg/ml for drought, flood and salinity respectively. All stress-treated soybean seeds had upregulation in phenolic content except flood when compared to control seeds. On the second day, the observed total phenolic content values were 14.85µg/ml, 24.33µg/ml, 3.03µg/ml, and 7.72µg/ml for control, drought, flood and salinity respectively. As compared to the control set higher TPC was observed under stress conditions and showed significant changes in phenolic content on the second day of germination. Similarly, on the third day of germination, there were significant differences observed in TPC content between the stress-treated seeds and the control set.
Total Flavonoid Content
Figure 4 shows the results of the total flavonoid content of methanolic extract of germinated soybean seeds under drought, flood, salinity and control conditions. In terms of total flavonoid content, we found significant differences between all stress-treated and control soybean seed. The standard graph of quercetin is shown in figure 3. The total flavonoid content in the control sample was found to be 1.55µg/ml, 6.23µg/ml in drought,1.07µg/ml in flood and 4.28µg/ml in salinity on the first day. On the second day, total flavonoid content was determined to be 1.46µg/ml in the control, 2.92µg/ml in the drought, 0.68µg/ml in the flood and 1.43µg/ml in the salinity. Total flavonoid content increased by twofold in the drought stress compared to the control seeds, dropped dramatically in flood and was nearly identical to 1.43µg/ml for salinity. The total flavonoid content observed in the control condition on the third day of stress treatment to germinating soybean seeds was 2.42µg/ml. We found differences in TFC content of all stress-treated seeds compared to the control condition. The highest total flavonoid content was 2.80µg/ml in drought, 1.70µg/ml in flood and 1.73µg/ml in salinity. The drought shown the highest total flavonoid content on the last day of stress treatment. Salinity causes a very minor increase in total flavonoid content when compared to flood (1.70µg/ml). The differences in total flavonoid content between salinity and flood are negligible. Total flavonoid content increased in flood stress compared to total phenolic content, indicating its role in flood stress.
DPPH Free Radical Scavenging Activity
In our investigation, free radical scavenging activity of methanolic extract of germinated soybean seeds under drought, flood, salinity, and control conditions varied very slightly 46.63-67.63%. The highest activity was found on the 1st day (67.63%) and it was lowest on the 3rd day of the salinity stress. The graph of DPPH free radicle scavenging activity is shown in figure 5.
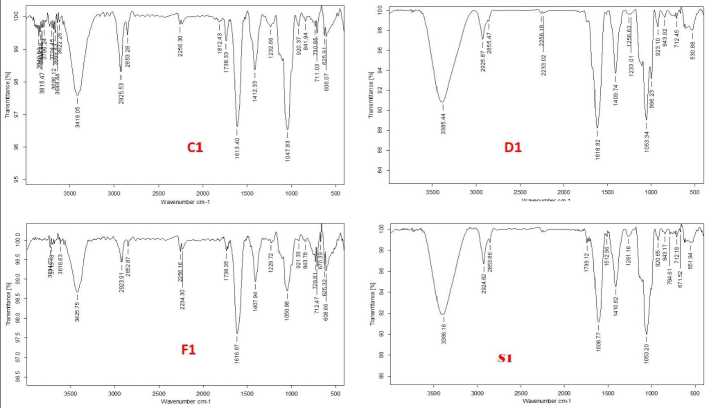
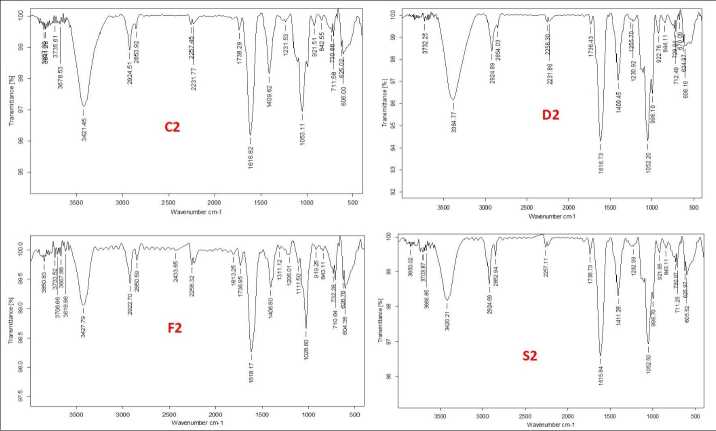
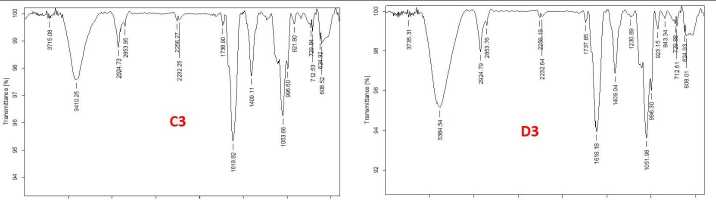
FT-IR
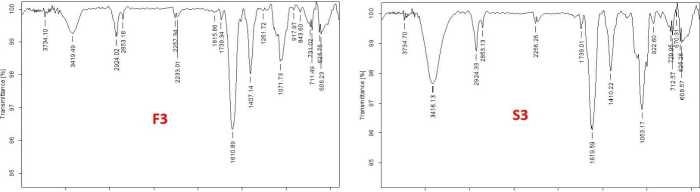
The functional groups of the active components present in the extract was analysed by using the physicochemical technique FT-I (Fourier transform infrared) spectroscopy. The functional groups of the components were separated based on the ratio of its peak while the extract was passed through FT-I . The presence of N-H, O-H, C=C, C-H, C-O, and CH 3 functional groups were identified and confirmed by FT-I spectral study. The FTI spectra of germinating soybean seeds under control and stress conditions on 1st, 2nd and 3rd day are shown in figures 6A, 6B, and 6C respectively. The peak values of obtained functional groups compared with standards is shown in table 1.
Correlation
The absorbance values obtained from colorimetric and FTI data are tabulated in table 2. The correlation matrix for phenolics and flavonoids by colorimetric and FTI data is shown in Table 3. A strong positive correlation was observed between the FTI and spectral data analysed for content of total phenolic and flavonoid components. Also drought and salinity values showed an excellent correlation between FTI and colometric data.
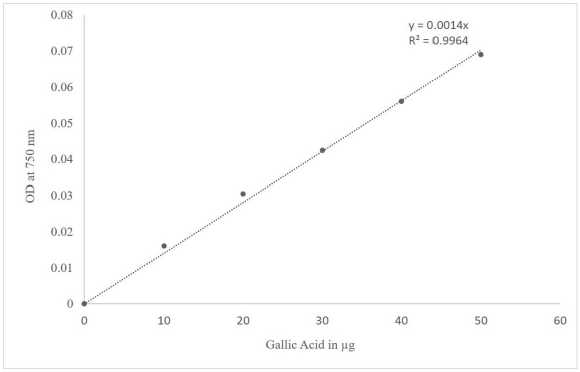
Figure 1 Standard curve of Gallic Acid
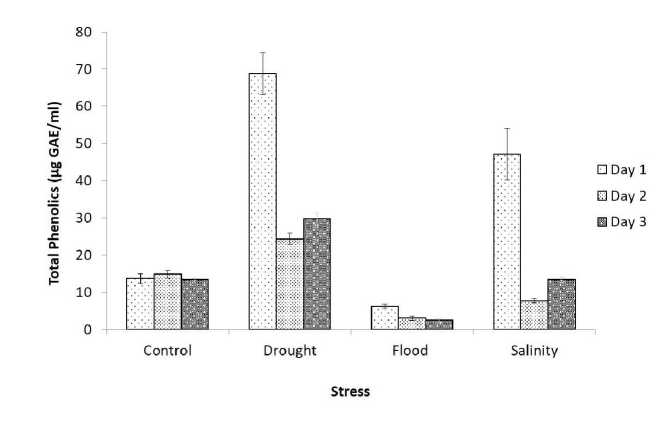
Figure 2 Total phenolic content of germinating soybean seed under abiotic stress condition with the control sample
(GAE- Gallic acid equivalent)
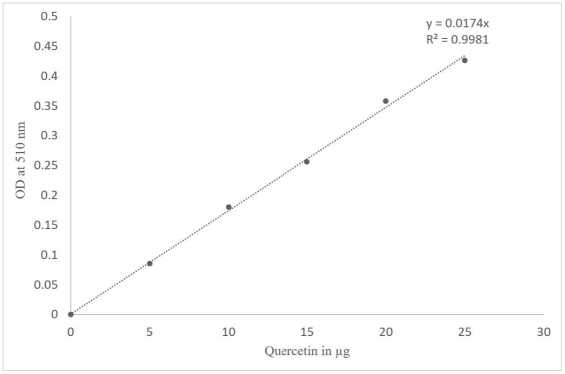
Figure 3 Standard curve of Quercetin
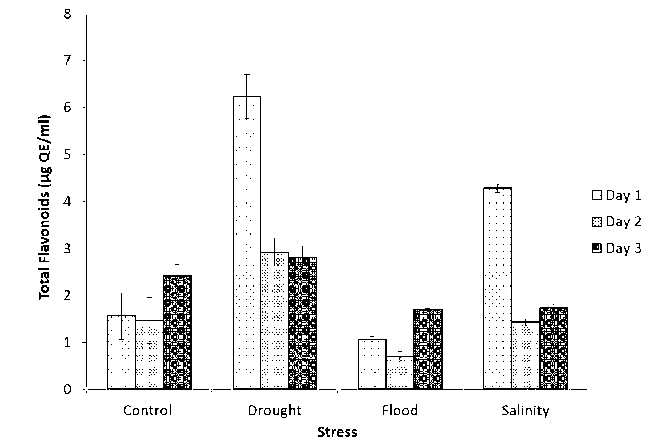
Figure 4 Total flavonoid content of germinating soybean seed under abiotic stress condition with the control sample (QE- Quercetin equivalent)
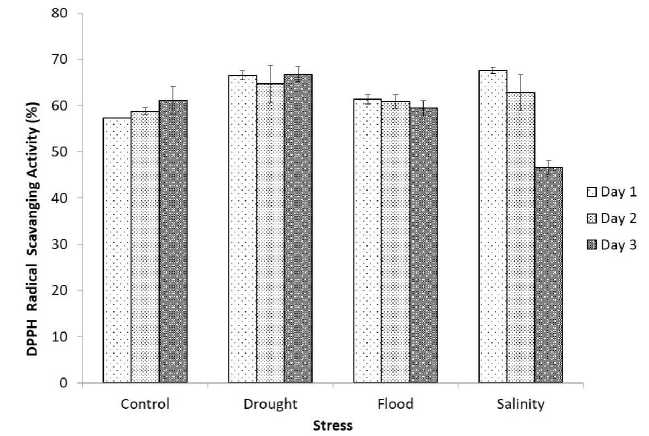
Figure 5 DPPH Free adical Scavenging Activity
Table 1. FTI peak assignment table of all stress-treated geminated seeds compared with standard chart
|
Functional groups |
Ci |
Di |
Fi |
Si |
Cz |
Dz |
Fz |
Sz |
Сз |
Оз |
F3 |
5з |
|
Unknown |
3644.44 |
— |
3618.63 |
— |
3678.53 |
3732.25 |
3618.86 |
3666.85 |
3715.08 |
3735.31 |
3734.10 |
3734.70 |
|
Free alcohol-OH stretching |
3418.05 |
3385.44 |
3425.75 |
3386.16 |
3421.45 |
3384.77 |
3427.79 |
3420.21 |
3410.25 |
3384.54 |
3419.49 |
3416.13 |
|
Intramolecular bonded alcohol -OH stretching |
2925.87 |
2923.91 |
2924.82 |
2924.51 |
2924.89 |
2922.70 |
2924.69 |
2924.73 |
2924.79 |
2924.02 |
2924.33 |
|
|
C-H stretching alkane |
2853.28 |
2855.47 |
2852.87 |
2853.86 |
2853.92 |
2854.03 |
2850.59 |
2852.94 |
2853.95 |
2853.76 |
2853.18 |
2853.13 |
|
C^C, C=N stretching |
2256.30 |
2233.02 |
2256.16 |
2231.77 |
2231.86 |
2258.32 |
2257.11 |
2232.25 |
2232.64 |
2233.01 |
2256.26 |
|
|
C=N stretching imi^ or c=o stretching conjugated ketone or alkenes |
1613.40 |
1618.82 |
1616.87 |
1608.77 |
1616.82 |
1616.73 |
1618.17 |
1615.84 |
1619.82 |
1618.18 |
1610.89 |
1619.59 |
|
Alcohols C-0 stretch |
1047.83 |
1053.34 |
1050.98 |
1053.20 |
1053.11 |
1052.20 |
1028.80 |
1052.50 |
1053.66 |
1051.98 |
1071.73 |
1053.17 |
Table 2 . FT-I and colorimetric data of the germinating soybean seeds under drought, flood, salinity stress with controlled condition.
|
Sample |
FT-I data |
Colorimetric data |
||
|
Phenolics |
Flavonoids |
TPC |
TFC |
|
|
C1 |
0.0105 |
0.0145 |
0.0109 ± 0.0009 |
0.0176 ± 0.003 |
|
C2 |
0.0127 |
0.0168 |
0.0117 ± 0.0007 |
0.0163 ± 0.0002 |
|
C3 |
0.0105 |
0.0213 |
0.0107 ± 0.0033 |
0.022 ± 0.002 |
|
D1 |
0.0447 |
0.0555 |
0.0485 ± 0.0038 |
0.055 ± 0.004 |
|
D2 |
0.0172 |
0.0259 |
0.0181 ± 0.0010 |
0.0263 ± 0.0025 |
|
D3 |
0.0218 |
0.0273 |
0.0218 ± 0.0010 |
0.0253 ± 0.0020 |
|
F1 |
0.0061 |
0.0105 |
0.0058 ± 0.0004 |
0.0103 ± 0.0004 |
|
F2 |
0.0043 |
0.0078 |
0.0036 ± 0.0003 |
0.007 ± 0.001 |
|
F3 |
0.0034 |
0.0168 |
0.0032 ± 0.0003 |
0.0158 ± 0.0002 |
|
S1 |
0.0366 |
0.0404 |
0.0337 ± 0.0046 |
0.0381 ± 0.0008 |
|
S2 |
0.0083 |
0.015 |
0.0068 ± 0.0004 |
0.0134 ± 0.0005 |
|
S3 |
0.0105 |
0.0177 |
0.0107 ± 0.0004 |
0.0160 ± 0.0007 |
B
3500 3000 2500 2000 1500 1000 500 3500 3000 2500 2000 1500 1000 500
Wavenumber cm-1
3500 3000 2500 2000 1500 1000 500 3500 3000 2500 2000 1500 1000 500
WavenumDer c m-1 Waenumber cm-1
Figure 6 A, B, C Fourier-Transform Infrared Spectroscopy analysis of the germinating soybean seeds treated with abiotic stress along with the control extract of the sample (C-control, D-drought, F-flood and S-salinity)
Table 3. Pearson’s linear correlation coefficient ( ) matrix analysis between FT-I and colorimetric data for total phenolic and flavonoid components of germinating soybean seed under abiotic stress.
|
Variables |
FTI |
Colorimetric data |
|||
|
Phenolics |
Flavonoids |
Phenolics |
Flavonoids |
||
|
FTI |
Phenolics |
1 |
|||
|
Flavonoids |
0.969433049 |
1 |
|||
|
Colorimetric data |
Phenolics |
0.993844241 |
0.977827801 |
1 |
|
|
Flavonoids |
0.961616806 |
0.994163144 |
0.976050407 |
1 |
|
DISCUSSION
In the life of a plant, germination is a crucial stage. A developing seedling must contend with environmental stress, microbial attack, and nutrient depletion. The developing seedling defends itself against biotic and abiotic stress factors by synthesizing phenolic compounds via multiple metabolic pathways in such a hostile environment. Our research reveals the role of phenolic and flavonoid content in abiotic stress in germinating soybean seeds. Under drought, flood, and salinity stress, total phenolic and flavonoid component as well as antioxidant activity of sprouting soybean seeds were assessed for 1, 2, and 3 days. The phenolic and flavonoid content increased during drought and salinity stress, implicating a function in maintaining osmotic potential and avoiding oxidative damage, according to our findings.
The principle of this spectroscopy is based on the vibrations of a molecule energized by infrared radiation at a specific wavelength range (Santos et al. , 2019). It was based on the peak values in the region of I radiation. FTI spectroscopy is confirmed to be the firm and precise method for the detection of bioactive compounds (Muthukumaran et al. , 2017)
According to the findings of this study, the phenolic and flavonoid content of the sprouting soybean seed under drought stress was maximum on the first day. Gharibi et al. (2016) looked into the high positive link between TPC and TFC in drought-stressed Achillea species. Under severe drought stress, A. millefolium had the highest DPPH activity. Genotype KCa-5 exhibited the highest TPC and the largest percentage of DPPH radical scavenging activity in chilli seedlings during drought stress, according to Sahitya et al. (2018), whereas genotype KCa-1 had the lowest TPC and DPPH activity. There was also a strong positive correlation between DPPH activity and total phenolics among these genotypes. TPC, TFC, and DPPH levels in A. tricolour leaves increased considerably with the intensity of drought stress according to Sarker and Oba (2018). TPC and TFC were studied in the fall season of two native shrubs, L. divaricata and L. chilense, by Varela et al. (2016). TPC was higher in L. divaricata leaves than in L. chilense leaves only in autumn, and TFC was higher in L. divaricata leaves than in L. chilense leaves only in autumn, according to the study. These references are relevant to our findings.
In contrast to ZH13, Chen et al . (2013) reported high total phenolic levels in BB52 soybean leaves during salt stress. Mild salt stress enhanced the phenolic content and antioxidant activity of S. mirzayanii leaves, according to Valifard et al. (2014) whereas excessive salinity (9.1dsm-1) lowered both of these parameters. Neves et al. (2010) discovered that raising the concentration of NaCl in soybean roots from 100 to 200 mM enhanced TPC by roughly 50%. Flavonoid production rose when salinity levels increased in Carthamus tinctorius leaves, according to Shaki et al . (2018). Salinity stress increased total phenolic and flavonoid content in germinating soybean seed on the first day in our study, however the increase was less than drought stress.
Increased TPC and TFC demonstrated that they are important in preventing OS damage to cellular structures during dryness. Varela (2016) found the similar results. In the case of salinity, TPC and TFC showed a positive association, which explained their involvement in the plant-salinity interaction. Because of the hydroxyl group present in their structure, TPC and TFC accumulate to prevent oxidative damage and act as a free radical scavenger implying their role in maintaining osmotic potential and avoiding oxidative damage. Chen et al. , (2013), Valifard et al. (2014), Neves et al. (2010), and Shaki et al. (2018) all came to similar conclusions. The positive association of TPC and TFC in the case of drought and salinity, according to Gharibi et al. (2016) may be attributed to the sharing of a same biosynthetic route.
During flood stress, the flavonoid level increased marginally on the third day, but the phenolic content increased dramatically. For the overall phenolic and flavonoid components, there was a good correlation between the FTI and Spectral data. During flooding and drought, the polyphenol content and superoxide anion scavenging percent of sweet potato leaves decreased, according to Lin et al. (2006). Flooding caused a significant increase in TPC and TFC in strong submerged tolerant rice varieties, according to Tan et al. (2016). Under submergence, Banerjee et al. (2015) studied the upregulation of phenolic and flavonoid components in rice. According to Lim et al. (2017) TPC of mature leaves in Macaranga pruinosa was substantially greater during the rainy season.
Our research's main goal is to offer a spoonful of information toward the development of a new stressresistant soybean variety that can endure abiotic stress while also enhancing yield.
CONCLUSION
FTI could be a powerful tool for analyzing secondary metabolites expressions in abiotic stress conditions. According to our findings, phenolics and flavonoids significantly increased under abiotic stress hence exhibiting their role in defense against environmental adverse.
ACKNOWLEDGMENT
We would like to thank the Dr. Babasaheb Ambedkar esearch and Training Institute (BA TI) in Pune for providing financial support through the Babasaheb Ambedkar National esearch Fellowship (BAN F). We'd also like to thank the Indian Institute of Technology, Bombay's (IITB) Sophisticated Analytical Instrument Facility (SAIF) for letting us use their FTI facility.
CONFLICTS OF INTEREST
The authors declare that they have no potential conflicts of interest.
References Differential hikes in phenolic and flavonoid compounds in germinating soybean (glycine max) seeds under abiotic stresses
- Abdel-Moemin, A.R. (2016). Analysis of phenolic acids and anthocyanins of pasta-like product enriched with date kernels (Phoenix dactylifera L.) and purple carrots (Daucus carota L. sp. sativus var atrorubens). Food Measure, 10, 507–519. doi: 10.1007/s11694-016-9329-9
- Achakzai, A.K.K., Achakzai, P., Masood, A., Kalyani S.A., Tareen, R. B. (2009). Response of plant parts and age on the distribution of secondary metabolites on plants found in Quetta. Pakistan Journal of Botany, 41 (5), 2129–2135.
- Ahmed, A.R., Gabr, A.M.M., AL-Sayed, H.M.A., & Smetanska, I. (2012). Effect of drought and salinity stress on total phenolic, flavonoid and flavonol contents and antioxidant activity in in vitro sprout cultures of Garden cress (Lepidium sativum). Journal of Applied Sciences Research, 8 (8), 3934-3942.
- Athar, H.R., & Ashraf, M. (2009). Strategies for crop improvement against salinity and drought stress: an overview. 1st edn. Springer, New York, 44, 1–16.
- Austen, N., Walker, H.J., Lake, J.A., Phoenix G.K., & Cameron D.D. (2019). The regulation of plant secondary metabolism in response to abiotic stress: interaction between heat shock and elevated CO2. Frontiers in Plant Science, 10, 1-12. doi: 10.3389/fpls.2019.01463.
- Baba, S.A., & Malik, S.A. (2015). Determination of total phenolic and flavonoid content, antimicrobial and antioxidant activity of a root extract of Arisaema jacquemontii Blume. Journal of Taibah University for Science; 9, 449–454.
- Banerjee, S., Dey, N., & Adak, M.K. (2015). Assessment of some biomarkers under submergence stress in some rice cultivars varying in responses. American Journal of Plant Sciences, 6, 84-94. doi:10.4236/ajps.2015.61010
- Barnabas, B., Jagner, K., & Feher, A. (2008). The effect of drought and heat stress on reproductive processes in cereals. Plant Cell Environment, 31, 11–38. doi: 10.1111/j.1365-3040.2007.01727.x
- Bej, S., & Basak J. (2014). Micro RNAs: the potential biomarkers in plant stress response. Scientific Research, 5, 748-759. doi: 10.4236/ajps.2014.55089
- Chen, P., Yan, K., Shao, H., & Zhao, S. (2013). Physiological mechanisms for high salt tolerance in wild Soybean (Glycine soja) from yellow river delta, china: photosynthesis, osmotic regulation, ion flux and antioxidant capacity. PLoS ONE, 8(12) doi:10.1371/journal.pone.0083227
- Cheng, Q., Gan, Z., Wang, Y., Lu S., Hou Z., et al., (2020). The Soybean gene J contributes to salt stress tolerance by up regulating salt responsive genes. Frontiers in Plant Science, 11, 1-10. doi: 10.3389/fpls.2020.00272.
- Chung, Y.S., Kim, K.S., Hamayun, M., & Kim Y. (2020). Silicon confers Soybean resistance to salinity stress through regulation of reactive oxygen and reactive nitrogen species. Frontiers in Plant Science, 10, 1-11. doi:10.3389/fpls.2019.01725.
- Deshmukh, R., Sonah, H., Gunvant, P., Chen, W., Prince, S., et al., (2014). Interacting omic approaches for abiotic stress tolerance in Soybean, Frontiers in Plant Science, 5, 1-13. doi: 10.3389/fpls.2014.00244
- Gharibi, S., Ebrahim, B., Ghodratollah S., & Goli S.A.H. (2016). Effect of drought stress on total phenolic, lipid peroxidation, and antioxidant activity of Achillea species. Applied Biochemistry and Biotechnology,178, 796–809. doi: 10.1007/s12010-015-1909-3
- Gimenez, M.J., Valverde, J.M., Valero, D., Guillen, F., Martinez, D., et al., (2014). Quality and antioxidant properties on sweet cherries as affected by preharvest salicylic and acetylsalicylic acids treatments. Food Chemistry, 160, 226–232. doi: 10.1016/j.foodchem.2014.03.107.
- Gupta, B., & Huang, B. (2014). Mechanism of salinity tolerance in plants: physiological, biological, and molecular characterization. International Journal of Genomics, 2014, 1-18. doi:10.1155/20147/701596.
- Hackenberg, M., Gustafson, P., Langridge, P., & Shi, Bu-Jun (2015). Differential expression of microRNAs and other small RNAs in barley between water and drought conditions. Plant Biotechnology Journal, 13, 2-13.
- Hivrale. V., Zheng, Y., Puli, C.O.R., Jagadeeswaran, G., Gowdu, K., et al., (2016). Characterization of drought and heat responsive microRNAs in switchgrass. Plant Science, 242, 214-223. doi: 10.1016/j.plantsci.2015.07.018.
- Hussain F. and Farzana U. (2019). Fungal Biotic stress in plants and its control strategy. Abiotic and biotic stress in plants. (pp 1-7). IntechOpen.
- John, M. K.M., Bhagwat, A. A., & Luthria, D. L. (2017). Swarm motility inhibitory and antioxidant activities of pomegranate peel processed under three drying conditions. Food Chemistry, 235, 145-153. doi:10.1016/j.foodchem.2017.04.143
- Kamtekar, S., Keer V., & Patil V. (2014). Estimation of phenolic content, flavonoid content, antioxidant and alpha amylase inhibitory activity of marketed polyherbal formulation. Journal of Applied Pharmaceutical Science, Vol. 4 (09), 061-065. doi: 10.7324/JAPS.2014.40911
- Khan, F., Siddiqi, T.O., Mahmooduzzafar & Ahmad, A. (2009). Morphological changes and antioxidant defence systems in soybean genotypes as affected by salt in stress. Journal of Plant Interactions, 4, 295-306. doi: 10.1080/17429140903082635.
- Lin, K.H., Chao, P.Y., Yang, C.M., Cheng, W.C., Lo H.F., et al., (2006). The effects of flooding and drought stresses on the antioxidant constituents in sweet potato leaves. Botanical Studies,47, 417-426.
- Lim, T.Y., Lim, Y.Y., & Yule, C.M. (2017). Distributation and characterisation of phenolic compounds in Macaranga pruinosa and associated soils in tropical peat swamp forest. Journal of Tropical Forest Science, 29 (4), 509-518. doi: 10.26525/jtfs20l7.29.4.509518
- Mutava, R.N., Prince, S.J.K., Syed N.H., et al., (2015). Understanding abiotic stress tolerance mechanisms in soybean: a comparative evaluation of soybean response to drought and flooding stress. Plant Physiology and Biochemistry, 86, 109-120. doi: 10.1016/j.plaphy.2014.11.010
- Muthukumaran, P., Kalakandan, S.K, & Ravichandran, K. (2017). Phytochemical screening, GC-MS, FT-IR analysis of methanolic extract of Curcuma caesia Roxb (Black Turmeric). Pharmacognosy Journal, 9(6), 952-956.
- Neves G. Y. S., Marchiosi, R., Ferrarese, M. L. L., Siqueira-Soares R. C., et al., (2010). Root growth inhibition and lignification induced by salt stress in Soybean. Journal of Agronomy & Crop Science, 196, 467-473. doi:10.1111/j.1439-037X.2010.00432.
- Pires, H.R.A., Franco, A.C., Piedade, M.T.F., Scudeller, V.V., Kruijt B., et al., (2018). Flood tolerance in two tree species that inhabit both the Amazonian floodplain and dry Cerrado savanna of Brazil. AoB PLANTS, 10, 1-15. doi: 10.1093/aobpla/ply065.
- Sahitya, U.L., Krishna, M.S.R., Sri Deepthi, R., Prasad, G.S., & Kasim, D.P. (2018). Seed antioxidants interplay with drought stress tolerance indices in Chilli (Capsicum annuumL) seedlings. BioMed Research International,1-14. doi.org/10.1155/2018/1605096
- Santos, D.I., Correia, M.J.N., Mateus, M.M., Saraiva, J.A., Vicente, A.A. et al., (2019). Fourier transform infrared (FT-IR) spectroscopy as a possible rapid tool to evaluate abiotic stress effects on pineapple by-products. Applied Sciences, 9, 1-11. doi:10.3390/app9194141.
- Sarker, U., & Oba, S. (2018). Drought stress enhances nutritional and bioactive compounds, phenolic acids and antioxidant capacity of Amaranthus leafy vegetable. BMC Plant Biology, 18, 258. doi:10.1186/s12870-018-1484-1
- Shah, A. & Smith, D.L. (2020). Flavonoid in agriculture: chemistry and roles in, biotic and abiotic stress responses and microbial associations. Agronomy, 10, 1-26. doi:10.3390/agronomy10081209.
- Shaki, F., Maboud, H.E., & Niknam, V. (2018). Growth enhancement and salt tolerance of Safflower (Carthamustinctorius L.), by salicylic acid. Current Plant Biology, 13, 16-22. doi.org/10.1016/j.cpb.2018.04.001
- Swigonska, S., Amarowicz, R., Krol, A., Mostek, A., Badowiec A., et al., (2014). Influence of abiotic stress during soybean germination followed by recovery on the phenolic compounds of radicles and their antioxidant capacity. Acta Societatis BotanicorumPoloniae, 83(3), 209–218. doi: 10.5586/asbp.2014.026
- Tan Khang, D., Pham Thi, Thu Ha., Nguyen Thi, Lang., Tuyen, Phung Thi., Minh, Luong The., et al., (2016). Involvement of phenolic compounds in anaerobic flooding germination of rice (Oryza sativa L.). International Letters of Natural Sciences, 56, 73-81. doi:10.18052/www.scipress.com/ILNS.56.73
- Todayoshi, M., & Goldsmith D. (2009). World Soybean production : area harvested, yield and long term projections, International Food and Agribusiness Management Review, Vol 12(4), 143-162.
- Valifard M., Mobsenzadeh S., Kholdebarin B., & Rowshan V. (2014). Effect of salt stress on volatile compounds, total phenolic content and antioxidant activities of Salvia mirzayanii. South African Journal of Botany, 93, 92-97. doi: org/10.1016/j.sajb.2014.04.002
- Varela M. C., Arslan, I., Reginato, M.A., Cenzano, A.M., & Luna, M.V. (2016). Phenolic compounds as indicators of drought resistance in shrubs from Patagonian shrublands (Argentina). Plant Physiology and Biochemistry, 104, 81-91. doi: 10.1016/j.plaphy.2016.03.014 .
- Waqas, M.A., Kaya, C., Riaz, A., Farooq, M., Nawaz, I., et al., (2019). Potential mechanism of abiotic stress tolerance in crop plants induced by thiourea. Frontiers in Plant Science, 10, 1-14. Doi:10.3389/fpls.2019. 01336.
- Wu, C., Chen, P., Hummer. W., Zeng, A., & Klepadlo, M. (2017). Effect of flood stress on Soybean seed germination in the field. American Journal of Plant Sciences, 8, 53-68. doi.org/10.4236/ajps.2017.81005 .
- Xu Y., Freund D.M., Hegeman A.D., & Cohen J.D. (2022). Metabolic signatures of Arabidopsis thaliana abiotic stress responses elucidate patterns in stress priming, acclimation and recovery. Stress Biology, 1-16. doi:10.1007/s44154-022-00034-5.
- Zandalinas, S I, Mittler, R., Balfagón, D., et al., (2018). Plant adaptations to the combination of drought and high temperatures. Physiologia Plantarum,162, 2–12. doi:10.1111/ppl.12540.
- Zandalinas, S.I., Balfagon, D., Gomez-Cadenas, A., & Mittler, R. (2022). Plant responses to climate change: metabolic changes under combined abiotic stresses. Journal of Experimental Biology, 73 (11), 3339-3354. doi:10.1093/jxb/erac073.
- Zhou, L., Liu, Y., Liu, Z., Kong, D., Duan, M., et al., (2010). Genome wide identification and analysis of drought responsive microRNAs in Oryza sativa. Journal of Experimental Botany, 61(15), 4157-4168. doi: 10.1093/jxb/erq237.
