Digital Image Texture Classification and Detection Using Radon Transform

Author: Satyabrata Sahu, Santosh Kumar Nanda, Tanushree Mohapatra
Journal: International Journal of Image, Graphics and Signal Processing(IJIGSP) @ijigsp
Article in issue: 12 vol.5, 2013.
Free access
A novel and different approach for detecting texture orientation by computer was presented in this research work. Many complex real time problem example detection of size and shape of cancer cell, classification of brain image signal, classification of broken bone structure, detection and classification of remote sensing images, identification of foreign particle in universe, detection of material failure in construction design, detection and classification of textures in particularly fabrications etc where edge detection and both vertical and horizontal line detection are essential. Thus researches need to develop different algorithm for this above complex problem. It is seen from literature that conventional algorithm DCT, FFT are all highly computational load and hence impossible task to implemented in hardware. These difficulties were solved in this particular research work by applying DWT and radon transform. It was seen from the simulation result that with very high computational load the entire algorithm takes very less CPU time and proved its robustness.
Edge detection, Fast Fourier Transform, Discrete Wavelet Transform, Radon Transform
Short address: https://sciup.org/15013150
IDR: 15013150
Text of the scientific article Digital Image Texture Classification and Detection Using Radon Transform
Image segmentation refers to partitioning of an image into different regions that are homogeneous or “similar” in some image characteristics. It is usually the first task of any image analysis process module. All subsequent tasks such as edge detection, feature extraction and object recognition rely greatly on the quality of the segmentation. Without a good segmentation algorithm, an object may never be recognizable . In most computer vision applications, the edge/boundary detection constitute a crucial initial step before performing high level tasks such as object recognition and scene interpretation. Using these properties, images can be analyzed for use in several applications including video surveillance, image retrieval, medical imaging analysis, and object classification. Edge detection is a very important area in processing and transmission, along with the rational commercial model and industry strategy.
The field of Computer Vision. Edges define the boundaries between regions in an image, which helps with segmentation and object recognition. They can show where shadows fall in an image or any other distinct change in the intensity of an image. Edge detection is a fundamental of low-level image processing and good edges are necessary for higher level processing.
Edge detection is a essential tool used in most image processing applications to obtain information from the frames as a precursor step to feature extraction and object segmentation. This process detects outlines of an object and boundaries between objects and the background in the image. An edge-detection filter can also be used to progress the appearance of blurred image. One of the most important applications is edge detection for image segmentation. Edge detection refers to the process of identifying and locating sharp discontinuities in an image. These discontinuities are due to quick changes in pixel intensity which characterizes boundaries of objects in a scene. Edges give boundaries between different regions in the image. These boundaries are used to identify objects for segmentation and matching purpose .These object boundaries are the first step in many of computer vision algorithms like edge based face recognition, edge based obstacle detection, edge based target recognition, image compression etc. So the edge detectors are required for extracting the edges. There are many edge detection operators available .These operators identifying vertical, horizontal, corner and step edges. The quality of edges detected by these operators is highly dependent on noise, lighting conditions, objects of same intensities and the density of edges in the scene. These problems can be solved by adjusting various parameters in the edge detector and changing the values of threshold for what an edge is considered. No method has been proposed for self-adapting these values. These operators are very sensitive to noise and edges that contain high frequency contents. So removal of noise is required that may result in blurred and distorted edges. A wide range of operators are available that can extract the edges from noisy image. But these edges are less accurate. That is due to the presence of noise they extract false edges. They do not find the boundaries of object having small change in intensities values. That result in poor localization of edges. So the operator is required that identify such a gradual change in intensities. So there are problems of false edge detection, problem due to noise, missing of low contrast boundaries, high computational time etc.
The remainder of the paper is organized as follows. In section II, a review of the necessary background required to effectively implement our algorithm is presented. The proposed algorithm is described in Section III. After that, application of the proposed algorithm is discussed in section IV, and we draw our conclusion in the last section.
-
II. BACKGROUND
In most computer vision applications, the edge/boundary detection and image segmentation constitute a decisive initial step before performing high level tasks such as object recognition and scene interpretation. The separation of the image into object and background is a critical step in image interpretation. When we imitate the human visual system by using computer algorithms, quite a lot of problems can be encountered. Segmentation subdivides an image into its constituent regions or objects. The level to which the subdivision is carried depends on the problem being solved. That is, segmentation should stop when the objects of interest in an application have been isolated [38, 39].Color image segmentation is usually the first task of any image analysis process. All subsequent tasks such as edge detection, feature extraction and object recognition rely heavily on the quality of the segmentation. Without a good segmentation algorithm, an object may never be recognizable.
A. Edge Detection Methods
Edge is part of an image that contains significant variation. The edges provide important visual information image intensity is often proportional to scene radiance, physical edges are represented by changes in the intensity function of an image .The most common edge types are steps, lines and junctions. Edge detection process detects outlines of an object and boundaries between objects and the background in the image.
B. Classical Methods
Classical edge detectors have no smoothing filter, based on a discrete differential operator. The Sobel operator is the most known among the classical methods. The Sobel edge detector applies 2D spatial gradient convolution operation on an image. Popular works in this category include the algorithms developed by Sobel, Prewitt, Kirsch, Robinson, and Frei-Chen.
C. Nonlinear Methods
These methods includes edge-detectors that leave the linear territory in search of better performance. Nonlinear methods based on the Gaussian filter and images convolved with Gaussian filter for a smoothing purpose. Perona [20] proposed a scale space representation of an image based on anisotropic diffusion. This is achieved by making the diffusion coefficient in the heat equation a function of space and scale.
D. Statistical Methods
Konishi [6] formulated the edge detection as a statistical inference in his research work. This statistical edge detection is data driven. He gave conclusion that edge detection is formulated as a discrimination task specified by a likelihood ratio test on the filter responses.
Bezdek et al. [7] described edge detection as a composition of four steps: conditioning, feature extraction, blending, and scaling. They found that understanding the geometry of the feature extraction and blending functions is the key to using models based on computational learning algorithms such as neural networks and fuzzy systems for edge detection.
Santis [8] proposed a statistical edge detection algorithm using a linear stochastic signal model derived from a physical image description. The advantage of this method is that it exploits the estimated local signal characteristics and does not require any overall thresholding procedure.
E. Line Edge Detectors
As mentioned earlier, line edges correspond to local maxima of intensity function in the image and are of great use in the identification of image features, such as roads and rivers in remote sensing images, as well as the contactless paper counting. Most of line edge detectors are limited to thinning algorithms, and designed for binary images and a few for grey images. The main problem is that they usually yield edges which are not located accurately enough and they do not perform well in complex images such as remote sensing images. Haralick [21] proposed an algorithm based on polynomial fitting. The image was fitted by a linear combination of discrete bases of Tchebychev's polynomial of order less than or equal to three. Lines occur at pixels having zero-crossings of the first directional derivative taken in the direction that maximizes the second directional derivative. Giraudon [22] proposed an algorithm for detecting a line at a negative local maximum of the second derivative of the image, rather than a zero-crossing of the first derivative. He estimated the second derivative by convolving the image with the difference of two Gaussians having close scales. The search for a negative maximum is performed along the gradient direction. The main problem with Giraudon's detector [22] comes from the use of the gradient since at the peak point, the gradient value is too small to be used. Using a 1D ideal roof model and Canny's criteria, Ziou [23] derived an optimal line detector. Koundinya and Chanda [24] proposed an algorithm based on combinatorial search. The basic idea behind this algorithm is to locate lines that maximize an ad-hoc confidence measure. The confidence measure of a candidate pixel is proportional to the number of pixels in its vicinity having a different grey intensity than the candidate pixel. They examined three strategies for combinatorial search: conventional tracking, best-first, and depth-first. According to the results, the best-first strategy seemed to provide more complete edges.
F. Multi Resolution Methods
Multi-resolution methods based on repeating edge detection for several scales of the Gaussian filter to achieve a quality performance. Schunck [11] proposed an algorithm for the detection of step edges using Gaussian filters at multiple scales. But loses a lot of important details which may exist at smaller scales [2]. Witkin [12] proposed the study of edge detection as a function of scale, and led to algorithms that combine edges for better edge detection. Bergholm [13] proposed an algorithm which uses the Gaussian filter and combines edge information moving from a coarse-to-fine scale, called edge focusing, To avoid blurring process is to start with edges detected at the coarse scale and gradually track or focus these edges back to their original locations in the fine scale [2]. Lacroix [14] proposed scheme to avoid the problem of splitting edges is by tracking edges from a fine-to-coarse resolution. Only validated edges are then tracked through the scales. It avoids the problem of splitting edges, but introduces the problem of localization error as it is the coarsest resolution that is used to determine the location of edges. Williams and Shah [15] proposed a scheme to find edge contours using multiple scales. It specifies the number of scales to be used and the relationship between these scales, but not the best way to choose the value of σ and under what conditions [2]. Goshtasby [16] proposes an algorithm that works on a modified scale-space Representation of an image. The major problem is the need for a considerable amount memory to store the three-dimensional (3D) edge images [2]. Jeong [17] proposed a scheme that automatically determines the optimal scales for each pixel before detecting the final edge map. It does result in reduced performance when it comes to detecting straight lines in vertical or horizontal directions and also Cloud Computing is so named because the information being accessed is found in the “Clouds”, and does not requires a user to be in a specific place to gain access to it. Companies may find that has the disadvantage of lowspeed performance [2]. Deng [18] proposed an adaptive Gaussian filtering algorithm for edge detection. The major drawback is that it assumes the noise is Gaussian with known variance. In practical situations, however, the noise variance has to be estimated, but it is very computationally intensive [2]. Bennamoun [19] determined the optimal scale and threshold, of the hybrid detector, by deriving a cost function which maximizes the probability of detecting an edge for a signal and simultaneously minimizes the probability of detecting an edge in noise [2].
G. Gussian Based methods
Gaussian-based edge detectors are developed based on some physiological observations and important properties of the Gaussian function that enable to perform edge analysis in the scale space. Marr [9] proposed an edge detector based on Gaussian filter, by using Laplacian of Gaussian (LOG) function as filter. LOG is an orientation-independent filter that breaks down at corners, curves, and at locations where image intensity function varies in a nonlinear manner along an edge. There are advantages in its output.
Yuille [10] proved that with the Laplacian, the Gaussian function is the only filter in a wide category that does not create zero-crossings as the scale increases. Canny [3] proposed a scheme for combining the outputs from different scales. Canny’s edge detection causes the algorithm to be slightly more sensitive to weak edges, but more susceptible to spurious and unstable boundaries wherever there is an insignificant change in intensity [2].
H. Coloured edges methods
Koschan [25] proposed a scheme based on review of techniques for the detection and classification of edges in colour images. The techniques used for this can be subdivided on the basis of their principle procedures into two classes: monochromatic-based techniques and vector-valued techniques.
I. Wavelet Based methods
As it was mentioned, analysing an image at different scales increases the accuracy and reliability of edge detection. Focusing on localized signal structures, e.g., edges, with a zooming procedure enables simultaneous analysis from a rough to a fine shape. Progressing between scales also simplifies the discrimination of edges versus textures. Because of having this ability, wavelet transform is an advantageous option for edge detection in different applications. Wavelet-based multi-resolution expansions provide compact representations of images with regions of low contrast separated by high-contrast edges. Additionally, the use of wavelets provides a way to estimate contrast value for edges on a space-varying basis in a local or global manner as needed.
In the context of image processing, wavelet transform (WT) is defined as the sum over the entire of rows and columns (i.e. spatial domain) of the image intensity function multiplied by scaled and shifted versions of the mother wavelet function. It results in coefficients that are function of the scale and shifts. In other word, WT maps the image into a space with two variables: scale and shift. The scale represents the function by compressing or stretching it, and denotes its features in frequency domain, while the shift corresponds to the translation of the wavelet function in the spatial domain (i.e. row or column). There is a correspondence between scale and frequency: a low scale shows the rapidly changing details of the intensity function with a high frequency, and a high scale illustrates slowly changing coarse features, with a low frequency. Therefore, WT acts as a mathematical microscope ‖, in which one can monitor different parts of an image by just adjusting focus on scale. An important property of WT is its ability to focus on localized structures, e.g. edges, with a zooming procedure that progressively reduces the scale parameter. In this way, coarse and fine signal structures are simultaneously analysed at different scales.
Heric and Zazula [40] presented an edge detection algorithm using Haar wavelet transform. They chose Haar wavelet as the mother wavelet function, because it was orthogonal, compact and without spatial shifting in the transform space. By applying WT, they presented the intensity magnitude variation between adjacent intervals on a time-scale plane. Positive or negative peaks in time-scale representations were called modulus maxima. Their values indicated the edge slope and width. A significant difference within a short interval was presented as large maximum value. They linked the marked maxima over the time-scale plane and then applied an adaptive threshold for each scale to detect the edge maxima lines. The position of modulus maximum at the lowest detected scale determines the edge position.
Furthermore, Heric and Zazula [40] centred on edge continuity by deploying a priori knowledge about edges and applying computational models rather than a local detector. They proposed edge linkage into a contour line with signal registration in order to close edge discontinuities and calculate a confidence index for contour linkages. Registration is a procedure of searching spatial transformation from a source image into a target image with the intention to find best alignment between the two images. The success of alignment depends on a similarity measure which measures locally or globally the degree of similarity between source and target images. They expected two row or column pixels taken from adjacent image rows or columns are very similar. If an edge influences one of them it probably does the same in the other one, and vice versa. When trying to register such two pixels, a low amount of change (adjustment) is expected. If the opposite happens, the registered pixels apparently reflect different characteristics, for example, it is not likely that they contain linked pieces of the same edge. They used the sum of squared differences (SSD) as a measure for uniformity.
Shih and Tseng [41] combined a gradient-based edge detection and a wavelet based multi-scale edge tracking to extract edges. The proposed contextual filter detects edges from the finest scale gradient images and then, the edge tracker refines the detected edges on the multi-scale gradient images.
From Literature Review it is found that wavelet application is already applied in many images like segmentation, edge detection, compression in multiscale images, however DWT application is very less in particularly mulltiscale edge detection.
One of the major disadvantages of the Fourier transform is the lack of localization in what the Fourier transform considers phenomena in an infinite interval. Basically, it decomposes a signal in plane waves, which oscillates infinitely with the same period and these waves do not have local characteristics. Another major flaw in the Fourier analysis is the separate description and representation of time and frequency.
The wavelet transform is quite similar to the Short Time Fourier Transform (STFT) except the window is not fixed as in STFT. The wavelet transform is more flexible and it can be any chosen function, can be shifted and dilated to analyze signals. Wavelets can be interpreted as small waves abstractly expressed in a zero mean value. The wavelet transform map a time function into a two dimensional function of a and b. The parameter a is called the scale and it scales a function by compressing or stretching it. The parameter b is called the translation of the wavelet function along the time axis.
A wavelet function ψ(t), can be written as
Where a is the scaling factor, b the translation along the axis and -4г is a normalized factor.
-
III. DWT EDGE DETECTION
Significant intensity changes in an image normally occur at different spatial resolution or scales. Conventional edge detectors select a special spatial mask that detects edges at a particular resolution. A small mask edge detector is susceptible to noise and produces spurious edges. In contrast, to that a large mask edge detector is relatively robust to noise, but distorts the edges and may not detect some finer details. Thus it is very difficult to detect edges with a single spatial edge mask.
The edge preserved de-noising lends itself to a wavelet-based procedure for edge detection. The edge in a signal gives rise to peaks in the high pass filter outputs or the detail sub-bands at concordant locations. This is a characteristic of the DWT. In other words, edges give rise to peaks across several levels of details at coordinate values that moves to the left by a factor of one half at every transition from a finer scale to a coarser scale. The stronger the edge, the higher are the peaks in the DWT. Consequently, an edge can be found from the wavelet transform by identifying peaks at concordant locations.
The wavelet transform of f(x) at the scale s and position x, computed with respect to the wavelet (x) is defined by
The wavelet transform with respect to

(x) is
Therefore we derive that
^/(x) = ^(/*0.)(x)
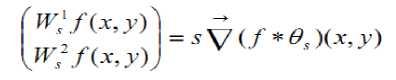
ах w'/w^^u^e^
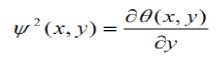
The wavelet transforms and are, respectively, the first and second order derivatives of the signal smoothed at the scale s. The 2-D smoothing function is defined as any function whose integral over x and y is equal to 1 and converges to 0 at infinity. The image f(x, y) is smoothed at different scales s by a convolution with . The gradient vector computed is given by .Edges are defined as points where the modulus of the gradient vector is maximum in the direction towards gradient vector points in the image plane.
We define the two wavelet functions as which the
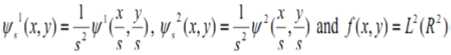
Therefore the wavelet transform are as defined as
above are
W^f^^f*^^,^
Therefore we prove that
Hence the edge points can be located from the components and of the wavelet transform is to help users to create a community for managing contents located inside or outside their local networks.
It is perceived that the wavelet transform is an important tool for analysis and processing of non-stationary signals. The wavelet transform in its continuous form can accurately represent minor variations in signal characteristics, but it is data intensive. Critically sampled version of continuous wavelet transform, known as standard DWT, is very popular for de-noising and compression in a number of applications.
Its computational simplicity through fast filter-bank algorithms, and non-redundancy though there are certain signal processing applications e.g. Edge detection where achieved through radon transform.
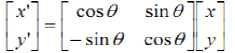
The radon transform is projections of an image matrix along specified directions [10]. The Radon Transformation is a fundamental tool which is used in various applications such as radar imaging, geophysical imaging, non-destructive testing and medical imaging [32].A projection of a two-dimensional function f(x,y) is a set of line integrals [31]. The radon transform computes the line integrals from multiple sources along parallel paths, or beams, in a certain direction. The beams are spaced 1 pixel unit apart .t o represent an image, the radon transform takes multiple, parallel-beam projections of the image from different angles by rotating the source around the centre of the image. Projections can be computed along any angle. The 2-D radon transform is the integral transform that computes the integral of a function along straight lines. Every straight line can be represented as
(X(t), Y(t))=t(sina,-cosa) +s (cosa,sina) (11)
Where s is the singed distance from the origin to the line and α is the angle between the normal of the line and x-axis.
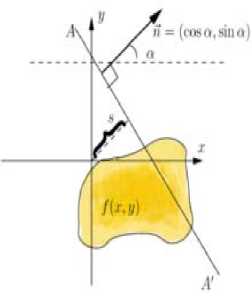
Figure:1
Radon transform of a function(x,y)on the plane is defined by
R (f) (a, s)
^Jix >■ Y t
Where The Radon transform is a special case of image projection operations [33]. It has found wide applications in many areas such as tomographic reconstruction. It has also been applied to many computer vision areas, such as image segmentation, structural extraction by projections, determining the orientation of an object, recognition of Arabic characters [34] and 1-D processing,filtering and restoration of images [35], [36]. Al-Shaykh and Doherty [39] used the Radon transform for invariant image analysis. By combing the Radon transform and singular value de-composition (SVD), they developed an efficient invariant analysis method. In this work, we have four major reasons to adopt the Radon transform. First, as in [37], the Radon-pixel image brings a large advantage to achieving global geo-metric affine invariance. This is because the Radon-pixel image has more geometric information than the original pixel image. It can be seen that one Radon-pixel corresponds to a line segment which needs two pixels in the original image to describe. Second, a single Radon-pixel contains the information of a line segment in the original image. This property makes Radon-pixels more robust to image noise and it also fits our motivation of using global features to describe textures. Third, the dimension of Radon-pixel representation is much lower than that of the original image. For an n -pixel image, the number of Radon-pixels is about O( . Finally, the Radon transform is invertible. In principle, the original image can be roughly recovered from its Radon-pixel image. The invertibility is the chief characteristic that distinguishes the Radon transform from other transformations such as SIFT. In summary, the Radon transform converts a pixel represented image into an equivalent, lower dimensional and more geometrically informative Radon-pixel image, which is a good basis of defining invariant features.
-
IV. SIMULATION AND RESULTS
In this research work the entire simulation was done using matlab 2012 simulation environment and matlab image processing toolbox. The database selected in this work contains 6 multiple texture classes. All the textures are taken in the format graphics interchange format represents the entire database contains all types of multiple textures. The entire simulation contains many steps including initialization, data acquisition, classification and pixel orientation etc. The primary step of simulation is discussed first.
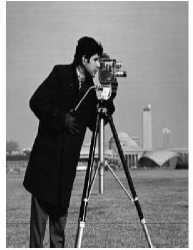
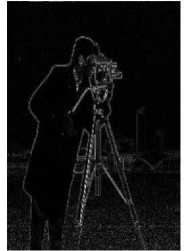
Figure:2
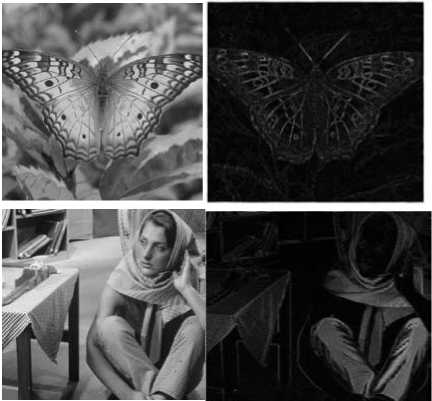
Figure:3
Hence we conclude that FFT is not good for detection of edges in multi-scale images. Now we will apply another method that is discrete wavelet transform for detection of edges in multi-scale images.
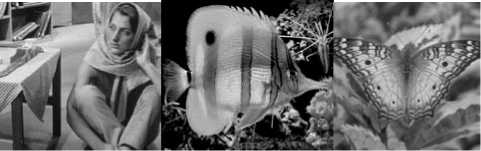
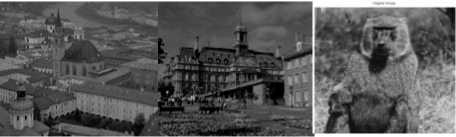
Figure:4
According to figure (4) 6 different multiple textures selected for texture analysis. All the specimens were made gray scale images 512x512 pixels. Matlab functions were employed to serve some special actions detecting texture shapes. To determine texture shapes the image should be passing through a edge detection filter to finding its edge. In This research work wavelet approach is followed to finding the edge of an image particularly. It is found from literature that wavelet application is better choice for multi-scale image detection as compared conventional edge detection filter.
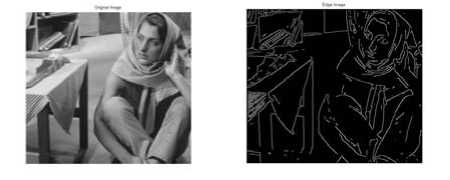
The Imread() function was used to open graphic file of almost any format and read the intensity of pixels as two dimensional array (M by N array) or a three dimensional (M x N x 3 array) in current work space. After initialization of image the image are examined by the wavelet edge detection algorithm and edges are found.
(a) (b)
(c) (d)
(e) (f)
Figure:5
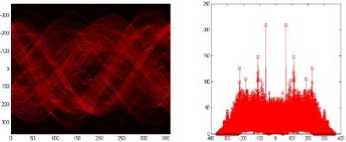
Fig 5. represents analysis of a women image of pixel of (512 x 512) figure 5 (a) represents its original image and figure 5 (b) represent figure women image using wavelet algorithm. From the edges it was found that many horizontal and vertical lines not detected. To minimize this complexity radon transform was used to detect the non visible texture. Figure5 (c) represents the texture classification using radon transformation. In transformation plot the location of each bright spot will correspond to one or many strong line in the original image. If this strong peaks in radon transform matrix were found then orientation of texture would be clear.
Figure 5 (d) represents all the projection of radon transform represented in a linear scale. It was found that the strong horizontal and vertical lines with its appropriate values. For more clarity if we plot the maximum value of absolute value radon transform then it is given the clarity of texture orientation in a 2D figure. Figure 5 (e) represents the entire progression of the radon transform in a 2D scale. Furthermore to compare the radon projection value historical analysis also done and it is found that the lines are detected correctly of the original image. It is conclude that some weak texture, texture-less species and strong texture are classified and detected.
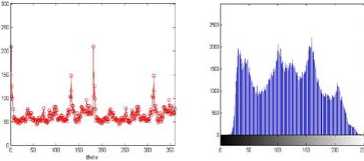
According to Figure (6) there was four numbers of peaks were found, out of them a peak whose intensity is very large at direction of 1850, which showed texture of the woman image has a more definite orientation , where in monkey image no texture were found and also it is proved from its histogram analysis.
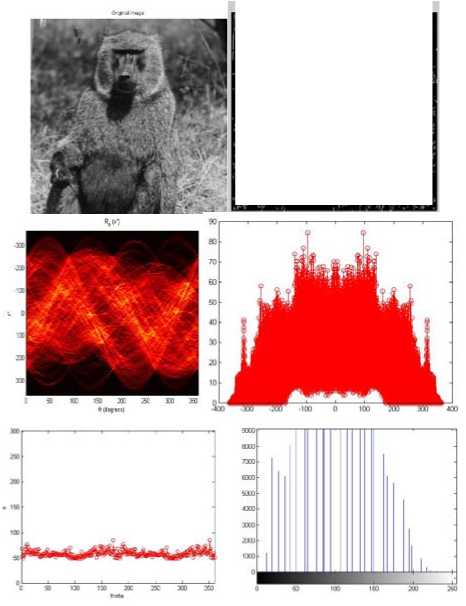
Figure:6
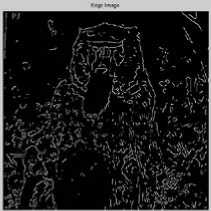
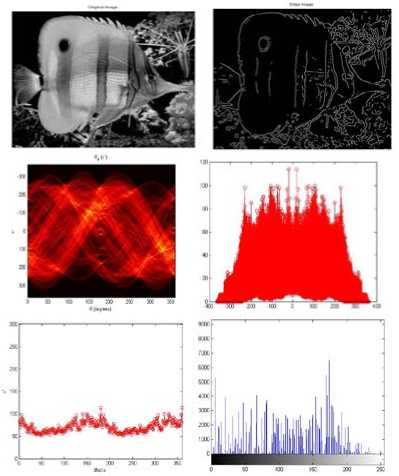
Figure:7
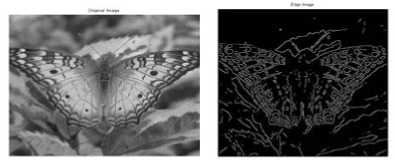
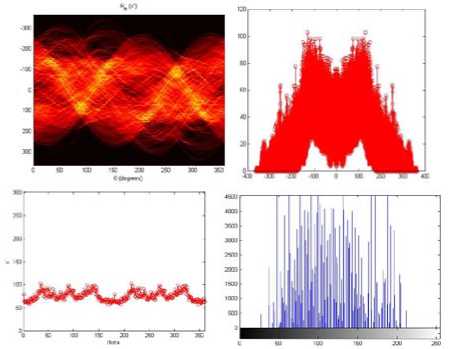
Figure:8
At the same time there are peaks found near 1450 and 1750 though not strong as shown figure aquarium Figure(7) and figure butterfly Figure (8). Which showed there might be some texture trends along this two direction and can be verified by tangential selection images from above selected images. In that same image from angle 0 to 140 and 200- 250 showed that the texture is weak or texture less as because there was any strong peak find in the plot ranged angle.
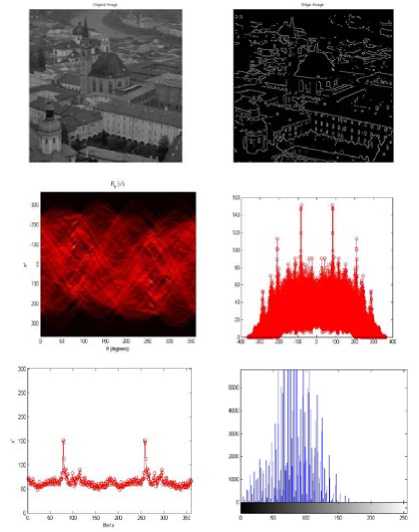
Figure:9
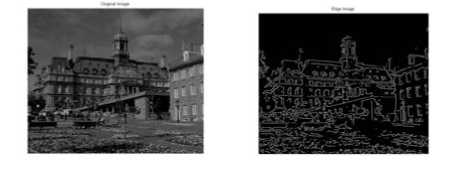
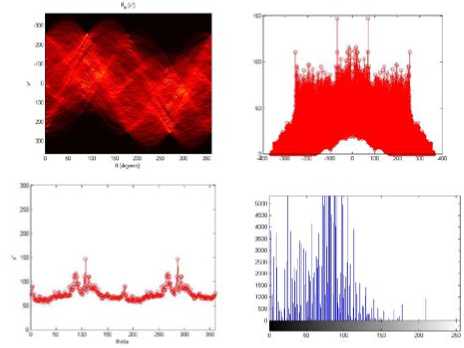
Figure:10
-
V. FUTURE WORK AND CONCLUSION
In this research work it is clearly explained how to obtain edges of different scale, how to detect multi-scale edge of an image.
From the simulation result it is found that the texture orientation of all the selected images could be auto detected by computer by only several matlab functions. Initial Discrete wavelet algorithm is used to detect texture shape and texture line image and found that with less computational load it successfully extract texture skeletal lines from original image. By radon transform it generate signature composed of 360 values ,each value summing of size of texture line that are shape along that angle and by searching out maximum values of each angle column. by taking entire maximum value texture orientation was produced in linear scale .
References Digital Image Texture Classification and Detection Using Radon Transform
- W. K. Pratt. Digital image processing, Wiley-Interscience, 2nd edition, 1991.
- Mitra,Basu, Gaussian-Based Edge-Detection Methods A Survey ,IEEE Transactions On Systems, Man, And Cybernetics—Part C: Applications And Reviews, Vol. 32, No.3, August 2002, pp. 252-260.
- J. Canny, A Computational Approach to Edge Detection, IEEE Transaction on Pattern Analysis and Machine intelligence, No. 6, pp. 679-698, 1986.
- D.Heric et.al, Combined edge detection using wavelet transform and signal registration, Elsevier Journal of Image and Vision Computing 25 (2007) 652–662.
- M.Y. Shih et.al, Wavelet based multi resolution edge detection and tracking, Elsevier Journal of Image and Vision Computing 23 (2005) 441–451.
- S.Konishi et.al, Statistical Edge Detection: Learning and Evaluating Edge Cues, IEEE Transactions On Pattern Analysis And Machine Intelligence, Vol. 25, No. 1, pp 57- 74, 2003.
- J. C. Bezdek,et.al., A Geometric Approach to Edge Detection, IEEE Transactions On Fuzzy Systems, Vol. 6, No. 1, pp 52-75,1998.
- A. D. Santiset.al, A Bayesian Approach to Edge Detection in Noisy Images, IEEE transactions On Circuits And Systems I: Fundamental Theory And Applications, Vol. 46, No. 6, pp 686-699, 1999 .
- D.Marr et.al, Theory of edge detection‖, Proc. Royal Society of London, B, 1980, 207, pp. 187–217.
- A.L.Yuille et.al, Scaling theorems for zero-crossings, IEEE Transactions On Pattern analysis And Machine Intelligence vol. PAMI-8, pp. 15–25, Jan. 1986.
- B.G. Schunck, Edge detection with Gaussian filters at multiple scales, in Proc. IEEE Comp. Soc.Work. Comp. Vis., 1987, pp. 208–210.
- A.P.Witkin, Scale-space filtering, in Proc. Int. Joint. Conf. Artificial Intelligence, vol. 2, 1983, pp. 1019–1022.
- F.Bergholm, Edge focusing, IEEE Transactions On Pattern Analysis And Machine intelligence‖, vol. PAMI-9, pp. 726–741, June 1987.
- V.Lacroix, The primary raster: A multi-resolution image description in Proc. 10th Int. Conf. Pattern Recognition, 1990,pp. 903–907. ISSN: 2
- D.J. Williams et.al. , Edge contours using multiple scales, Comput. Vis. Graph Image Process. vol. 51, pp. 256–274, 1990.
- A.Goshtasby, On edge focusing‖, Image Vis. Comput, vol. 12, pp. 247–256, 1994.
- H. Jeong et.al, Adaptive determination of filter scales for edge-detection, IEEE Transactions on Pattern Analysis and Machine Intelligence, vol. 14, pp. 579–585, May 1992.
- G.Deng et.al, An adaptive Gaussian filter for noise reduction and edge detection, in Proc. IEEE Nucl. Sci. Symp.Med. Im. Conf., 1994, pp. 1615–1619.
- M.Bennamount et.al, Optimal parameters for edge detection, in Proc.IEEE Int. Conf. SMC, vol. 2, 1995, pp. 1482–1488.
- P.Perona et.al. Scale-space and edge detection using anisotropic diffusion, IEEE Trans. Pattern Anal. Machine Intell. vol. 12, pp. 629–639, July 1990.
- R.M. Haralick. Ridge and Valley on Digital Images. Computer Vision, Graphics and Image Processing, 22, 28-38, 1983.
- G.Giraudon. Edge Detection from Local Negative Maximum of Second Derivative. In Proceedings of IEEE, International Conference on Computer Vision and Pattern Recognition, 643-645, 1985.
- D. Ziou. Line Detection Using an Optimal IIR Filter. Pattern Recognition, 24(6), 465- 478, 1991.
- K. Koundinya and B.Chanda.Detecting Lines in Gray Level Images Using Search Techniques. Signal Processing, 37, 287-299, 1994.
- A. Koschan et.al. Detection and Classification of Edge sin Color Images, IEEE Signal.
- Robi Polikar, ‘The Story of Wavelets’, In physics and Modern topics in Mechanical and Electrical Engineering (ed. N Mastorakis), 192-197, World Scientific and Eng. Society Press.
- R R Coifman and D L Donoho, ‘Translation Invariant De-noising’, in A Antoniadis (editor): Wavelets and Statistics, Springer Verlag, 1995.
- I Cohen, S Raz, and D Malah, ‘Shift-invariant Wavelet Packet Bases’, Proc. ICASSP-95,Detroit, MI, 1081-1084, 1995.
- M C Morrone, and D C Burr, ‘Feature Detection in Human Vision: A Phase Dependent Energy Model’, Proc. R. Soc. Lond., B 235, 221, 1988.
- A V Oppenheim, and J S Lim, ‘The Importance of Phase in Signals’, Proc. IEEE, 69, 529-541, 1981.
- G P Lorenzetto, and P Kovesi, ‘A Phase Based Image Comparison Technique’,DICTA99, University of Western Australia, 1999.
- J Driesen, and R Belmans, ‘Time-Frequency Analysis in Power Measurement Using Complex Wavelets’, IEEE Int. Sympo. on Cir. and Sys. (ISCAS2002), 681-684, 2002.
- Asano,A. “Radon transformation and projection theorem”, topic 5, lecture notes of subject pattern information processing, 2002 autumn semester.
- Kupce, E., Freeman, R., “The Radon Transform: A New Scheme for Fast Multidimensional NMR”, Concepts in Magnetic Resonance, Wiley Periodicals, Vol. 22,pp. 4-11, 2004.
- J.Radon, The Radon Transform and Some of Its Applications (“trans-lation of radon’s 1917 paper”), 1983.
- H. Al-Yousefi and S. S. Udpa, “Recognition of arabic characters,” IEEE Trans. Pattern Anal. Mach. Intell: vol. 14, no. 8, pp. 853–857, Aug.1992.
- A. K. Jain, Fundamentals of Digital Image Processing. Upper Saddle River, NJ: Prentice- Hall, 1989.
- J. L. C. Sanz, E. B. Hinkle, and A. K. Jain, Radon and Projection Trans-form-Based Computer Vision: Algorithms, a Pipeline Architecture, and Industrial Applications.New York: Springer-Verlag, 1988.
- O.Al-Shaykh and J.Doherty,“Invariant image analysis based on radon transform and svd,” IEEE Trans. Circuits Syst. II, Analog Digit. Signal Process. ,vol. 43, no. 2, pp. 123– 133, 1996.
- Rafael C. Gonzalex, Richard E. Woods, Image Segmentation in the book titled Digital Image Processing Chapter 10,Page No>589-664,Second Edition.
- Paulus, Color image processing: methods and applications in color image Segmentation Selected Techniques, chapter 5, pp.103-128, CRC Press, Boca Rato, Fla, USA, 2007.
- D. Heric, and D. Zazula, Combined edge detection using wavelet transform and signal registration, Elsevier Journal of Image and Vision Computing 25 (2007) 652–662.
- M. Y. Shih, D. C. Tseng, A wavelet based multi resolution edge detection and tracking, Elsevier, Journal of Image and Vision Computing 23 (2005) 441–451.
- Guangcan Liu, Zhouchen Lin , Senior Member, IEEE, and Yong Yu:Radon representation based feature descriptor for texture classification, IEEE Transactions On Image Processing, Vol. 18, No 5, May 2009.
