Dissolution of uranium from phosphorite by different solutions

Author: Minjigmaa A., Oyun-erdene G., Enkhtuya D., Amgalan G., Bazarova Zh.g, Darkhijav B.
Journal: Вестник Бурятского государственного университета. Философия @vestnik-bsu
Section: Химия
Article in issue: 3, 2010.
Free access
The world average uranium content in phosphate rock is estimated at 50-120 g/tn. The U concentration ranges 10-27 g/tn in Mongolian phosphate deposits. The aim of this study is to improve quality of the activated phosphorus fertilizer. We decreased uranium concentration from 12g/tn till 3.9 g/tn in the milled phosphate raw by carbonate and citric acid solutions. This work demonstrated that sodium carbonate/bicarbonate uranium leaching process is selective and effective to extract 67,5% of uranium from Burenkhaan phosphate rock.
Uranium, phosphate
Short address: https://sciup.org/148179504
IDR: 148179504 | UDC: 65.011.1:622.012
Text of the scientific article Dissolution of uranium from phosphorite by different solutions
The phosphate is main source of fertilizer and about 95% of the world total phosphate rock production used in agriculture as fertilizers, pesticides and animal feeds. Phosphate rock used for fertilizer contain trace amounts of radioactive elements such as a uranium, K40 and thorium. The world average uranium content in phosphate rock is estimated at 50-200 ppm or 0.005-0.020%. Phosphate rock containing up to 120 ppm uranium have been used as a source of uranium fuel. Few data exists on uranium accumulation in soils and uranium plant uptake from phosphate fertilization [1]. No increase in soil and plant uranium was detected in a long term experiment with triple superphosphate fertilization [2]. However, as these authors stated, considering the mobility of U6+ (uranyl ion), it is hardly surprising that no uranium accumulation was found in soil, rather, these results imply that uranium applied with the phosphate fertilizer had leached into the ground water that drained from the fields. Increased uranium concentrations in surface and ground water and water from drainage channels after long term mineral fertilization have been reported [3-5].
Marine phosphorite deposits contain averages of 6-120 ppm, and organic phosphorite deposits up to 600 ppm [6] phosphate rock of sedimentary-type contains an appreciable amount of uranium in the range of 0.005-0.03% U3O8 in isomorphous substitution for Ca [7-8]. The phosphate rock deposits of USA, North Africa, Israel, Jordan and Morocco etc., contain an average U content of 0.01-0.02% U3O8 [9]. The uranium concentration ranges from 0.0001 to 0.0027% in Mongolian phosphate deposits. The concentrations were in the Burenkhaan - 0.0027%, in Alagiin Davaa, Tsakhir-Uul - 0.0001% and in Mankhan-Uul - 0.0001% [10]. It is clear that Mongolian phosphate rock average uranium concentration was lower than the world average uranium concentration (0.005%). About 6.34 million tones of uranium exists in rock phosphate deposits throughout the world [11]. Uranium occur tetravalent (U4+) and hexavalent (U6+) oxidation states in the phosphate [12].
The aim of this study is to decrease concentration of uranium from phosphate rock by citric acid and carbonate solutions, which improves quality of the activated phosphorus fertilizer.
Materials and methods
The rock phosphorite samples was obtained from the Burenkhaan deposit, Khuvsgul Phosphate Basin, Mongolia. The phosphate rock contain 35% P 2 O 5 and samples were ground with different particle sizes (0.05, 0.075, 0.125, 0.175 and 0.2 mm). X-ray diffraction was used to determine the mineralogical composition of the phosphorite. The uranium concentration determined by the gamma-spectrometer.
Results and discussion
Chemical composition of the phosphate
The Burenkhaan phosphorite sample was analyzed, characterized by chemical analysis and X-ray diffractometer. Table 1 shows the composition of phosphorite from Burenkhaan deposit, Northern Mongolia. By [1] phosphorite classification Burenkhaan raw sample belongs to the reach phosphorite (P2O5-35%). CaO dominated in the phosphorite and average concentration of CaO was 45.8% in studied sample. It is clear that Burenkhaan phosphorite sample is fluorapatite. Also concentration of the fluorine was higher in Burenkhaan than Alagiin Davaa, Thakhir-Uul and Mankhan-Uul phosphate deposits. There is positive correlation between concentration of P 2 O 5 and CaO, whereas SiO 2 was negatively correlated.
Table 1.
Main chemical composition of Burenkhaan phosphate
|
о fc |
о cd О |
о ьо S |
о < |
О h |
о о h |
о |
о й S |
о й'1 |
о |
о (Z) |
о |
* о |
м |
||
|
Bkh* |
35.0 |
45.8 |
0.84 |
0.76 |
0.97 |
0.1 |
4.4 |
0.01 |
0.4 |
0.1 |
< 0.1 |
8.36 |
2.41 |
2.05 |
101.4 |
* - Phosphorite from Burenkhaan deposit; ** - Loss of Ignition
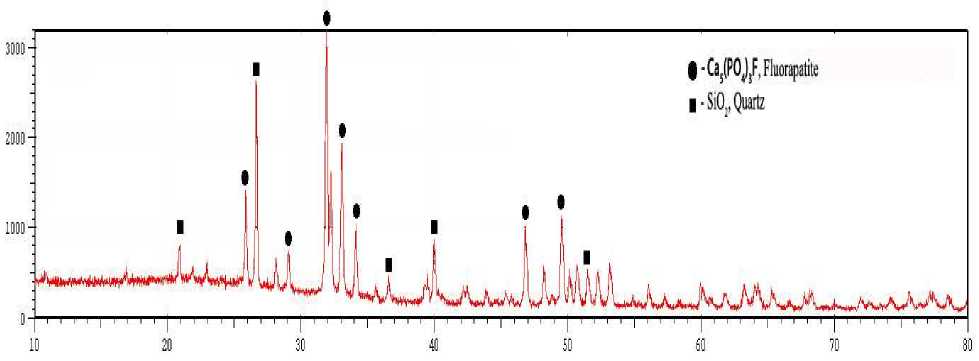
Pic. 1. X-ray diffractogramm of the phosphate from Burenkhaan deposit
The XRD data for the finely ground phosphate shown by pic. 1. The fluorapatite was identified as a main phosphorus-containing mineral. X-ray analysis identified Burenkhaan phosphorite main minerals -quartz and hydrogen carbonate phosphate (pic. 1). Quartz mineral represent the main component, which is chracterized by diffraction lines 26.5, 20.9 and 50.1 Å. The reflection of hydrogen carbonate phosphate appeares at 2ª = 24.3, 29.2, 32, and 34.2 Å .
Uranium leaching study
We dissolved uranium from phosphate by different solutions.
-
1. Uranium dissolution from phosphate in carbonate solutions
-
2. Uranium dissolution from phosphorite in citric acid solution
-
100 g of each phosphate samples were treated 1000 ml 0.5 M citric acid (C 6 H 8 O 7 ) solution. The uranium leaching reaction goes as follow:
The leaching experiments were carried out in 1L Erlenmeyer flasks. 100 g of each phosphate milled samples were treated 500 ml different concentrations of 0.1 M sodium bicarbonate (250 ml) and 0.5 M sodium carbonate solutions (250 ml) for 3 h at 60-70oC. Solutions ratio of carbonate and bicarbonate was 1:1. The reaction will goes as follow:
2UO 2 +O 2 =2UO 3
UO 3 +Na 2 CO 3 +2NaHCO 3 =Na 4 UO 2 (CO 3 ) 3 +H 2 O (Merritt, 1971)
(C 6 H 8 O 7 ) ^ (С б Н 5 О 7 ) 3- +3Н + 2(C 6 H 5 O 7 )3-+3UO 2 2+↔ (UO 2 ) 3 +(C 6 H 5 O 7 ) 2
Table 2.
Uranium dissolution in different solutions
|
№ |
Solutions |
U g/tn |
Leaching rate (%) |
|
1 |
Raw phosphate |
12.0 |
- |
|
2 |
Sodium carbonate (0.5M) |
3.9 |
67.5 |
|
3 |
Citric acid (0.5M) |
4.4 |
63.3 |
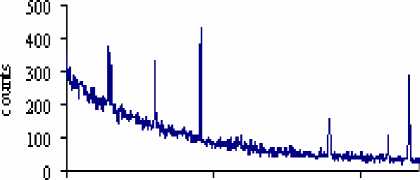
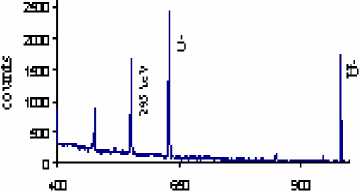
The result shows that concentration of U was 12 g/tn in the studied samples. After leaching experiment uranium concentration decreased from 12 g/tn till 3.9 g/tn and 4.4 g/tn (Table 1, pic. 1, 2). Uranium is typically recovered in acid circuits using citric acid, or in alkaline circuits using a sodium carbonate, bicarbonate mix. This work demonstrated that sodium carbonate/bicarbonate uranium leaching process is selective and effective to extract 67.5% of uranium from Burenkhaan phosphate rock. Uranium is appearing at lines 235 and 609 (pic. 1; 2). The intensities of U were 2431, 1697 in the raw phosphate and after U leaching reaction intensities are decreased till 235, 609, respectively.
400 650 900
Лапше 1
Pic. 1. Gamma spectrogram of the U leached phosphate
Лапше 1
Pic. 2. Gamma spectrogram of the raw phosphate
Technolgical regime for U extractEffect of particle size of phosphate to the U extract
Raw phosphate samples of different size dissolved in citric acid solution (Table 3). Raw phosphate U concentration was 12 g/tn. After the uranium extraction the raw phosphate U decreased till 4.6 g/tn. Concentration of the extracted Uranium depends on particle size of the phosphate. There is negative correlation between particle size and concentration of extracted U. When particle size decreased from 0.2 mm to 0.05 mm then concentration of uranium in the phosphate were increase from 4.6 g/tn till 10.2 g/tn (pic. 3). Therefore, most selective particle size of phosphate is 0.2 mm for the uranium extraction.
Table 3.
Effect of particle size to U extract
|
№ |
Particle size (mm) |
U g/tn |
|
1 |
0.05 |
10.2 |
|
2 |
0.075 |
9.4 |
|
3 |
0.125 |
7.6 |
|
4 |
0.175 |
5.8 |
|
5 |
0.2 |
4.6 |
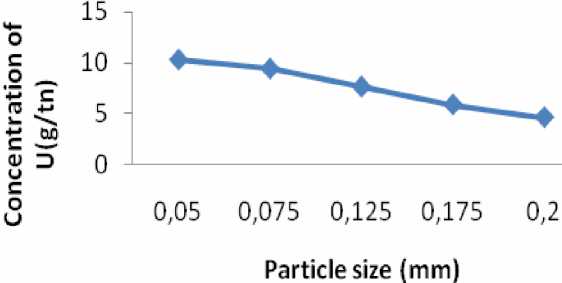
Pic. 3. Effect of particle size to U extract
Effect of extraction time
The milled Burenkhaan phosphate samples were mixed with sodium 0.5 M carbonate/bicarbonate and 0.5 M citric acid solutions for 1, 2, 3, 4 and 5 h at 60-70oC (to aviod decomposition of carbonate and citric) using termostatic hot plate provided with magnetic stirrer.
Table 4.
Relation between extracted U concentration and extraction time
|
Solution |
Extraction time |
|
1 2 3 4 5 |
|
|
Carbonate Citric acid |
5.0 5.3 3.9 5.2 6.0 5.2 6.2 4.4 6.0 6.9 |
Table 4 and pic. 4 show the effect of extraction time on concentration of extracted uranium. Concentration of exracted uranium is significantly depends on extraction time. The raw phosphorite U was 12 g/tn and it decreased till 3.9 g/tn at 3 h. After 3 h the soluble uranium concentration decreased rapidly (pic. 1). Extracted U concentration decreased till 6 g/tn at 6 h. It can be concluded that decomposed precipitation of part of uranium in the solution and to the presence of tetravalent uranium. Therefore optimal U extraction time was found to be 3 h.
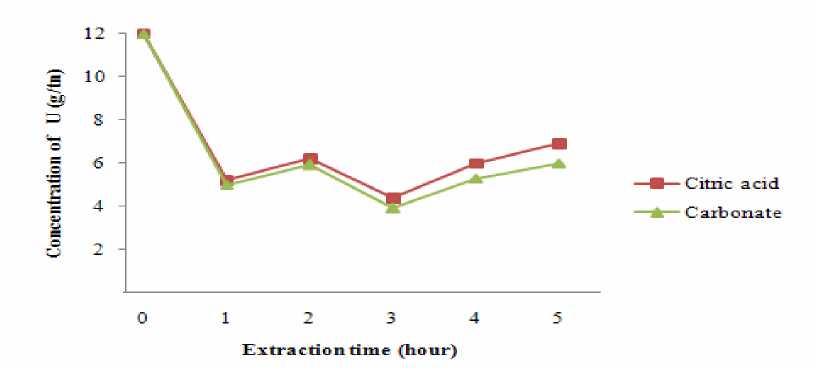
Pic. 4. Relation between extracted U concentration and extraction time
Carbonate/bicarbonate solution is most selective solution for uranium extraction. By this study we removed 67.5% uranium from raw phosphorite. Concentration of the extracted Uranium significantly depends on particle size of the phosphorite. Most selective particle size of phosphate is 0.2 mm for the uranium extraction. The optimal extration time for uranium leaching is 3 h. After 3 hours the soluble uranium concentration decreased because of precipitaion of uranium.
