Distribution System Planning With Distributed Generations Considering Benefits and Costs

Author: Saeid Soudi
Journal: International Journal of Modern Education and Computer Science (IJMECS) @ijmecs
Article in issue: 9 vol.5, 2013.
Free access
One of the methods used in the design and utilization of distribution systems to improve power quality and reliability of load power supply of consumers, is the application of distributed generation (DG) sources. In this paper, a new method is proposed for the design and utilization of distribution networks with DG resources application by finding the optimal sitting and sizing of generated power of DG with the aim of maximization of its benefits to costs. The benefits for DG are considered as system losses reduction, system reliability improvement and benefits from the sale electricity or from lack of purchase of electricity from the main system. The costs of DG are considered as initial capital, maintenance and operation cost and investment cost. In this paper to solve the optimal sitting and sizing problem a Modified particle swarm optimization (PSO) is applied. Simulations are presented on a 69-bus test distribution system to verify the effectiveness of the proposed method. Results showed that the proposed high-power method to find the optimal points of problem is faster and application of DG resources reduced the losses, costs and improved the system voltage profile.
Distributed Generation, Distribution Systems, Particle Swarm Optimization, Reliability
Short address: https://sciup.org/15014586
IDR: 15014586
Text of the scientific article Distribution System Planning With Distributed Generations Considering Benefits and Costs
Published Online October 2013 in MECS DOI: 10.5815/ijmecs.2013.09.07
Increasing electricity consumption, economic and technical constraints in the construction of large power plants, issues of environmental pollution, energy and financial crises, creating a competitive environment in the production and sales power and ... has increased moving towards the production of a small amount of power distributed in the network. This type of resources are called distributed generation (DG). The generation rate of DG is low (<10MW) and can be installed close to final consumers in distribution network [1]. Types of DG are micro-gas turbines, solar cells, fuel cells, wind turbines, geothermal power and biomass. Usually the fuel of these types of DG is green or their contamination is very low. In addition due to generating power near the load centers, the losses in distribution networks can be decreased. Due to disconnection of a line in radial distribution system, a lot of loads will be faced with outage. Therefore application of DG increases reliability of distribution system and also improves the voltage profile. However the advantages of DG application are dependent on the sitting of DG in distribution system. Because the wrong sitting of DG resources in distribution system may increase losses and the voltage in some buses [2]. So, optimal sitting and sizing of DG is an important problem in distribution system planning. The optimal sitting and sizing of DG is implemented in distribution system planning with different objective functions. The loss of distribution system is an important objective function that is used to find the optimal sitting and sizing of DG [3]. The voltage profile improvement is another objective function that is performed in allocation of DG [4]. Also reliability is applied as objective function in [5]. To find the optimal sitting and sizing of DG, various objective functions are used and explained in [6, 7].
In this paper, objective function is considered the maximizing the ratio of benefits to costs of DG application. The advantages of the DG are consist of losses reduction, benefit from lack of purchase of power from main grid and reduction in cost of energy not supplied. The costs associated with installing of DG are consisting of initial capital cost, maintenance and operation cost and investment cost. The load model is considered as a fixed load [8]. The study period of the distribution system planning is 5-year that the interest and inflation rates are considered in the economic calculations. In this paper a modified particle swarm optimization (PSO) algorithm is applied to solve the optimal sitting and sizing problem. In this study, reduction in system losses, benefits from the sale of electricity and reliability improvement are analyzed simultaneously in a 5-year period that a few studies have examined these factors together.
In this paper the objective function and constraints are presented in section II. In section III, problem formulation is presented. The PSO optimization method is applied for optimal sitting and sizing of DG in section IV. The simulation results and discussion are presented in section V. Finally the results concluded in section VI.
-
II. Objective Function and Constraints
To select the optimal location and size of DG generation with a correct choice of the objective function, the optimization problem can be solved.
-
A. Objective Function
The objective function of optimization problem to solve the optimal sitting and sizing of DG is considered maximizing the ratio of benefits from DG application to its costs. Increasing the number of DG causes increase in benefit, but considering the initial capital, maintenance and operation and investment costs of DGs are considerable cost and therefore increasing the number of DG and their generation level will increase costs. So the optimization problem with the aim of maximizing the ratio of DG benefits to costs is presented. The objective function can be defined as follows:
MAX f = Benefit / Cost
Where Benefit is total benefits and Cost is total costs of DGs application in the distribution system.
-
B. Constraints
The objective function is subject to the following constraints:
-
• The voltage levels of system
V min 5 V n — V max n = 1,2,..., N
Where Vi is the node voltage in year i and N is the number of nodes in the system.
-
• The short circuit limitations
b bb
S min — S i — S m
b = 1,2,..., B (3)
Where S i b is the apparent power flowing in branch b in year I and B refers to the number of branches (transformers and lines).
-
• DG real and reactive power
Pk
DG min
k
< P DGi
— Pkx, DG max
k = 1,2,..., K
(4)
Q DG min
< Q DiGi
— Q DG max
k = 1,2,..., K
(5)
Where P D k Gi and Q D k Gi are real and reactive power generated by generator k in year i respectively and K is the number of DG units.
-
III. Problem Formulation
In this section, the benefits and costs of DG application in the distribution system that considered in this study are presented.
-
A. Benefits
A.1. Reduction of the Purchasing Power
The first benefit of DG application is that with the generating power by DG, the purchasing power from the main system is reduced. So, this reduction can indicate the benefit of DG as follows [9]:
N DG
PS ($/ KWh ) = £ P ^G X p (6)
i = 1
Where PS is benefit from sale of power. N DG number of installed DGs, P i DG is size of power generated by ith DG and ρ is electricity price. Considering the 5-year period of study, the inflation and the interest rates should be applied in calculating electricity prices. The price of electricity per year can be calculated by pi ($/ KWh) = p0 X ^lInR)i-1 (7)
-
1 + IntR
Where ρ 0 is electricity prices in the first year, ρ i is electricity prices in i th year and InfR and IntR are the inflation rate and interest rate, respectively.
A.2. Losses Reduction
The next benefit of DG application is considered reduction in system losses due to power generation in loads local and elimination of transmission lines. The losses in the distribution system are dependent on transmission lines current and resistance [10-11]. The losses are function of the system topology, size and location of the DG installation in the system. The relation of losses reduction can be defined by
B Loss = ( L OSS ndg - LOSS DG ) X p (8)
Where Loss NDG and Loss DG refer to the losses without and with DG application, respectively.
A.3. Energy Not Supplied Reduction
Reliability is another benefit that is considered from DG installation and is modeled by the cost of energy not supplied (ENS). Fault location and fault repair are considered along a branch fault to calculate the ENS. Sectionalizers and reclosers can limit the area of influence of a fault and reduce the number of customers affected by long-term interruptions. Stage repair include the time required to isolate the faulted branch, connect any emergency ties and the repair of fault. DG enabling power to be restored to the nodes downstream the sectionalized branch, can lead to considerable reliability improvements
The cost of ENS can be calculated by [12].
C ens = ^ £ Л , х L i x p„ x t i x D j (9)
-
i = 1 j = 1
Where CENS is the cost of ENS for per year, Nbranch is the number of system branch, Nl is the number of disconnected loads due to ith faulted branch, X i is the branch fault rate for each kilometer per year, Li is the branch length, t, is duration of repair stages, p int ENS price of consumers, Dj is the load rate due to faulted ith branch.
The benefit of the DG application in reliability is defined by
N DG
MCDG ($ / Kwh - year ) = £ C ma i ntenanc e (15)
i = 1
Where Ci maintenance is the maintenance and operation cost of ith DG and MCDG is the total cost of the repair and maintenance of all DGs. This cost is an annual and the inflation and the interest rates should be considered.
■ maintenance = C meintenance х ( 1 + InfR ) i - 1 i ~ 0 1 + IntR
A C ENS
ENS ENS
= C NDG C DG
Where CN E D NS G and CD EN G S refer to the cost of ENS without and with DG, respectively. Also the price of the ENS should be calculated for each year based on interest and inflation rates as follows
-
IV. PSO Optimization Method
In this paper, a PSO algorithm is applied to determination of DG optimal sitting and sizing in distribution system.
The optimization problem is defined as follows:
int int /1 + InfR\i - 1
Pi = P 0 х (i— 77^
1 + IntR
Min f ( x ) s . t . x i e Xt , i = 1,2,3,..., N (17)
-
B. Costs
In this section for DG, three types of costs are considered. Initial capital, maintenance and operation and investment costs. [13].
-
B.1. DG Investment Cost
DG investment cost includes costs associated with purchasing, installing and connecting DG units. The investment cost of DG is given by
NDG
ICDG ($/ KWh ) = ^ C™vest ™ ent (12)
i = 1
Ci investment is the cost of purchasing and installing ith
DG and ICDG is the total investment cost for all DGs.
-
B.2. Investment Cost
The investment cost is included of annual fuel cost considering interest rate. The investment cost is calculated by
N DG
OCDG ($ / KWh - year ) = £ C o peration (13)
i = 1
Ci operation is the investment cost of ith DG and OCDG is the investment cost of all DGs. This cost is an annual cost and interest rates and inflation should be considered.
C opera/ion = Coperatton х ( 1 + InfR ) i - 1 i ~ 0 1 + IntR
-
B.3. Maintenance and Operation Cost
The maintenance and operation cost that includes costs associated with maintenance of DG units, is defined by
The f ( x ) is the objective function and the x is the collection of each of the decision variables xi . The Xi is the collection of possible range of each variable and the N is the number of variables. The PSO optimization algorithm [14-15] is one of the latest and strongest Heuristics methods and has been used in solution of several complex problems up to now. The PSO algorithm has some disadvantages that the most important of them are:
-
• Perch in the local optimal locations.
-
• Ability of weak local search.
In this paper, the PSO algorithm has been used to solve these disadvantages and to improve the PSO algorithm performance. The PSO algorithm starts to work with a group of the random replies (i.e. particles) and then searches the optimal reply in the problem with updating the generations. Each particle is defined by the S i and V i which show the spatial position and the velocity stage of the ith particle. At each stage of the population movement, each particle is updated by the two values of best. The first value is the best reply in terms of the competency, which is obtained separately for each particle up to now. This value is P best . The other best value that is obtained by the algorithm is the best value that is obtained by the all of the particles among the population, up to now. This value is Gbest. After finding the values of the Pbest and Gbest, each particle updates its new velocity and position based on the following equations:
V ik + 1 = W * Vk + C 1 * rand 1 * ( Р ье 5Ц - S i ) + C 2 * rand 2 *( G best, - S i )
S k + 1 S k | J^k + 1
The problem convergence is dependent on the PSO algorithm parameters such as W , C1 , C2 . W is the updating factor of the particles velocity. C1 and C2 are the acceleration factors, which are the same and are in the range of [0, 2]. The rand 1 and rand 2 are two random number in the range of [0, 1]. In PSO with updating the W for obtaining the best reply in terms of the convergence velocity and accuracy in the optimization problem, the following equation is used:
w _ W max + (( W min - W max ) / iterMax ) * iter (20)
Where W min and W max are the minimum and maximum values of the inertia weight, the iterMax is the maximum number of the algorithm iterations, and the iter is the current iteration of the algorithm. The inertia weight is varied by (20) and causes the convergence, which is defined as a variable in the range of [0.2-0.9]. The PSO algorithm, because of updating the inertia weight with updating the particles velocity, has a good performance. In the optimization problem solving process, the number of algorithm iterations has been reduced and the convergence power has been increased under the conditions of the increased community members. Finally the optimization algorithm is finished by the particles convergence to a certain extent. The flowchart of PSO optimization method is presented in Fig. 1. The optimal parameters of PSO algorithm used in this study are presented in Table 1.
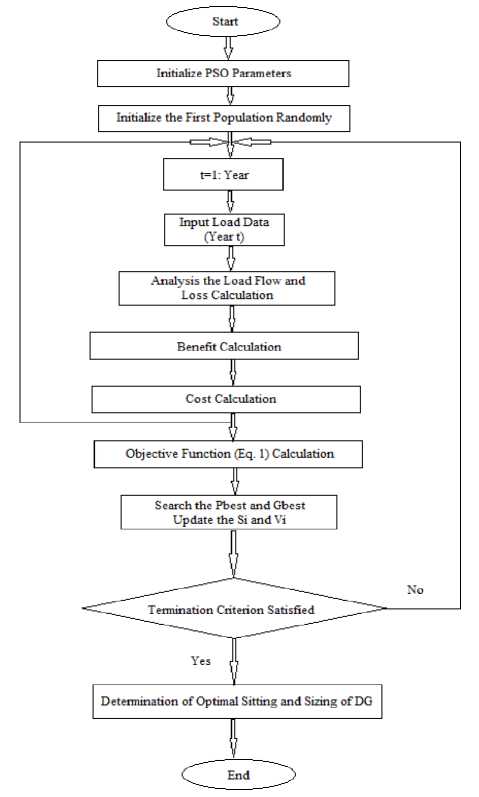
Figure 1. Flowchart of PSO optimization method.
TABLE I T he optimal parameters of PSO algorithm used in OPTIMIZATION PROBLEM
|
Swarm Size |
C 1 |
C 2 |
W |
iterMax |
|
25 |
2 |
2 |
0.4-0.9 |
100 |
-
V . Simulation Results and Discussion
To show the capability of the proposed algorithm and effectiveness of proposed method to solve the optimal sitting and sizing problem, a 69 bus distribution test system has been used. For simulation of proposed method a power flow program for test system has been developed. The period taken into consideration for the planning study is 5 years long.
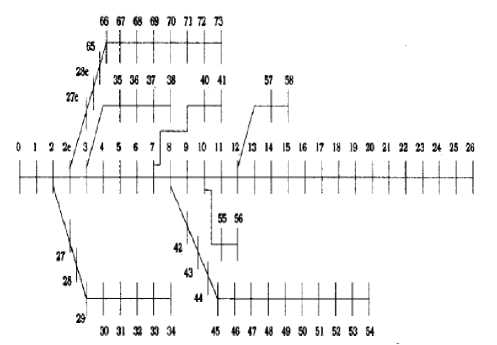
Figure 2. The 69-bus radial distribution test system.
The test system is shown in Fig. 2. Data's about 69 bus branches and its loads is presented in Table 2 [17]. The base voltage is 66/12 KV and the base power is 10 KVA. In this system, the outage rate of branches is 0.046 per kilometer per year and it is assumed that other system components have 100% reliability [8]. In this paper, the load model is considered as the shoulder load of model presented in [8]. Reference model is a three-level profiles that in this paper, the study is performed over the shoulder load period. The load characteristics, price of ENS and electricity prices are presented in Table 3. Economic data of selected DG is shown in Table 4. In this table, the selected DG has a maximum generation capacity 1 MW that its cost is 318,000 $ and it is means that to generating even 100 KW it is required that the DG Purchase price of $ 318,000 payed fully [8].
TABLE II Data of Test System IEEE 69-bus [1 7]
|
Line No. |
Sending End |
Receiving End |
R(Q) |
X(Q) |
P(KW) at receiving end |
Q(KVAR) at receiving end |
|
1 |
1 |
2 |
0.0005 |
0.0012 |
0 |
0 |
|
2 |
2 |
3 |
0.0005 |
0.0012 |
0 |
0 |
|
3 |
3 |
4 |
0.0015 |
0.0036 |
0 |
0 |
|
4 |
4 |
5 |
0.0251 |
0.0294 |
0 |
0 |
|
5 |
5 |
6 |
0.366 |
0.1864 |
2.6 |
2.2 |
|
6 |
6 |
7 |
0.3811 |
0.1941 |
40.4 |
30 |
|
7 |
7 |
8 |
0.0922 |
0.047 |
75 |
54 |
|
8 |
8 |
9 |
0.0493 |
0.0251 |
30 |
22 |
|
9 |
9 |
10 |
0.819 |
0.2707 |
28 |
19 |
|
10 |
10 |
11 |
0.1872 |
0.0619 |
145 |
104 |
|
11 |
11 |
12 |
0.7114 |
0.2351 |
145 |
104 |
|
12 |
12 |
13 |
1.03 |
0.34 |
8 |
5.5 |
|
13 |
13 |
14 |
1.044 |
0.345 |
8 |
5.5 |
|
14 |
14 |
15 |
1.058 |
0.3496 |
0 |
0 |
|
15 |
15 |
16 |
0.1966 |
0.065 |
45.5 |
30 |
|
16 |
16 |
17 |
0.3744 |
0.1238 |
60 |
35 |
|
17 |
17 |
18 |
0.0047 |
0.0016 |
60 |
35 |
|
18 |
18 |
19 |
0.3276 |
0.1083 |
0 |
0 |
|
19 |
19 |
20 |
0.2106 |
0.0696 |
1 |
0.6 |
|
20 |
20 |
21 |
0.3416 |
0.1129 |
114 |
81 |
|
21 |
21 |
22 |
0.014 |
0.0046 |
5.3 |
3.5 |
|
22 |
22 |
23 |
0.1591 |
0.0526 |
0 |
0 |
|
23 |
23 |
24 |
0.3463 |
0.1145 |
28 |
20 |
|
24 |
24 |
25 |
0.7488 |
0.2475 |
0 |
0 |
|
25 |
25 |
26 |
0.3089 |
0.1021 |
14 |
10 |
|
26 |
26 |
27 |
0.1732 |
0.0572 |
14 |
10 |
|
27 |
3 |
28 |
0.0044 |
0.0108 |
26 |
18.6 |
|
28 |
28 |
29 |
0.064 |
0.1565 |
26 |
18.6 |
|
29 |
29 |
30 |
0.3978 |
0.1315 |
0 |
0 |
|
30 |
30 |
31 |
0.0702 |
0.0232 |
0 |
0 |
|
31 |
31 |
32 |
0.351 |
0.116 |
0 |
0 |
|
32 |
32 |
33 |
0.839 |
0.2816 |
14 |
10 |
|
33 |
33 |
34 |
1.708 |
0.5646 |
19.5 |
14 |
|
34 |
34 |
35 |
1.474 |
0.4873 |
6 |
4 |
|
35 |
4 |
36 |
0.0034 |
0.0084 |
0 |
0 |
|
36 |
36 |
37 |
0.0851 |
0.2083 |
79 |
56.4 |
|
37 |
37 |
38 |
0.2898 |
0.7091 |
384.7 |
274.5 |
|
38 |
38 |
39 |
0.0822 |
0.2011 |
384.7 |
274.5 |
|
39 |
8 |
40 |
0.0928 |
0.0473 |
40.5 |
28.3 |
|
40 |
40 |
41 |
0.3319 |
0.1114 |
3.6 |
2.7 |
|
41 |
9 |
42 |
0.174 |
0.0886 |
4.35 |
3.5 |
|
42 |
42 |
43 |
0.203 |
0.1034 |
26.4 |
19 |
|
43 |
43 |
44 |
0.2842 |
0.1447 |
24 |
17.2 |
|
44 |
44 |
45 |
0.2813 |
0.1433 |
0 |
0 |
|
45 |
45 |
46 |
1.59 |
0.5337 |
0 |
0 |
|
46 |
46 |
47 |
0.7837 |
0.263 |
0 |
0 |
|
47 |
47 |
48 |
0.3042 |
0.1006 |
100 |
72 |
|
48 |
48 |
49 |
0.3861 |
0.1172 |
0 |
0 |
|
49 |
49 |
50 |
0.5075 |
0.2585 |
1244 |
888 |
|
50 |
50 |
51 |
0.0974 |
0.0496 |
32 |
23 |
|
51 |
51 |
52 |
0.145 |
0.0738 |
0 |
0 |
|
52 |
52 |
53 |
0.7105 |
0.3619 |
227 |
162 |
|
53 |
53 |
54 |
1.041 |
0.5302 |
59 |
42 |
|
54 |
11 |
55 |
0.2012 |
0.0611 |
18 |
13 |
|
55 |
55 |
56 |
0.0047 |
0.0014 |
18 |
13 |
|
56 |
12 |
57 |
0.7394 |
0.2444 |
28 |
20 |
|
57 |
57 |
58 |
0.0047 |
0.0016 |
28 |
20 |
|
58 |
3 |
59 |
0.0044 |
0.0108 |
26 |
18.55 |
|
59 |
59 |
60 |
0.064 |
0.1565 |
26 |
18.55 |
|
60 |
60 |
61 |
0.1053 |
0.123 |
0 |
0 |
|
61 |
61 |
62 |
0.0304 |
0.0355 |
24 |
17 |
|
62 |
62 |
63 |
0.0018 |
0.0021 |
24 |
17 |
|
63 |
63 |
64 |
0.7283 |
0.8509 |
1.2 |
1 |
|
64 |
64 |
65 |
0.31 |
0.3623 |
0 |
0 |
|
65 |
65 |
66 |
0.041 |
0.0478 |
6 |
4.3 |
|
66 |
66 |
67 |
0.0092 |
0.0116 |
0 |
0 |
|
67 |
67 |
68 |
0.1089 |
0.1373 |
39.22 |
26.3 |
|
68 |
68 |
69 |
0.0009 |
0.0012 |
39.22 |
26.3 |
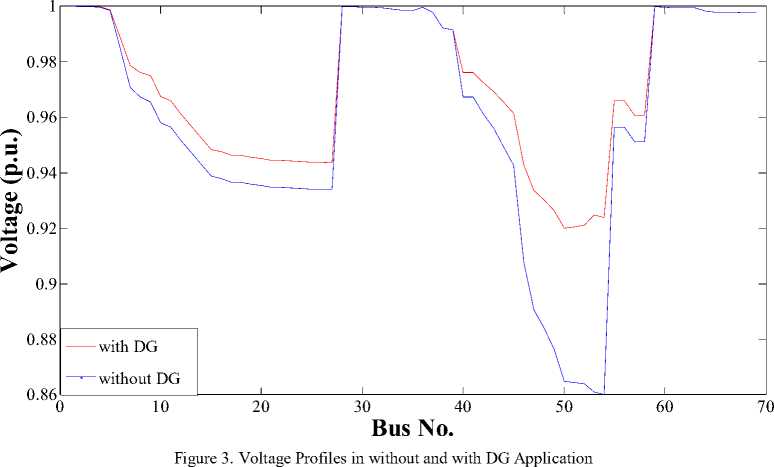
To evaluation the effect of the DG application in the distribution system based on its benefits that was introduced for DG, first the test system without DG were studied and the presented parameters (loss, cost of ENS and power purchase cost) were calculated. Then the DG is applied in the test system and results were calculated. The results of without and with DG application are presented Table 5. As shown as in Table 5, application of DG improved technical situation of test system. This means that the system loss, cost of ENS and power purchase has been reduced or in the other hands, power quality and reliability of the system load supply is improved. Also in Table 6, the results of optimal sitting and sizing are presented. Table 6 shows that the best place to install the DG is the bus 53, because the branch where starts from the bus 42 to bus 54, supplies great load and the reliability of this branch is more important. Also because the bus 52 has a great load, installing DG in the Bus 53 increases the reliability and with load supply of bus 52 through the DG of the Bus 53, reduces the consumed power from the system and hence reduces losses. The voltage profile without and with DG application is illustrated in Fig. 3. Although the voltage profile improvement was not the portion of the objective voltage. function but the DG application improved the buses
TABLE IIICharacteristics of load and power in shoulder load times [8]
|
Parameter |
Value |
|
The load level compared to peak load (%) |
80 |
|
Period Time of each year (h/year) |
4745 |
|
The Price of ENS ($/KWh) |
3.76 |
|
Electricity Price ($/MWh) |
49 |
TABLE IV Economic data of selected DG [8]
|
Parameter |
Dimension |
Value |
|
Initial Capital Cost |
$/each DG |
318000 |
|
Investment Cost |
$/MWh |
29 |
|
Maintenance and Operation Cost |
$/MWh |
7 |
|
Interest rate |
% |
12.5 |
|
Inflation rate |
% |
9 |
|
Horizon of study |
year |
5 |
TABLE IV losses, costs of ENS and cost of power purchase without and with DG application.
|
Parameter |
State |
1th year |
2th year |
3th year |
4th year |
5th year |
Total |
|
Losses (KW) |
NDG |
138.9 |
170.46 |
209.57 |
258.2 |
318.97 |
1096.1 |
|
WDG |
75.69 |
92.33 |
112.77 |
137.86 |
168.75 |
587.4 |
|
|
%R |
45.5 |
45.84 |
46.19 |
46.61 |
47.1 |
46.41 |
|
|
Cost of ENS |
NDG |
13988 |
26466 |
50075 |
94742 |
179252 |
364523 |
|
WDG |
8294.59 |
15693.37 |
29691.85 |
56176.99 |
106286.9 |
216143.7 |
|
|
%R |
40.702 |
40.703 |
40.70525 |
40.705295 |
40.70532 |
40.705 |
|
|
Cost of purchase Power |
NDG |
7072225 |
13380651 |
25316191 |
47898233 |
90623457 |
184290757 |
|
WDG |
539537.3 |
1020805 |
1931362 |
3654137 |
6913628 |
14059469.3 |
|
|
%R |
92.371038 |
92.371036 |
92.37104 |
92.37104 |
92.371039 |
92.37104 |
* NDG: without DG, WDG: with DG, %R: percent of reduction
TABLE VI R esults of DG O ptimal S itting and S izing
|
NO. Bus |
Generated Power by DG (KW) |
Objective Function |
|
53 |
729.85 |
1.73 |
-
VI Conclusion
Achieve to greatest benefits of DG application in distribution system depends on determination of the optimal sitting and sizing of the DG. In this paper, objective function of the optimization problem was considered maximizing the ratio of benefits to costs of DG application that a few studies have examined these factors together. A modified PSO algorithm was applied to solve the optimization problem. Simulation results on the 69-bus distribution test system have been presented. The results showed that the optimal application of DG was reduced the losses, costs of ENS and costs of the power purchase up to 45%-47%, 40% and 92%, respectively and also the voltage profile of distribution system is improved.
References Distribution System Planning With Distributed Generations Considering Benefits and Costs
- Lei Han ; Renjun Zhou ; Xuehua Deng, "An analytical method for DG placements considering reliability improvements ", IEEE Power & Energy Society General Meeting, PES '09, pp.1-5, 2009.
- M. F.Shaaban, and E. F. El-Saadany, "Optimal allocation of renewable DG for reliability improvement and losses reduction", IEEE Power and Energy Society General Meeting, PP. 1-8, 2012.
- Duong Quoc Hung ; N. Mithulananthan, "Multiple Distributed Generator Placement in Primary Distribution Networks for Loss Reduction", IEEE Transactions on Industrial Electronics, Vol. 60, No. 4, pp. 1700-1708, 2013.
- M.M. Aman, G.B. Jasmon, H. Mokhlis, A.H.A. Bakar, "Optimal placement and sizing of a DG based on a new power stability index and line losses", International Journal of Electrical Power & Energy Systems, Vol. 43, No. 1, pp. 1296-1304, December 2012.
- In-Su Bae ; Jin-O Kim ; Jae-Chul Kim ; C.Singh, "Optimal operating strategy for distributed generation considering hourly reliability worth", IEEE Transactions on Power Systems, Vol. 19, No. 1, pp. 287-292, 2004.
- L. R. Mattison, "Technical Analysis of the Potential for Combined Heat and Power in Massachusetts", Report, University of Massachusetts Amherst, May 2006.
- Devender Singh, R. K. Misra, and Deependra Singh "Effect of load models in Distributed Generation planning," IEEE Transaction on Power systems, Vol. 22, no. 4, Nov. 2007.
- N. Khalesi, N. Rezaei, M.-R. Haghifam, "DG allocation with application of dynamic programming for loss reduction and reliability improvement", International Journal of Electrical Power & Energy Systems, Vol. 33, No. 2, pp. 288-295, February 2011.
- Carmen L.T. Borges, Djalma M. Falca˜o, "Optimal distributed generation allocation for reliability, losses, and voltage improvement", International Journal of Electrical Power & Energy Systems, Vol. 28,No. 6, pp. 413-420, July 2006.
- S.C. Reddy, P.V.N. Prasad, A.J. Laxmi, "Reliability improvement of distribution system by optimal placement of DGs using PSO and neural network", International Conference on Computing, Electronics and Electrical Technologies (ICCEET), pp. 156-162, 2012.
- R.V. Rao, V.J. Savsani, , D.P. Vakharia, "Teaching–learning-based optimiza- tion: an optimization method for continuous non-linear large scale problem", Inf. Sci. 183, 1–15, 2012.
- R.V. Rao, V. Patel, "An elitist teaching–learning-based optimization algo- rithm for solving complex constrained optimization problems" Int. J. Ind. Eng.Comput., 3, http://dx.doi.org/10.5267/j.ijiec.03.007, 2012.
- Haupt R. L. and Haupt S. E., PrACtical genetic algorithms. Second Edition, John Wiley & Sons Inc. Publication, 2004, pp. 189-190.
- M. Clerc. Particle Swarm Optimizition. ISTE,2006.
- E.N. Avadani, B. Moradzadeh, M. Abedi, S.H. Hosseinian, "Multiobjective Optimization for Optimal Power Flow Considering Valve Loading Effect", UPEC Conf.
- Shyh-Jier Huang, "An Immune-Based Optimization Method to Capacitor Placement in a Radial Distribution System", IEEE Trans. On Power Delivery, Vol. 15, No. 2, pp. 744-749, 2000.
- M. E. Baran and F. F. Wu, "Optimal Capacitor Placement on Radial Distribution Systems," IEEE Transactions on Power Delivery, vol. 4, no. 1, pp. 725–734, January 198.
