Долговременные изменения в нейтральном газовом составе термосферы над Норильском (2003-2013 гг.)
")
Автор: Кушнаренко Г.П., Яковлева О.Е., Кузнецова Г.М.
Журнал: Солнечно-земная физика @solnechno-zemnaya-fizika
Статья в выпуске: 4 т.2, 2016 года.
Бесплатный доступ
Сезонные изменения относительных величин основных газовых составляющих термосферы [O]/[N2] и [O2]/[O] получены для ст. Норильск за период 2003-2013 гг. Оценки выполнены по методике авторов и по данным Норильского дигизонда (69° N, 88° E) для высот ниже максимума ионосферного слоя F1 в спокойных и возмущенных геомагнитных условиях для разных сезонов. Получено, что [O2]/[O] в спокойных и возмущенных геомагнитных условиях к концу 2013 г. уменьшается во все сезоны на 10-20 % по отношению к значениям 2003 г. Отношение [О]/[N2] для тех же условий увеличивается до 17 %.
Газовые составляющие термосферы, геомагнитные возмущения, сезонные изменения
Короткий адрес: https://sciup.org/142103625
IDR: 142103625 | УДК: 350.338.2, | DOI: 10.12737/21465
Текст научной статьи Долговременные изменения в нейтральном газовом составе термосферы над Норильском (2003-2013 гг.)
The present study is a sequel to the work carried out for the station Irkutsk [Kushnarenko et al., 2015].
The day-to-day ionospheric variability is determined by a number of factors the main of which is the state of the neutral gas in the thermosphere. For the middle ionosphere with the F1-region at its heights, the main indicator of the state of the thermosphere is gas composition, which is largely characterized by the ratio of atomic oxygen particles to oxygen and nitrogen molecules. Existing methods for determining the principal gas components and the ratio of atomic oxygen to molecular nitrogen [O]/[N2] are generally applicable to heights above the F2-layer peak height [Mordovskaya et al., 2010; Danilov, 1961].
The influence of the gas composition on the electron density N and the shape of the vertical distribution profile N ( h ) is most pronounced in the F1 layer below 200 km, where the condition of photochemical equilibrium usually holds, therefore the behavior of the F1 layer well reflects changes in the gas composition of the thermosphere [Shchepkin et al., 1997, 1998].
The method of estimating thermospheric conditions from ionospheric measurements and through application of the semi-empirical ionospheric model (SIM) [Shchepkin et al., 1997] allows us to determine both diurnal relative densities of the main gas particles and those averaged over a long period under different conditions of solar and geomagnetic activity [Shchepkin et al., 2008, 2009] at heights below the F1-layer peak height.
The paper deals with variations in the [O]/[N 2 ] and [O 2 ]/[O] ratios obtained using our method at the station Norilsk over the prolonged period of decrease, minimum, and increase in solar activity (2003–2013). We analyze their seasonal variations.
METHOD AND DATA
The semi-empirical model is based on a regression equation [Shchepkin et al., 1998]
N / N av = X 1 + X 2 [ « i /(5 n 2 + n 3 ) ] 1.5 + X 3 ( nJn 3 ) 0 .5(cos X) 0 . 5 + X 4 exp [ - ( T ex - 600)/600 ] + X 5 ( E / E 0 ). (1)
Table 1. Mean [O]/[N2] and [O2]/[O] ratios during geomagnetic disturbances and quiet days in 2003–2013 at the station Norilsk
|
Year |
F 10.7 |
[O]/[N 2 ] |
|||||||
|
Winter |
Spring |
Summer |
Fall |
||||||
|
disturbed |
quiet |
disturbed |
quiet |
disturbed |
quiet |
disturbed |
quiet |
||
|
2003 |
128 |
0.210 |
0.234 |
0.192 |
0.206 |
0.179 |
0.187 |
0.170 |
0.205 |
|
2004 |
106 |
0.220 |
0.241 |
0.207 |
0.224 |
0.186 |
0.192 |
0.182 |
0.219 |
|
2005 |
98 |
0.228 |
0.237 |
0.203 |
0.215 |
0.181 |
0.198 |
0.188 |
0.210 |
|
2006 |
80 |
0.218 |
0.240 |
0.202 |
0.224 |
0.188 |
0.221 |
0.195 |
0.208 |
|
2007 |
74 |
0.232 |
0.250 |
0.189 |
0.195 |
0.173 |
0.189 |
0.172 |
0.190 |
|
2008 |
69 |
0.217 |
0.227 |
0.170 |
0.184 |
0.154 |
0.174 |
0.178 |
0.183 |
|
2009 |
71 |
0.221 |
0.246 |
0.186 |
0.209 |
0.180 |
0.194 |
0.203 |
0.231 |
|
2010 |
80 |
0.201 |
0.240 |
0.187 |
0.212 |
0.181 |
0.190 |
0.200 |
0.213 |
|
2011 |
113 |
0.220 |
0.255 |
0.193 |
0.220 |
0.185 |
0.200 |
0.170 |
0.182 |
|
2012 |
120 |
0.230 |
0.241 |
0.187 |
0.202 |
0.173 |
0.181 |
0.186 |
0.203 |
|
2013 |
123 |
0.242 |
0.252 |
0.217 |
0.248 |
0.191 |
0.208 |
no |
no |
|
[O 2 ]/[О] |
|||||||||
|
2003 |
128 |
0.800 |
0.660 |
0.606 |
0.528 |
0.603 |
0.512 |
0.594 |
0.476 |
|
2004 |
106 |
0.702 |
0.592 |
0.594 |
0.537 |
0.617 |
0.510 |
0.500 |
0.461 |
|
2005 |
98 |
0.696 |
0.629 |
0.608 |
0.499 |
0.570 |
0.505 |
0.534 |
0.449 |
|
2006 |
80 |
0.702 |
0.570 |
0.630 |
0.538 |
0.574 |
0.549 |
0.546 |
0.504 |
|
2007 |
74 |
0.718 |
0.577 |
0.530 |
0.488 |
0.556 |
0.454 |
0.439 |
0.418 |
|
2008 |
69 |
0.677 |
0.637 |
0.518 |
0.483 |
0.586 |
0.512 |
0.474 |
0.402 |
|
2009 |
71 |
0.690 |
0.607 |
0.537 |
0.522 |
0.651 |
0.570 |
0.621 |
0.467 |
|
2010 |
80 |
0.730 |
0.690 |
0.530 |
0.490 |
0.528 |
0.498 |
0.467 |
0.400 |
|
2011 |
113 |
0.665 |
0.595 |
0.553 |
0.478 |
0.552 |
0.454 |
0.546 |
0.416 |
|
2012 |
120 |
0.700 |
0.660 |
0.527 |
0.425 |
0.553 |
0.490 |
0.584 |
0.522 |
|
2013 |
123 |
0.654 |
0.609 |
0.525 |
0.417 |
0.493 |
0.430 |
no |
no |
Here N is the electron density; N av is the average N over the entire data volume separately for each height; X j are the coefficients of the model equation; n 1 , n 2 , n 3 are the densities of atomic oxygen, nitrogen and oxygen molecules; T ex is the exospheric temperature; x is the solar zenith angle . Equation (1) can be written as follows:
N / N av = X 1 + X 2 R^W + X 3 V R (cosx0.5 + X 4 exp [ - ( T ex - 600)/600 ] + X 5 ( E / E 0 ). (2)
Here R =[O]/[N2], W =[1/(1+5 R 2)]1.5, R 2=[O2]/[N2], R 2/ R =[O2]/[O]. [O], [O2], and [N2] are components of the neutral atmosphere, E 0 is the ionizing radiation flux energy E during sunspot maximum. In the calculations, we em-119
ploy the thermospheric model [Hedin, 1987] and the model [Tobiska, Eparvier, 1998] for determining the ionizing radiation energy. The N values were obtained from measurements made with the vertical sounding method at the station Norilsk at 120–200 km. Using these data, from equation (2) we can estimate values of [O]/[N 2 ] and [O 2 ]/[O]. The calculation procedure is described in [Kushnarenko et al., 2011].
RESULTS
Ratios of the [O]/[N2] and [O2]/[O] gas components are calculated for daylight hours 07–18 LT at heights below the F1-layer peak height. For each quiet and disturbed day (a disturbed day is such that Ap>10) we estimate the mean ratio in the midday hours 10–14 LT, and then find the average ratio for each season of the given years. We analyze days with different geomagnetic conditions in different seasons over the period 2003–2013, which includes years of decrease, prolonged minimum (2007–2009), and increase in solar activity. As a result, we have studied 400 geomagnetic events of varying intensity as well as all quiet days for all seasons. The F10.7, Ap indices have been selected from the WDC-C2 database in Kyoto []. The resulting ratios [O]/[N2] and [O2]/[O] are listed in Table 1.
THE [O2]/[O] RATIO
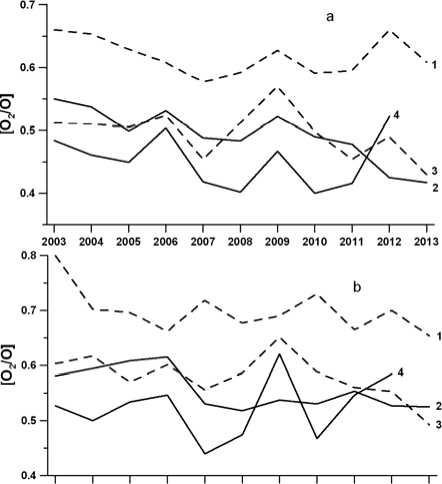
Seasonal variations in the mean [O 2 ]/[O] under quiet conditions in 2003–2013 is shown in Figure 1, a . During the summer seasons of 2003–2007, [O 2 ]/[O] goes down by 17 % compared to the initial values obtained in 2003; then in years of minimum solar activity, [O 2 ]/[O] goes up by 26 % compared to the values obtained in the 2007. By the end of the period, the mean [O 2 ]/[O] decreases by 16 % with respect to the summer values of 2003. The autumn values of [O 2 ]/[O] are the lowest over the entire period under study, the pattern of change repeating the summer one. In Figure 1, a , the branch of the change of [O 2 ]/[O] in winter seasons takes top position, and averages vary from year to year between 5 and 15 %.
2003 2004 200S 2006 2007 2008 2009 2010 2011 2012 2013
Figure 1. Long-term variations in the mean values of [O2]/[O] under quiet ( a ) and disturbed ( b ) conditions for different seasons. Seasons are numbered as follows: 1 – winter, 2 – spring, 3 – summer, 4 – fall
By 2013, [O 2 ]/[O] decreases by 10 % with respect to the winter values of 2003.
The mean [O 2 ]/[O] ratios under disturbed conditions (Figure 1, b ) exceed quiet values by 10–25 % in all the seasons throughout the period. The [O2]/[O] ratio, as in quiet conditions, is characterized by an increase up to 15 % in the years of minimum solar activity compared to 2007. By the end of the period, [O2]/[O] goes down relative to the values of 2003: in winter and summer by 18 %, in spring and fall by 13 %.
Thus, [O 2 ]/[O] by the end of 2013 under quiet and disturbed conditions in all seasons decreases by 10–20 % compared to the values of 2003.
THE [O]/[N2] RATIO
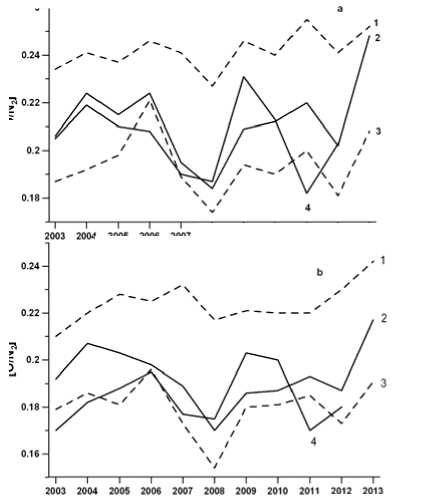
Under quiet and disturbed conditions, branches of winter [O]/[N 2 ] values take the highest position in Figure 2, a , b . Winter [O]/[N2] values over the entire period show small year-to-year variations (5–15%). Under disturbed conditions, mean [O]/[N2] values are smaller than quite ones within 5–20 % in all seasons over the entire period.
Under quiet conditions, there is an increase in this ratio by 2013 compared to the values obtained in 2003: up to 17 % in winter and spring, up to 10 % in summer and fall. Disturbances are also characterized by a slight increase in [O]/[N 2 ] in 2013: by 12 % in winter and spring, and a small increase in summer and fall.
2003 2004 2005 2006 2007 2008 2009 2010 2011 2012 2013
Figure 2. Long-term variations in mean [O]/[N2] values under quiet ( a ) and disturbed ( b ) conditions for different seasons. Seasons are numbered as follows: 1 – winter, 2 – spring, 3 – summer, 4 – fall
2003 2004 2005 2006 2007 2008 2009 2010 2011 2012 2013
The dynamics of [O]/[N 2 ] in all seasons of the quiet period during the years of solar minimum clearly exhibits a decrease in average values relative to the maximum ones obtained in 2009: in fall up to 20 %, in spring and summer up to 15 % and 17 % respectively. During disturbances, there are similar changes up to 15 %. In addition, let us note the maximum increase in the values of [O]/[N2] in falls of 2009 and 2010 under quiet and disturbed conditions. In other seasons, this increase is not so significant in these years.
The [O]/[N 2 ] ratio is characterized by a certain increase from 10 to 17 % by 2013 under quiet and disturbed conditions with respect to 2003.
COMPARING THE [О]/[N2] RATIOS
Comparison with model values
Using a great body of data on N , acquired with the vertical sounding method, we calculated the ratios of basic gas components of the thermosphere [O]/[N 2 ] and [O 2 ]/[O] for daytime hours (07–18 LT) for all quiet and disturbed days over eleven years of the period under study. For comparison, we have chosen summer seasons of three years: 2003 – the most disturbed year, 2007 – the quietest year, and 2011 – the year with increasing solar activity. The comparison was made with the values of [O]/[N 2 ] calculated using the MSIS-86 model [Hedin, 1987] for these years and respective conditions. Then, we found r 1={[O]/[N 2 ]} calc /{[O]/[N 2 ]} MSIS .
Table 2. The ratio r 1={[O]/[N2]}calc/{[O]/[N2]}MSIS (summer seasons)
|
2003 (summer days) |
||||||||||||
|
disturbed |
1.00 |
0.85 |
0.89 |
0.96 |
1.09 |
0.92 |
1.11 |
1.09 |
0.93 |
1.08 |
0.96 |
1.00 |
|
quiet |
0.84 |
1.93 |
1.02 |
0.94 |
0.93 |
1.08 |
1.02 |
0.92 |
1.11 |
0.99 |
0.94 |
0.93 |
|
2007 (summer days) |
||||||||||||
|
disturbed |
0.95 |
1.00 |
1.01 |
1.12 |
1.01 |
0.95 |
1.01 |
1.04 |
1.01 |
1.12 |
1.07 |
1.07 |
|
quiet |
1.01 |
1.06 |
0.99 |
1.00 |
1.07 |
0.98 |
0.95 |
1.09 |
1.08 |
1.04 |
1.01 |
1.10 |
|
2011 (summer days) |
||||||||||||
|
disturbed |
1.05 |
1.01 |
1.18 |
1.03 |
1.06 |
0.94 |
1.05 |
1.04 |
1.12 |
1.16 |
1.03 |
1.19 |
|
quiet |
0.95 |
0.98 |
1.00 |
0.95 |
1.07 |
1.08 |
1.05 |
1.07 |
0.96 |
1.02 |
1.01 |
1.06 |
As an example, we present a table element (Table 2) that compares several days of summer seasons of the above mentioned years.
We have obtained the following results:
-
• 2003. In summer, there were 75 geomagnetically disturbed days and 13 quiet ones. In most cases during disturbances, differences in magnitude did not exceed 10 %. Less than in 1/3 of the disturbed days, deviations from model values ranged from 10 to 20 %. On the quiet days, differences in magnitude were less than 10 %.
-
• 2007. In summer of the geomagnetically quietest year, there were 26 disturbed and 65 quiet days. On most of the quiet days (51), differences were less than 10 %, only for 15 days there were changes up to 20 %. For days with disturbed geomagnetic conditions, the differences were also within 10%.
-
• 2011. In summer of this year, there were quite a few days without measurements. We have compared calculations for 22 disturbed and 32 quiet days. There were only 6 cases on the disturbed days with deviations in magnitude exceeding 10 %. On all the other days – both disturbed and quiet – the differences did not exceed 10 %.
In most cases, the comparison between quiet days of summer seasons of the given years shows a fairly good agreement – within ± 10 %. During the disturbed periods, there were differences ±10–20 %, and higher in some cases. This suggests that the model quite well describes the thermosphere over Norilsk under quiet conditions of summer seasons and not always properly describes it during disturbances.
Comparison with experimental GUVI measurements
The calculated [O]/[N2] ratios were compared to values obtained with maps drawn from GUVI spectrometer measurements []. These maps provide global coverage of Earth’s daytime mesosphere and lower thermosphere (at 60–180 km). The comparison was made for summer days with quiet and geomagnetically disturbed conditions for the above three years: 2003, 2007, and 2011. It is rather difficult to achieve accurate comparison because it can be made only qualitatively by color gradation on a map. Besides, often there were no measurements (for example, in August 2007 and 2011). Nevertheless, we can note a quite reasonable agreement between our average ratios and GUVI values in summer seasons: in 2003 and 2007 estimates by GUVI are 0.2–0.3; in 2011, 0.1–0.25, which is comparable with our values. Let us present a table fragment to compare a few summer days of the three years (Table 3).
COMPARING RESULTS (STATIONS NORILSK AND IRKUTSK)
Expansion and upwelling of the neutral atmosphere in auroral latitudes are caused by heating during geomagnetic disturbances. At ionospheric heights, this manifests itself in the increasing density of molecular masses of [N 2 ] and [O2] and the decreasing atomic mass of [O], as inferred from satellite measurements [Goncharenko et al., 2006]. Expansion of the neutral atmosphere at high latitudes leads to significant changes in the dynamics of the entire thermosphere. This produces the equatorward wind that transfers the changes in the neutral composition from polar to lower latitudes. The wind mechanism is also responsible for the seasonal dependence and penetration of the decreased [O/N 2 ] into lower latitudes: the daytime averaged wind in summer is directed toward the equator and sustains propagation of [O/N 2 ] to lower latitudes, whereas the winter circulation restricts the equatorward movement.
Accordingly, we can expect that at the station Norilsk the estimated ratios [O 2 ]/[O] in some seasons will appear to be higher, and the estimated [O]/[N2] will be lower than those at the station Irkutsk because Norilsk is located far to the north. This assumption is confirmed by the comparison of our estimated ratios [O]/[N2] and [O2]/[O] from the station Norilsk with analogous values from the station Irkutsk, which have been previously obtained [Kushnarenko et al., 2015] over the same period (2003–2013) (Table 4).
The average [O]/[N 2 ] in Irkutsk are by 10–25 % higher than those in Norilsk (see Table 4) in all seasons throughout the period under quiet conditions. During disturbances, these excesses are up to 35 % in fall and up to 25 % in other seasons. In Norilsk, as in Irkutsk, under quiet and disturbed conditions, the highest values of [O]/[N2] were observed in winter and the lowest ones in summer and fall throughout the period.
Values of [O 2 ]/[O] exceed those obtained in Irkutsk, under quiet and disturbed conditions by 30–70 % in winter and by 10–25 % in fall. Spring values of [O 2 ]/[O] for 2003–2006 are also higher in Norilsk. In summer, the situation is reversed – values in Irkutsk are higher over almost the whole period. In Norilsk under quiet and disturbed conditions, the highest values of [O 2 ]/[O] were recorded in winter; the lowest ones, in fall. In Irkutsk under quiet and disturbed conditions, the highest values were acquired in summer; the lowest, as in Norilsk, in fall.
Table 3. Comparison of mean [O]/[N 2 ] with GUVI values
|
2003 |
2007 |
2011 |
||||||
|
date |
[O]/[N 2 ] calc |
[O]/[N 2 ]GUVI |
date |
[O]/[N 2 ] calc |
[O]/[N 2 ] GUVI |
date |
[O]/[N 2 ] calc |
[O]/[N 2 ] GUVI |
|
02.06. |
0.177 |
0.200 |
7.06. |
0.182 |
0.200 |
01.06 |
0.193 |
0.250 |
|
03.06. |
0.182 |
0.200 |
11.06 |
0.184 |
0.200 |
02.06 |
0.182 |
0.250 |
|
04.06. |
0.193 |
0.200 |
14.06. |
0.186 |
0.200 |
03.06 |
0.199 |
0.250 |
|
29.06. |
0.178 |
0.200 |
25.06. |
0.184 |
0.300 |
04.06 |
0.202 |
0.300 |
|
30.06. |
0.188 |
0.300 |
26.06. |
0.181 |
0.300 |
05.06 |
0.199 |
0.200 |
|
02.07. |
0.186 |
0.200 |
27.06. |
0.186 |
0.300 |
06.06 |
0.190 |
0.250 |
|
03.07. |
0.184 |
0.200 |
28.06. |
0.174 |
0.300 |
07.06 |
0.213 |
0.300 |
|
04.07. |
0.170 |
0.200 |
29.06. |
0.167 |
0.200 |
11.07 |
0.200 |
0.250 |
|
05.07. |
0.175 |
0.200 |
01.07. |
0.182 |
0.300 |
12.07 |
0.182 |
0.200 |
|
07.07. |
0.182 |
0.200 |
02.07. |
0.193 |
0.200 |
13.07 |
0.174 |
0.150 |
|
23.08. |
0.161 |
0.100 |
03.07. |
0.191 |
0.200 |
19.07 |
0.202 |
0.200 |
|
24.08. |
0.174 |
0.100 |
05.07. |
0.185 |
0.200 |
20.07 |
0.167 |
0.150 |
|
25.08. |
0.181 |
0.200 |
06.07. |
0.183 |
0.200 |
22.07 |
0.177 |
0.150 |
|
26.08. |
0.187 |
0.200 |
07.07. |
0.175 |
0.200 |
26.07 |
0.182 |
0.200 |
|
28.08. |
0.164 |
0.200 |
08.07. |
0.191 |
0.200 |
28.07 |
0.188 |
0.200 |
|
29.08. |
0.181 |
0.200 |
09.07. |
0.171 |
0.300 |
29.07 |
0.180 |
0.150 |
|
30.08. |
0.166 |
0.200 |
10.07. |
0.183 |
0.300 |
30.07 |
0.190 |
0.150 |
Table 4. Mean ratios obtained at the station Irkutsk in individual years
|
Year |
F 10.7 |
[O]/[N 2 ] |
|||||||
|
winter |
spring |
summer |
fall |
||||||
|
disturbed |
quiet |
disturbed |
quiet |
disturbed |
quiet |
disturbed |
quiet |
||
|
2003 |
128 |
0.195 |
0.329 |
0.226 |
0.232 |
0.164 |
0.191 |
0.252 |
0.270 |
|
2007 |
74 |
0.208 |
0.290 |
0.235 |
0.240 |
0.198 |
0.208 |
0.220 |
0.244 |
|
2011 |
113 |
0.260 |
0.278 |
0.224 |
0.254 |
0.193 |
0.206 |
0.229 |
0.253 |
|
[O 2 ]/[О] |
|||||||||
|
2003 |
128 |
0.897 |
0.423 |
0.528 |
0.466 |
0.805 |
0.523 |
0.504 |
0.442 |
|
2007 |
74 |
0.479 |
0.454 |
0.547 |
0.500 |
0.638 |
0.665 |
0.506 |
0.456 |
|
2011 |
113 |
0.463 |
0.440 |
0.512 |
0.474 |
0.551 |
0.505 |
0.382 |
0.341 |
CONCLUSION
The study of the [O]/[N 2 ] and [O 2 ]/[O] ratios obtained from experimental vertical sounding data at the station Norilsk over the period 2003–2013 leads to the following conclusions.
-
1. The ratio [O 2 ]/[O] under quiet and disturbed conditions by the end of 2013 decreases in all seasons from 10 to 20 % with respect to the values of 2003.
-
2. The average [O2]/[O] ratios under disturbed conditions exceed those, obtained under quiet conditions, in all seasons throughout the period by 10–25 %.
-
3. For [O]/[N 2 ] under quiet and disturbed conditions in all seasons there is an increase (to 17 %) by 2013 compared to the values acquired in 2003.
-
4. In quiet and disturbed conditions, the highest values of [O]/[N 2 ] and [O 2 ]/[O] throughout the period were recorded in winter; the lowest, in fall and summer.
-
5. In most cases, the comparison of our estimated [O]/[N 2 ] with those calculated by the MSIS model yields
-
6. We have obtained a fairly good correlation between our average [O]/[N2] and similar GUVI values for summers of 2003, 2007, and 2011.
-
7. The results of the comparison with values acquired at the station Irkutsk:
good agreement: within ± 10 % for quiet days in summers of the three years under study. During disturbed periods, the differences are ± 10–20 %. This suggests that the model quite well describes the thermosphere over Norilsk under quiet conditions of summer seasons.
-
• The values of average [O]/[N 2 ] under quiet conditions in Norilsk are by 10–25 % lower than those obtained in Irkutsk in all seasons throughout the period, whereas during disturbances they are lower by 20–35 %.
-
• The values of [O 2 ]/[O] in Norilsk exceed those obtained in Irkutsk under quiet and disturbed conditions by 30–70 % in winter and by 10–25 % in fall. In springs 2003–2006, [O 2 ]/[O] is also higher in Norilsk.
Список литературы Долговременные изменения в нейтральном газовом составе термосферы над Норильском (2003-2013 гг.)
- Данилов А.Д. О молекулярном азоте в верхней атмосфере//Искусственные спутники Земли. АН СССР. 1961. Вып. 10. С. 98-101.
- Кушнаренко Г.П., Кузнецова Г.М., Колпакова О.Е. Оценки отношений основных газовых составляющих во время сильных и умеренных геомагнитных возмущений в период спада и минимума солнечной активности//Солнечно-земная физика. 2011. Вып. 19. С. 134-139.
- Кушнаренко Г.П., Яковлева О.Е., Кузнецова Г.М. Долговременные изменения в нейтральном газовом составе термосферы над Иркутском//Солнечно-земная физика. 2015. Т. 1, № 4. С. 30-34 DOI: 10.12737/13457
- Щепкин Л.А., Кузнецова Г.М., Кушнаренко Г.П. Оценки относительного содержания атомов и молекул кисло-рода на высоте 120 км по данным ионосферных измерений//Геомагнетизм и аэрономия. 2009. Т. 49, № 4. С. 350-353.
- Щепкин Л.А., Кушнаренко Г.П., Кузнецова Г.М. Возможность оценок относительного содержания атомов и молекул кислорода по данным измерений электронной концентрации в средней ионосфере//Геомагнетизм и аэ-рономия. 2008. Т. 48, № 1. С. 129-133.
- Щепкин Л.А., Кушнаренко Г.П., Кузнецова Г.М., Фрейзон И.А. Зависимость параметров средней ионосферы от солнечной и геомагнитной активностей. 1. Степень развития слоя F1//Геомагнетизм и аэрономия. 1998. Т. 38, № 5. С. 72-76.
- Щепкин Л.А., Кушнаренко Г.П., Фрейзон И.А., Кузнецова Г.М. Связь электронной концентрации в средней ионосфере с состоянием термосферы//Геомагнетизм и аэрономия. 1997. Т. 37, № 5. С. 106-113.
- Goncharenko L., Salah J., Crowley G., et al. Large variations in the thermosphere and ionosphere during minor geo-magnetic disturbances in April 2002 and their association with IMF By//J. Geophys. Res. 2006. V. 111, A03303. DOI: 10.1029/2004JA010683.
- Hedin A.E. MSIS-86 thermospheric model//J. Geophys. Res. 1987. V. 92, N A5. P. 4649-4662.
- Mordovskaya V.G., Ignatyev A.P., Boldyrev S.I., et al. Method of monitoring atomic oxygen and molecular nitrogen composition in the upper atmosphere on XUV images of the Sun//Geomagnetism and Aeronomy. 2010. V. 50, N 5. P. 679-685.
- Tobiska W.K., Eparvier F.G. EUV97: Improvements to EUV irradiance modeling in the soft X-rays and EUV//Solar Phys. 1998. V. 147, N 1. P. 147-159.
- URL: http://guvi.jhuapl.edu/(дата обращения 10 января 2016 г.).
- URL: http://wdc.kugi.kyoto-u.ac.jp/(дата обращения 10 января 2016 г.).
