Driver safety system implementation in Europe

Author: Manthey L., Popov D.M.
Journal: Горные науки и технологии @gornye-nauki-tekhnologii
Section: Технологическая безопасность в минерально-сырьевом комплексе и охрана окружающей среды
Article in issue: 4, 2019.
Free access
In mining industry safety is top priority. There is a request for safety management, risk prevention and operator training. Operator fatigue and distraction leads to dangerous situations. The paper is aimed at reviewing the issues of fatigued or distracted driver operation. This is achieved through creating models in occupational safety strategies. Hereafter the implementation of fatigue and distraction control system within a pilot project is discussed. The pilot project was aimed at collecting realistic operation data from mining industry in Europe. Caterpillar Inc. offers a solution called Driver Safety System (DSS). When driver’s micro-sleep is detected, the system alerts operator through different alarms directly. Dangerous events are also recorded and classified individually in 24/7 monitoring centre. The DSS was tested at European limestone open pit mine with typical working regime. This paper discusses theories, results and transferable insights of the study.
Mining safety, hs models, driver safety system (dss, caterpillar inc.), operator safety, система безопасности водителя (dss, caterpillar inc.)
Short address: https://sciup.org/140248965
IDR: 140248965 | DOI: 10.17073/2500-0632-2019-4-302-308
Внедрение системы безопасности водителя в Европе
В горнодобывающей промышленности безопасность является главным приоритетом. Существует запрос на управление безопасностью, снижение рисков и обучение операторов. Усталость и рассеянность оператора приводит к возникновению опасных ситуаций. Первоначальная наша задача - проиллюстрировать проблему усталости или отвлечения внимания оператора. Сначала это выполняется с использованием моделей в стратегиях охраны труда. Далее обсуждается внедрение системы контроля усталости в рамках пилотного проекта. Пилотный проект был ключевым методом получения актуальных данных по горнодобывающей промышленности Европы. Компания Caterpillar Inc. предлагает решение под названием Система безопасности водителя (DSS). Когда обнаруживается микросон, система напрямую оповещает водителя/оператора посредством различных тревожных сигналов. Опасные события также будут зафиксированы и классифицированы индивидуально в круглосуточном центре мониторинга. Система безопасности водителя (DSS) была испытана в европейском карьере по добыче известняка с типичным режимом работы. В этой статье обсуждаются теории, результаты и полезные выводы и оценки.
Text of the scientific article Driver safety system implementation in Europe
1. Introduction to the subject
Topics and concepts in the field of operational safety are of great importance in mining operations. The reason for this lies in the fact that industrial environment of extractive industry offers a variety of different hazards. These hazards may relate to both employees of mining company and the immediate environment, but also to uninvolved third parties. This all attracts high interest in systems that increase operation safety by detecting risks and counter-acting them by taking appropriate measures [3–7].
1.1. Background
Fatigue detection systems can make an important contribution to increasing safety in the environment of material handling machines. Fatigue and tiredness reduce operator/driver capability to safely and consciously operate a device or a vehicle. Arising driver’s micro-sleep moments results in completely uncontrolled machine movement. Such periods produce tremendous risk to the machine operator, capital goods and the machine immediate environment. A simple example is illustrated in Figure 1, in which general dangerous situation scenario is illustrated by realistic figures [5].
In addition to fatigue, distraction can lead to unsafe condition. If vehicle operator gets distracted for a certain period of time, he or she will not be able to respond to sudden and unexpected events during this time. Again, the assumed loss of control, or at least the limited attention in regards to the safe operation of the machine leads to increased accident risk.
1.2. Problem definition
These negative effects resulting from tiredness and their frequency are generally not observable or assessable by management and other responsible persons for occupational safety. Dealing with fatigue and distraction is therefore the problem of the device operator himself only; his full commitment and ability to operate safely in the work environment is almost taken for granted. At the same time, operators/drivers usually have little opportunity in this respect to receive more favorable conditions (e.g. shift schedule or breaks) [6].
1.3. Basic project objectives and project partners
Basically, it should be noted that fatigue as natural condition, which can be never completely excluded. The same applies to the downstream consequences such as micro sleep. The goal must therefore be to improve the operational condi- tions and to early detect fatigue signs. The aim is to reduce frequency of dangerous situations in the long term. Such strategies are discussed in the context of Occupational Safety and Health (OSH) strategies.
Safety is also a top priority within Caterpillar Inc.; that is why the Caterpillar Safety Services division was established. In addition and under the agreement with the TU Bergakademie Freiberg, two surveys were performed in this field. Among other things, various models of occupational safety should be produced and analyzed in the case study. Unfortunately, insufficient attention is paid to fatigue issues and consequences in recent investigations and regulations, although it produces ubiquitous and everyday impact on work outcomes and safety.
2. Detailed consideration of the problem
During micro sleep no decision can be made. Self-explanatory visual impressions are not consumed and processed by the (largely) “disabled” sensory organs. Thus, operator misses the most important information for controlling vehicle/device/machine or piece of equipment. Realistic consequences of this may be as follows:
- accidents as a result of braking too late, driving obstacles;
- leaving haul road and collision with a berm or facilities in the immediate vicinity of the hauling way;
- leaving due lane towards the opposite lane and collision with oncoming vehicles;
- Vehicle going downhill due to misjudgment and slow reaction;
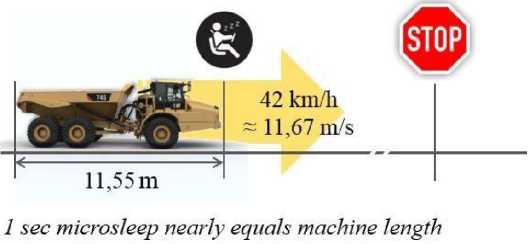
Fig. 1. Simple illustration of the basic problem as an introduction to the topic [5]
- dangerous actions (abrupt acceleration, mistaken wheel turning) when suddenly waking up;
- incorrect operation of vehicle (sudden acceleration, sudden deceleration, wrong getting into gear, etc.).
2 .1. Investigation: Dangerous time2 .2. Investigation: Frequency of hazardous situations
2.2.1. Essentials
2.2.2. In-depth scheme: intervention thresholds
An initial rough consideration of the problem would suggest that fatigue events occur exclusively or at least for the most part in night shifts, whereas distraction does not strictly depend on shift/time of day. However, this consideration would be too simple and does not correspond to the data available from comparable studies [1, 4, 6, 8, 10].
Previous studies in similar environments showed that fatigue-related accidents should not be considered as a phenomenon of late work or night shifts. Instead, the accidents timedistribution is almost even, with an exception of rising in the afternoon hours. One of identified reasons for this is the influence of circadian rhythms. Circadian rhythms describe human performance for 24-hour day and is colloquially referred to as the "internal clock". According to these rhythms, human activity (performance) decreases in the afternoon hours [10]. If one compares the accident curve with the performance curve, the congruence of these curves suggests the existing correlation.
The main objective of the investigations in the field of risk assessment related to fatigue and distraction accidents was determining their frequency. Thereafter, implementing intervention
(correction) measures/mechanisms results in decreasing frequency of the situations that are considered hazardous. Basically, when assessing risk, complete safety can never be reached. In any case, a residual risk remains. A certain risk must therefore be within the range that is adopted as an admissible risk (Fig. 2).
So far, individual fatigue-related operation accident events cannot be correctly counted, since fatigue impact is seen in most of accidents occurring. If quantitative assessment is impossible, the need for qualitative assessment arises. In this field, vehicle/machine operator should evaluate himself his operating condition and arising related risks in each situation. On the other hand, a company must set and evaluate long-term safety objectives and strategies. Such approach allows to outline boundaries/boundary conditions, when the need for response/mitigation actions and their scope become apparent.
For an identified hazard, a chain of correction actions emerges, which is illustrated in Fig. 3, complementing Fig. 2 above.
Fig. 2 shows that a risk resulting from hazardous behaviour is divided into individual segments from low to high in magnitude. The transitional areas of these segments show "alarm threshold" and "danger (hazard) threshold". To determine danger threshold, specific limiting or guiding values are usually proposed. For the case in point, however, no specific figures are available. Data of in-house risk assessment and the associated accident frequency allow to determine area, to which a fatigue-related risk of accidents belong.
DANOEKOUB BEHAVIOUR
May lead to a harm
Safety
Considered safe
Danger
Will lead to harm admissible
inadmissible
RISK THRESHOLD
Fig. 2. Representation of the concepts of safety, dangerous behavior and danger [11]

Quantitative:
i.e limits, guidlines, critical values
Qualitative:
— i.e. requirements, basic duties
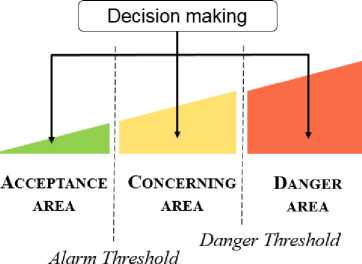
Fig. 3. Scheme for risk assessment [11]
3. Assessing/predicting and displaying risks
However, since qualitative risk assessment depends on individual perception of each, the need arises to quantitatively describe risk using figures and formulas. The best way is to apply formulas proposed in [11], which assess risk based on probability of occurrence and damage severity, see Equation 1 below:
Risk = Probabilit y * Damage;
Damage Event Damage (1)
Time interval = Time interval Event .
3.1. Probability
Assessment of the likelihood of occurrence is based on Table 1, which makes both qualitative and quantitative grading possible. It is important that realistic framework is chosen, first of all, the period under consideration, which reflects the type of work and time periods. The typical period for reviewing is one calendar year.
In the present study, the probability of hazardous micro sleep event occurrence is considered. Through a fatigue detection system (here: Driver Safety System) these events should be minimized. For a correct detection of the actual state before the introduction of a fatigue detection system, it will be necessary to record the number of events via the system, without any feedback to the device operator in this test period. Based on these figures, the actual hazard for the operation becomes visible. In the course of a project, all actual hazardous situations and also near misses, which for various reasons did not lead to an accident, must be taken into account.
In the present study, the micro sleep event probability is considered. Through fatigue detection system (hereinafter, Driver Safety System) these events should be minimized. For correct detection of actual state, before introduction of the fatigue detection system, record a number of such events should be detected in recorded in the system, without any feedback to a vehicle operator in this test period. Based on these data, the actual hazard for the operation becomes visible. In the course of the project, all actual hazardous situations and also near misses, which for various reasons did not lead to accident, should be taken into account.
Table 1
Assessment of probability of occurrence [11]
|
Qualitative |
Quantitative |
|
Impossible |
0 |
|
Almost impossible |
10 -5 = 0.00001 |
|
Possible but unlikely |
10 -4 = 0.0001 |
|
Occasionally possible |
10 -3 = 0.001 |
|
Highly possible |
10 -2 = 0.01 |
|
Almost imminent |
10 -1 = 0.1 |
|
Inevitable 1 |
1 |
Representation of (health) damage severity [11]
|
Severity |
Description |
Example of consequence |
|
A |
No health impact consequences |
no injury small cuts |
|
B |
Petty consequences (work can be continued) |
|
|
C |
Moderate consequences (temporal loss of ability to work without permanent damage) |
lacerated wound |
|
D |
Heavy consequences (irreparable, permanent damage is possible) |
loss of limbs |
|
E |
Lethal consequences |
fatal injuries |
Table 2
3.2. Damage severity
Besides the hazard event likelihood, the risk assessment also requires more detailed knowledge of the consequences and possible damage severity. An accident may lead to:
1. heavy impact on human (from injury to death - the most impressive impact);
2. machine damage (from repair necessity to total loss), and finally
3. loss of operation performance.
3.3. Risk Assessment and Occupational Safety Models
3.3.1. Risk matrix according to NOHL
Due to the decreased availability of a machine, the requirements for material transport could no longer be satisfied completely. In addition, investigations following an accident may require temporary operation stoppage.
Since occupational safety primarily focuses on an individual or employee, the severity of an accident refers to the injured person's health. Further information is given in Tab. 2.
Up to this point the danger from fatigue remains abstract and barely representable. This results especially from the general situation. Although fatigue and the negative consequences are known, no data recording and analysis are produced. It is therefore impossible to describe the situation using actual figures from operation.
In this case, occupational safety models provide description of the conditions to be assessed. For this purpose, a number of models are available, differing based on the application. As usual for the models, they simplify general situation. As a result, the complexity and multiplicity of different influencing factors considered tend to take a back seat compared to the illustrative presentation. The following models are therefore suitable to form a basic understanding. However, the resulting numerical values or ranges must always be checked for their correlation, taking into account the individual circumstances in actual considered case in real space.
A well-understood and simply structured overview of the relationship between probability of risk occurrence (actualization) and damage severity, as well as the resulting risk is presented in the risk assessment matrix according to NOHL (BG RCI 2016), see Tab. 3.
Table 3
Risk matrix according to NOHL [2, 10]
|
Damage severity (right) |
No health consequence |
Low consequences |
Moderate consequences |
Serious consequences |
Lethal consequences |
|
|
Probability (below) |
A |
B |
C |
D |
E |
|
|
Almost impossible |
1 |
Extremely low (1) Extremely low (1) Very low (2) Very low (2) Very low (2) |
Extremely low (1) Very low (2) |
Very low (2) |
Low (3) Middle (4) |
Middle (4) |
|
Imaginable but unlikely |
2 |
Low (3) Middle (4) |
High (5) |
|||
|
Occasionally pos sible |
3 |
Low (3) Middle (4) Middle (4) |
High (5) Very high (6) |
|||
|
Well possible |
4 |
High (5) Very high (6) Extremely high (7) Very high (6) Extremely high (7) Extremely high (7) |
||||
|
Almost certainly |
5 |
|||||
The risk can be assessed based on information on the probability of occurrence and the severity of the accident. This is performed using values from Tabs. 1 and 2. The result is the matrix in which the hazard starts from the top left and increases towards the bottom right. The actual assessment of the hazard in a European operation will only be possible after completion of the pilot project (see thesis of D. M. Popov).
3.3.2. Presentation of the tripod theory in relation to fatigue
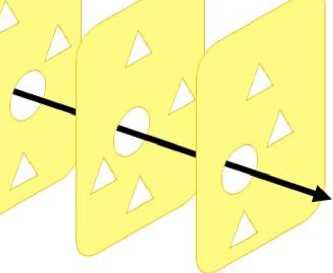
The notion that fatigue alone or a single component of error leads to an accident is criticized by most accident theories [9]. The complexity of possible consideration proves the root cause analysis (RCA). Due to the limited size of this paper, it is not suitable to explain the RCA in more details than the following sentences. Nonetheless the complexity of the facts about fatigue related accidents requires further breakdown in order to make possible effective protection concepts. Therefore, in addition to the previously presented model, the tripod theory is briefly discussed. This assumes that a certain number of preconditions must be fulfilled in order to an accident event to occur. Each individual condition is represented by a punched card. If the errors/defects lie multidimensionally behind one another, a dangerous situation may arise if protective measures are not taken (represented by the filled-in areas of the punched card). A sketch about the tripod theory, which is occasionally referred to as the Swiss-cheese model, is shown in Fig. 4.

Dangerous behaviour triggers, safety lacks, mistakes,
Sequence of developing accident
Safety precautions
Fig. 4: Consequences of error sequences based on the tripod model, the model after REASON [9]
4. Summary of findings from the accident models and initial conclusion
To conclude this section, the following should be noted: fatigue and distraction are able to reduce the driver's attention to such extent that an accident occurs as a result. In this case fatigue shall be considered as top-priority cause of accident risks. Other causes may be organizational as well as have their origin in the inherent health condition of the operator or in operation environment. Human error is dominating cause of operation accidents. Fatigue may be both primary cause or partial reason of a dangerous situation in the process chain, which may result in an accident. In the field of managing tiredness and readiness to work, there is a great potential for reducing dangerous situation and accident rate in a company. Minimizing accident risks shall be based on aforehand detecting fatigue signs at all levels and taking countermeasures to reduce accident risks and mitigate possible accident consequences.
There are possible ways to describe the risk of, first of all, fatigue using OHS models. At the final stage of this initial study, the shortage of realistic figures from the European mining operation should be noted, which are required for the models and for substantiating the assumptions made. That is why this investigation is continued to more precisely assess the operation risks.
References Driver safety system implementation in Europe
- Angelone S. 2019. Driver safety system assessment summary report.
- BG RCI 2016. Gefährdungsbeurteilung: Sieben Schritte zum Ziel.
- Caterpillar. 2015. Fatigue risk assessment.
- Caterpillar. 2018. Fatigue and distraction in management: Improving safety through technology and continuous improvement. 11th edition. [Online] Available at: http://viewpointmining.com/article/fatigue-and-distraction-management.
- Caterpillar. 2018. Fatigue Infographic: Metric Statistics.
- Caterpillar. 2019. DSS progress report #5.
- Caterpillar. 2019. DSS progress report #7.
- Caterpillar Safety Services. 2018. Driver safety system (DSS) fatigue intervention plan (FIP).
- Dagmar D. 2011. Aus Fehlern lernen. Teil I. Nordrhein.
- Evers C. & Auerbach K. 2015. Übermüdung als Ursache schwerer Lkw-Unfälle. Zeitschrift für Ver kehrssicherheit vol. 52: 67-70.
- Gassner W. 2018. Skript zur Vorlesung Arbeitssicherheit: AS 1.VL Einführung. Freiberg (Saxony).
