Drivers of entrepreneurship development in Russia's regions: assessment and the role of spatial interrelations

Author: Shakleina Marina V., Shaklein Konstantin I.
Journal: Economic and Social Changes: Facts, Trends, Forecast @volnc-esc-en
Section: Science, technology and innovation development
Article in issue: 5 т.15, 2022.
Free access
The study examines for the first time the influence of the spatial interaction effects of socioeconomic factors on the entrepreneurship development in the regions. This effect was assessed by constructing a set of spatial models on panel data for 2011-2019. The need to take into account spatial interaction is due to the calculated Moran’s index, as well as the statistical significance of the spatial autoregressive coefficient. In the work, we have built the following models: spatial lag model, spatial error model, spatial lag and spatial error model, Durbin model, and panel regression. The purpose of the simulation is to assess the role of the spatial factor in the entrepreneurship development in Russia’s regions. As a result, we have proposed a system of indicators of entrepreneurial activity, selected the most informative indicators, determined the influence of factors of entrepreneurial activity taking into account and without a spatial lag of dependent and independent variables, and evaluated spatial effects (direct, indirect, general). The article shows that the influence of wages and the unemployment rate on the change in entrepreneurial activity is much greater if spatial interactions are taken into account. The scientific novelty of the research lies in determining the degree and direction of the influence of spatial effects that have an impact on entrepreneurial activity and its factors. The results confirm the importance of using not only regional characteristics, but also spatial and temporal dependencies in the analysis of entrepreneurial activity. We expect that the research results will provide practical information to authorities and administrations seeking to promote the entrepreneurship development at the national level.
Entrepreneurial activity, spatial econometrics, russia's regions, moran's index
Short address: https://sciup.org/147239044
IDR: 147239044 | UDC: 330.59 | DOI: 10.15838/esc.2022.5.83.6
Text of the scientific article Drivers of entrepreneurship development in Russia's regions: assessment and the role of spatial interrelations
The effective development of the entrepreneurial ecosystem in the regions is a prerequisite for the intensive functioning of the entire market environment. Small and medium-sized enterprises (SMEs) form a unified economic structure, increase the middle class size, reduce unemployment, increase budget profitability and strengthen the economic, political and social stability of society.
In recent years, there has been an increasing interest in the geography of entrepreneurial activity, which is manifested in such topics as the placement of firms and their relationship to economic growth (Krugman, 1991), strengthening of the role of geography in the strategic management of firms (Sorenson, Baum, 2003). Of great importance for regional economic development is, first, the location of both new and existing firms (Audretsch, Keilbach, 2004; Fritsch, Mueller, 2008), and second, the spatial dependence of factors of entrepreneurial activity (Acs et al., 2007). We should note that in a number of works by foreign scientists, entrepreneurial activity is understood as the proportion of employees who have an enterprise. Russian statistics do not have this kind of data. Among the Russian official statistical resources, the indicator of the number of small and mediumsized enterprises largely corresponds to the logic of this concept.
Ignoring such aspects as migration, location, dissemination of knowledge and innovation, and capital flow, in modern conditions leads to erroneous judgments. If there are significant changes in economic and social development in some regions, then this affects other regions, especially neighboring ones. “Regional spatial effects are understood as the influence of changes in one region on other regions, and the intensity of this influence depends on the location of the regions relative to each other” (Semerikova, Demidova, 2016). The use of spatial econometrics methods allows taking into account the direct and indirect relationship between observations located in space.
The expediency of modeling the relationships between variables of entrepreneurial activity at the regional level is explained by a number of reasons. Russia has a huge territory; respectively, regions located in different territorial units have different properties and capabilities. The subjects are also characterized by heterogeneity of resource allocation and different working conditions. The possibilities of choosing a field of activity for each region are different; some are focused on the provision of services, others – on heavy industry and manufacturing.
The use of spatial econometrics methods in the work allows taking into account the relationship between a group of regions and their influence on each other because the closer the regions are to each other, the stronger their connection, it means that the easier it will be to flow knowledge, labor and capital. Ignoring the spatial effect in modeling entails bias and inefficiency of estimates of the obtained models.
The purpose of the research is to assess the role of spatial interaction in the entrepreneurship development in the regions.
To achieve the goal, it is necessary to solve the following tasks:
-
1) to develop a system of factors promoting entrepreneurial activity and to select the most informative factors for modeling;
-
2) to determine the factors that have a significant impact on the entrepreneurship development in the regions, based on the assessment of a wide set of specifications of spatial-econometric models;
-
3) to evaluate spatial effects (direct, indirect, general);
-
4) to identify the need to take into account spatial relationships in the development of entrepreneurial activity.
The scientific novelty of the work consists in taking into account the spatial dependence of the factors promoting entrepreneurial activity.
Theoretical and methodological review
The research (Verheul et al., 2002) presents a comprehensive theoretical system that includes factors affecting social welfare and national culture. The possibility of setting up a small business is explained by various institutional determinants, such as political, cultural and social factors.
The presence of entrepreneurial patterns is associated with natural advantages. For example, the creation of the wine industry in California, the location of old towns and settlements near reservoirs is explained by a geographical factor (Kuechle, 2014).
The definition of “spatial dependence” of entrepreneurial activity according to the methodology (Saxenian, 1994) implies geographically interdependent innovation and entrepreneurial activity in geographically close areas. Geographical proximity can facilitate direct interaction, as well as the exchange of geographically limited shared resources, infrastructure and business practices.
The study (Plummer, 2010) discusses why entrepreneurial activity can be spatially dependent and why spatial econometric methods should be taken into account in the study of entrepreneurship. The author notes that new firms in the same sector tend to be geographically grouped and rely more on the regional environment or nearby resources. In addition, spatial dependence in entrepreneurship is caused by migration, interregional trade, spread of technology and knowledge, business clusters in neighboring regions, business norms, as well as social and institutional networks (Audretsch, Keilbach, 2004; Pijnenburg, Kholodilin, 2014).
Spatial dependence is considered in entrepreneurship research, but the time factor is rarely taken into account (Qian, Zhao, 2018). An example of the synthesis of spatio-temporal effects is the work (Hong et al., 2015), where the spatio-temporal dynamics of new manufacturing firms in South Korea is studied. The study combines a number of aspects: spatial heterogeneity caused by regional differences; temporal dependence explained by the synergetic effect of startups; spatial dependence associated with interregional interactions. The result of constructing a spatial model is the proof of the statistical significance of the simultaneous impact of two components: spatial and temporal.
It is worth noting that the spatial econometric approach is also used in other works (Ans et al., 2002; Audretsch et al., 2010; Autant-Bernard, Lesage, 2011; Qian, Haynes, 2014). The authors study the influence of various determinants (human capital, cultural diversity, etc.) of entrepreneurial activity in the context of the study of spatial relationships. There are not so many Russian studies devoted to this problem. Simulation of the spatial effect in the entrepreneurship development is presented in the research (Zemtsov, Tsareva,
-
2018) . However, a significant drawback of most works (including Russian ones) is that the models take into account the spatial dependence of only the explained variable and ignore the spatial relationships of factors of entrepreneurial activity.
The analysis of spatio-temporal interrelations of entrepreneurial activity is impossible without basic assumptions about the composition of its determinants.
For instance, O.I. Obraztsova and E.V. Popov-skaya raise the question of the contextual conditions of the region and argue that the behavior of an entrepreneur can be better understood when studying spatial relationships, institutional, social and community norms in society (Obraztsova, Popovskaya, 2017). The authors discuss the existence of close connection between the entire ecosystem of entrepreneurial activity, identify a number of the most important factors for its analysis: demography, employment and unemployment, standard of living and population resources, business development, investment and investment attractiveness, regional fixed capital resources, security and legal environment, state support for small business development.
The above-mentioned study seems to be the most comprehensive from the point of view of taking into account the factors promoting entrepreneurial activity. Currently, there are a huge number of models that present a view of the problem from one side: institutional factors (Acs et al., 2008; Aparicio et al., 2016), social aspects (Song et al., 2020), technological development level (Qian, Zhao, 2018), geographical aspects (Plummer, 2010; Kuechle, 2014; Hong et al., 2015), etc.
Our research determines a set of basic factors of entrepreneurial activity on the basis of the studied literature. It helps to consider the possibilities of regional business development from all sides (human capital, financial situation, legal environment, level of ICT development, etc.). Let us present the main factors promoting entrepreneurial activity (Tab. 1).
Table 1. Factors promoting entrepreneurial activity
|
Name of the block |
Name of the indicator |
Literature which mentions these factors |
|
Human capital |
Proportion of students in higher education institutions as part of the working-age population, % |
The influence of human capital factors on the entrepreneurship development is noted in the works (Ans et al., 2007; Obraztsova, Popovskaya, 2017; Zemtsov et al., 2021). |
|
Number of doctoral students, people |
||
|
Number of graduate students, people |
||
|
Graduation of students with a certificate of basic general education, people |
||
|
Number of personnel engaged in educational activities under higher education programs, people |
||
|
Number of students enrolled in bachelor’s degree, specialty, master’s degree programs per 10,000 people |
||
|
Financial situation of the population |
Purchasing power of per capita monetary income in relation to the subsistence minimum sets, thousand rubles |
The impact of monetary incomes of the population on the employment growth in the field of entrepreneurship is not unambiguous. On the one hand, the higher the GDP per capita, the higher the number of self-employed (Robson, 1998; Hong et al., 2015). In (Obraztsova, Chepurenko, 2020), it is noted that material factors positively influence involvement in entrepreneurial activity in all types of contextual conditions. The reverse effect is considered in (Wennekers et al., 2005). |
|
Real monetary incomes of the population, thousand rubles |
||
|
Total area of residential premises, on average per inhabitant, m2 |
||
|
Average contribution size (deposit) of individuals on ruble accounts, thousand rubles |
||
|
Population below the poverty line, % |
||
|
Retail trade turnover per capita, thousand rubles |
||
|
Average monthly nominal accrued salary of employees of organizations, thousand rubles |
||
|
R/P 10% ratio, times |
||
|
Share of food expenses in consumer spending of the population, % |
End of Table 1
|
Name of the block |
Name of the indicator |
Literature which mentions these factors |
|
Employment and unemployment |
Unemployment rate, % |
Employment and unemployment indicators are used in most studies on entrepreneurial activity. Their influence is ambiguous (Obraztsova, Popovskaya, 2017; Qian, Zhang 2018; Zemtsov et al., 2021) |
|
Level of economic activity of the population, % |
||
|
Load of the unemployed per vacancy, people |
||
|
Security and legal regulation |
Number of persons, committed crimes in the economic sphere, per 1,000 inhabitants |
High level of personal security and developed legal environment have a direct positive impact on the entrepreneurial activity development (Xheneti, Bartlett, 2012; Obraztsova, Popovskaya, 2017; Zemtsov et al., 2021) |
|
Number of registered premeditated murders and attempted murders per 100 thousand people |
||
|
Number of registered premeditated murders and attempted murders per 100 thousand people |
||
|
Number of robberies per 100 thousand people |
||
|
Number of thefts from citizens’ apartments per 100 thousand people |
||
|
Number of robberies per 100 thousand people |
||
|
Information and communication technologies (ICT) |
Share of Internet users in the total population, % |
The development of digitalization and universal Internet access contributes to an increase in the number of freelancers (Sorgner, 2017) and increases the opportunities of existing small businesses to enter new markets (Shideler, Badasyan, 2012) |
|
Fixed-line telephone density per 100 people, units |
||
|
Share of telephoned settlements in rural areas in the total number of rural settlements, % |
||
|
Number of mobile radiotelephone subscribers, people |
||
|
Number of active subscribers of fixed and mobile broadband Internet access per 100 people |
||
|
Share of households with a personal computer, % |
||
|
Share of households with Internet access, % |
||
|
Innovation Opportunities of the region |
Costs of technological innovations to GRP, % |
Innovative factors, as well as factors of ICT development, have a positive impact on stimulating entrepreneurial activity (Zemtsov, 2020). In particular, in the study (Qian, Zhao; 2018), among the factors of the econometric model, the growth of the number of small enterprises is significantly influenced by the factor “number of patents per 10 thousand employees”. Entrepreneurs’ innovations encourage other entrepreneurs to enter into entrepreneurial endeavors and innovations (Duguet, 2004). Conversely, better economic activity creates new opportunities for entrepreneurs and stimulates innovation. |
|
Internal research and development costs for GRP, % |
||
|
Organizations that have carried out research and development, units |
||
|
Share of personnel engaged in research and development in the total number of employees in the region, % |
||
|
Number of patent applications filed for inventions and utility models per thousand employed in the economy |
||
|
Share of exports of technologies and technical services in the total volume of exports of the region, % |
||
|
Share of imports of technologies and technical services in the total volume of imports of the region, % |
||
|
Demography |
Share of the urban population in the total population (year-end estimate), % |
Demographic factors in econometric models of entrepreneurial activity are noted in the works (Fritsch, Noseleit, 2013; Obraztsova, Popovskaya, 2017; Barinova et al., 2018; Song, 2020, Zemtsov et al., 2021). |
|
Population density, people per km2 |
||
|
Demographic load factor (year-end estimate), persons of disabled ages per 1,000 people of working age |
||
|
Source: own calculation based on Rosstat data and scientific literature. |
||
The most informative factors within each block of entrepreneurial activity are determined on the basis of S.A. Ayvazyan’s methodology for selecting informative private criteria among the indicators of the a priori set of each integral property (Ayvazyan, 2012).
The general methodological scheme is as follows.
-
1) Calculation of matrices of values of pairwise correlation coefficients separately for each block of factors promoting entrepreneurial activity. The analysis of the numerical characteristics obtained makes it possible to conduct a preliminary stage of identifying closely related pairs, triples, etc. groups of variables within each block (Ayvazyan, 2012). Then, by calculating the coefficient of determination, the issue of selecting one representative from each block is solved.
-
2) Calculation of the coefficients of determination R 2 of each of the indicators of the a priori set for all other indicators that are part of the analyzed block of factors of entrepreneurial activity.
Let us define the quantitative composition ( p, ) of a reduced set of indicators of a certain integral property (for example, the block “Demography”) p, < p. A reduced set of indicators is considered informative if the maximum value of the coefficient of determination is found:
max^R 2 (x(l); (x (i1) , .„, x^)}, (1)
where x (i1) ,..., x^ ' — shortened set of indicators of the block “Demography”;
R 2 – coefficient of determination of each of the particular criteria x ® (indicators of entrepreneurial activity within the corresponding block l – “Demography”) with all other private criteria of the block.
As a result, we have selected the most informative indicators for each block:
– the block “Human Capital” represents the number of students enrolled in bachelor’s, specialty, master’s degree programs per 10,000 people (hereinafter referred to as stud);
– the block “Financial situation of the population” show the average monthly nominal accrued salary of employees of organizations, thousand rubles (hereinafter – wage);
– the block “Employment and unemployment” – the unemployment rate, % (hereinafter – unemp);
– the block “Security and legal regulation” – the number of persons who have committed crimes in the economic sphere, per 1,000 inhabitants (hereinafter – safety);
– the block “ICT” – the number of active subscribers of fixed and mobile broadband Internet access per 100 people (hereinafter – Internet);
– the block “Innovative opportunities of the region” – internal costs of research and development to GRP, % (hereinafter – innovation);
– the block “Demography” – population density, people per sq. km (hereinafter – demogr).
In the future, the most informative indicators will be used at the stage of building spatial models.
Let us consider the main simulation stages.
1. Selection of the weighing matrix. The apparatus of spatial econometrics allows taking into account the spatial structure due to the inclusion in the weighted value model of the indicator in other regions (spatial lag). To do this, a “weighing matrix” W = (wt j ) is introduced into the model, its elements are determined based on the following rules:
-
a) presence or absence of a common border with neighboring regions (binary matrix):
W ‘J = {,
-
1, if the object i has a common border with the object j, о 0, if the object i doesn't have a common border with the object j.
-
b) inverse distance between pairs of regions:
wu= (.
-
2. Building a global Moran’s index is a check of spatial dependencies. This index is determined by the formula:
' 0, if i = j, -1,ifi * j, . du where dtj — is the distance between the regions’ administrative centers by rail or automobile roads in kilometers.
It is worth noting that the priority in the course of creating spatial models for Russia is the inverse distance matrix, which was proved by E.V. Seme-rikova, O.A. Demidova (Semerikova, Demidova, 2015) using the Monte Carlo method; the coefficient shift was minimal.
The inverse distance matrix captures the connection between regions better than the binary one, since there are regions with a large area in Russia (mainly the eastern part), while the presence of borders with neighbors does not oblige regions to exchange knowledge and, accordingly, entrepreneurial experience. In the western part, where the distances are much smaller, the knowledge flow can be carried out more efficiently so we have used the inverse distance matrix in the work.
At the same time, too high proximity degree can lead to blocking effects (Qian, Zhi, 2018), when the low development rate of firms in one region restricts the development of firms in nearby regions. Thus, there is no knowledge flow, but only barriers are created that hinder effective entrepreneurial development. However, the situation described above is more common when a more developed region enters the markets of a less developed neighbor to increase sales markets, so underdeveloped regions try to be similar in terms of the development rate of institutional conditions with a possible donor region.
. = Т^^цХ-Х )(x j -X)
g ^Uxi-^U^wij ,
where wtj — elements of the weight matrix W ;
N – number of observations in space (in our case, number of Russia’s regions);
X — average value;
X , , X j — i and j values of variables in regions i and j .
The significance of the indicator is calculated by the formula:
МШ)
SD[I] 1
where £"[/] — mathematical expectation;
SD [/] — standard deviation.
If the indicator is nonzero and statistically significant, then we can talk about the presence of spatial dependence. Moran’s index varies from -1 to 1. If it is close to 1, then there is a positive relationship, if to -1, then a negative relationship.
-
3. Construction of panel regressions and spatial models. We have built the following specifications in the work:
-
a. Panel regression with bidirectional effects:
Y = aIN + Xtp + 7 + д + ut , (4)
where Yt — vector of dimension N x 1 values of the endogenous variable – the number of small enterprises in Russia – at time t ( t = 2011, 2012, ..., 2019),
N – total number of observation objects (77 Russia’s regions), aIN — vector of dimensionN x 1 values of the constant α,
Xt — vector of dimension N x K of explanatory variables – factors of entrepreneurial activity – at time t , where K is the number of explanatory factors, β – vector of estimated parameters of dimension K x 1,
η – time-constant regional effects (regional heterogeneity),
µ – fixed time effects, ut – error vector of the model of dimension N x 1 at time t.
-
b. Spatial autoregressive model (SAR) takes into account the interaction of the dependent variable between the sample elements:
Yt = aIN + Xtp + pWYt + n + p + ut, (5)
where WYt – spatial lag of the dependent variable (global effects of entrepreneurial activity),
W – matrix of spatial weights of dimension N x N ,
ρ – spatial autoregressive coefficient, spatial dependence strength of the dependent variable among observations.
-
c. Spatial error model (SEM):
Yt — otl ^ + Xtp + ] + jH + U t , where ut — AWut + £t,
where Wut – spatial lag in regression errors, λ – spatial correlation coefficient in regression errors, which measures the strength of the autocorrelation of spatial errors.
e — vector of dimension N x 1 of equally and independently distributed error terms with zero mean and variance σ 2.
-
d. The spatial autoregressive model and spatial autoregressive combined model (SAC) is a generalization of the two previous models:
Yt = aIN + Xtp + pWYt + p + it + ut , where ut = AWut + £t .
-
e. Spatial Durbin Model (SDM) – includes spatial lags of both dependent and independent variables:
Yt = aIN + Xtp + pWYt + WXt0 + ] + p + ut, (8)
where WXt – spatial effects of the factors of entrepreneurial activity,
-
θ – vector of unknown parameters of dimension K x 1.
-
4. Next, we build different types of specifications within each model – with fixed and random effects.
-
5. After that, we perform the LeSage’s and Pace’s test on 0 = 0 and p ^ 0 to identify the best model among SDM vs SAR.
-
6. Elhorst test on θ = – βρ to identify the best model among SDM vs SEM.
-
7. Next, we calculate the AIC and BIC criteria for comparison and selection of the best model among the obtained ones.
-
8. According to the obtained best model, direct, indirect, and general effects are calculated for its interpretation.
H0: 0 = 0 and p ^ 0, it means that the coefficients of modification of the SDM model are 0, respectively, this model does not differ from the SAR model.
H1: 0 ^ 0 and p ^ 0, it means that the coefficients of modification of the SDM model are not equal to 0; respectively, this model differs from the SAR model.
H0: θ = – βρ , it means that the coefficients of modification of the SDM model are equal to the coefficients of the SEM model, respectively, the SEM model is the best model compared to SDM.
H1: 0 Ф — вр , it means that the coefficients of modification of the SDM model are not equal to the coefficients of the SEM model, respectively, the SDM model is a better model compared to SEM.
Data and preliminary analysis
This paper uses data from the official statistical resource Rosstat for 2011–2019 for 77 Russia’s regions.
In total, there are 87 observed objects in Rosstat collections, the Arkhangelsk Oblast (it is divided into 2 objects) and the Tyumen Oblast (it is divided into 3 objects) are aggregated.
We have excluded the following observed objects:
-
1) cities of federal significance (Moscow, Saint Petersburg) and Chukotka Autonomous Okrug due to the extreme values for financial and economic indicators, which are presented in Table 1, in particular the blocks “Financial situation of the population” and “Innovative opportunities of the region”;
-
2) The Republic of Crimea and Sevastopol due to the lack of data in the period 2010–2014;
-
3) Nenets Autonomous Okrug and the Arkhangelsk Oblast without NAO, as the information are aggregated for the Arkhangelsk Oblast;
Table 2. Descriptive statistics and correlations of model variables*
stud
wage
unemp
safety
internet
innovation
demogr
stud
1
wage
-0.31
1
unemp
-0.05
-0.16
1
safety
-0.02
0.18
0.16
1
internet
0.25
0.27
-0.48
-0.15
1
innovation
0.27
-0.01
-0.27
-0.14
0.25
1
demogr
0.16
-0.63
-0.18
-0.46
-0.11
0.21
1
Mean
233
39,307
5.55
0.3
19.52
0.63
30.19
Median
229
35,212
4.75
0.29
20.2
0.37
23.46
S.D.
80
13,686
3.95
0.11
6.16
0.8
30.85
Min
36
26,835
2.21
0.14
1.5
0
0.3
Max
533
94,856
33.75
0.74
37.5
5.46
173.5
* Compiled from the 2019 data.
Source: own calculation based on Rosstat data.
-
4) Khanty-Mansi Autonomous Orkug, Yamal-Nenets Autonomous Okrug and the Tyumen Oblast excluding KhMAO and YaNAO, as the information is aggregated for the Tyumen Oblast.
The number of observed objects in the study is 77 units. We excluded the period 2020–2021 due to the structural changes in the data, which are caused by the impact of the pandemic and its consequences on the business processes of entrepreneurial ecosystems. In particular, this is the transition of trade to online mode, changing channels and geography of supplies of intermediate consumption products, approaches to marketing and promotion of goods, etc.
Next, we will present an empirical analysis of the incoming variables of the model and analyze the matrix of pairwise correlation coefficients and standard descriptive statistics (Tab. 2).
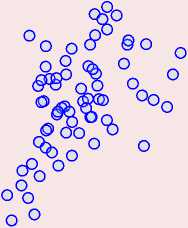
Figure 1. Dependence of the number of SMEs on GRP per capita in 2019
70 A Novosibirsk Oblast

Kaliningrad Oblast
о Sverdlovsk Oblast
Magadan Oblast
о о Republic of
Sakha (Yakutia)
Sakhalin Oblast
Tyumen Oblast
500 000
1 000 000 1 500 000
2 000 000 2 500 000
Gross regional product per capita, rubles
Source: Federal State Statistics Service data .
The matrix of the pairwise correlation coefficients of factors promoting entrepreneurial activity indicates the absence of multicollinearity between the analyzed variables. Similar matrices for previous periods also showed the absence of multicollinearity. The analysis of descriptive statistics allows saying about the high variability of variables wages, unemployment, research and development costs, and population density. The degree of interregional differences is great not only in the dependent variable – the number of small and medium-sized enterprises, but also in its factors. This indicates the need to use a weighing matrix for the analyzed variables in the models.
In general, concentration of the analyzed trait is high and is in the range from 4 to 62 units of SMEs per 1,000 people of the economically active population (Fig. 1 ). They are mainly concentrated in regions with low and moderate GRP rates per capita. However, for regions with a high GRP rate per capita, for example, the Sakhalin and Tyumen oblasts, there is an average level of the number of SMEs per 1,000 economically active population.
Simulation results
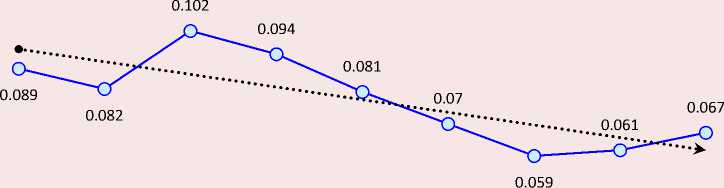
The need to use spatial models caused the results of the construction of the Moran’s index. There is a stable spatial positive correlation of the dependent variable – the number of small and medium-sized enterprises (Fig. 2) . This result means that the regions of Russia can be divided into patterns of entrepreneurial activity: regions with a high value of the number of small and medium-sized enterprises (CFD), regions with a low value (North Caucasus).
Table 3 shows the simulation results. We have constructed the main specifications of spatial models based on panel data: SAR, SAM, SDM, and SAC. We have carried out simulation in the STATA package; we have found estimates of spatial models using the maximum quasilikelihood estimation (MQLE), which is the basis of the xsmle package (Belotti et al., 2017). Before simulation, we prologarithmed all indicators. This procedure is standard in research and allows scaling variables and reducing high variation, which leads to heterogeneity in model errors (Hong et al., 2015). We have already mentioned that the non-
Figure 2. Moran’s index for the period from 2010 to 2018
0.12
0.1
0.08
0.06
0.04
0.02
■>
Source: own calculation according to Rosstat data.
Table 3. Results of the evaluation of spatial panel models based on data for 2011–2019 using robust standard errors (N = 693)
Within each specification, we have considered models with fixed and random effects. To choose the best model among them, we used the Durbin – Wu – Hausman test on the uncorrelation of errors and regressors. If the hypothesis is not rejected, then random effects are used (hence, GLS is used to find estimates of coefficients), otherwise, a model with fixed effects (within transformations and OLS to find estimates). Taking into account the data in Table 3, we can conclude that at the 5% significance level, preference is given to models with fixed effects (models 2, 4, 6).
We carry out further selection between model specifications by conducting tests on the significance of the coefficients facing the corresponding spatial lags.
Following the strategy described in LeSage’s and Pace’s works (LeSage, Pace, 2009) and Elhorst (Elhorst 2010), researchers should start checking specifications with SDM as a general specification and analyze whether it is possible to simplify SDM to SAR or SEM. Further, LeSage’s text makes a choice between the SDM (model 6) and the SAR (model 2). The conducted test proved that the best model is the SDM model (chi-squared = 190.4, Prob > chi2 = 0.000).
The Elhorst test for θ = – βρ allows determining the best model among SDM (model 6) and SEM (model 4). As a result of the test chi-square = 175.7, Prob > chi2 = 0.000, the null hypothesis is rejected and the choice is made in favor of the SDM model.
Analyzing the estimates of model 6, we can notice a significant spatial effect of two variables: the unemployment rate and wages. Studies conducted earlier excluded this aspect of the problem from the analysis. The resulting spatial dependence of not only the dependent variable – the number of new small enterprises, but also the factors that form it, indicates that the policy pursued in relation to the entrepreneurship development should be built taking into account the analysis of the size of average wages and the unemployment rate in neighboring regions, since these factors have strong spatial relationships and influence on entrepreneurial activity.
We carry out the comparison of the SDM and SAC models on the basis of the Akaike information criterion (AIC) and Bayesian information criterion (BIC). The SAC model has slightly lower information criteria, which makes it advisable to use this type of specification for further discussion and interpretation.
In this model, the spatial lag of the dependent variable ( ρ ) and the spatial error correlation ( λ ) are statistically significant. The spatial correlation coefficient is significant and the corresponding estimate is positive. This indicates that the entrepreneurial activity growth in one region entails the entrepreneurship development in other regions.
In order to interpret the obtained estimates of spatial models, we turn to the calculation of direct, indirect and general effects (Tab. 4) . We give interpretation only for statistically significant effects.
Despite the fact that SAC turns out to be the best model by quality criteria, the interpretation will be given to SAC and SDM, since SDM is not much inferior to SAC in quality, and the calculated direct and indirect effects are close.
The direct effect is interpreted as the average change in the number of new small enterprises in the region when the corresponding explanatory factor changes in the same region. The indirect effect (spill-over) is the average change in the number of new small enterprises in a region when the corresponding explanatory factor changes in all other regions. The general effect is determined by the sum of direct and indirect effects; in our case, this is the average change in the number of
Table 4. Direct, indirect, general effects of the SDM and SAC models
|
Variable |
SDM |
SDM |
SDM |
SAC |
SAC |
SAC |
Panel-FE |
|
Direct |
Indirect |
General |
Direct |
Indirect |
General |
||
|
Number of students enrolled in bachelor’s, specialist, and master’s degree programs |
-0.119* |
0.221 |
0.102 |
-0.138*** |
-0.564* |
-0.702** |
-0.234** |
|
Average monthly nominal accrued salary of employees of organizations |
-0.169 |
1.308** |
1.139** |
0.210*** |
0.900 |
1.110 |
0.392*** |
|
Unemployment rate |
0.0254 |
0.556* |
0.581* |
0.0163 |
0.0766 |
0.0929 |
0.0108 |
|
Economic crime per 1,000 inhabitants |
0.0295 |
0.119 |
0.148 |
0.0210 |
0.0832 |
0.104 |
0.0245 |
|
Number of active subscribers to fixed and mobile broadband Internet access per 100 people |
0.194*** |
0.170 |
0.364 |
0.196*** |
0.861 |
1.058 |
0.175*** |
|
Internal costs on research and progress, % to GRP |
0.0273** |
0.0889 |
0.116 |
0.0325*** |
0.142 |
0.174 |
0.0314** |
|
Population density |
0.646* |
-3.577 |
-2.931 |
0.631* |
2.715 |
3.346 |
0.740** |
Note: ***, **, * – significance of the coefficients at the 1, 5, 10% level, respectively. Source: own compilation in the STATA program.
new small-sized enterprises in the region when the corresponding explanatory factor changes in all regions.
In accordance with the values of direct effects, an increase in the number of students in bachelor’s, specialty, and master’s degree programs by 1% in the region reduces the number of new small enterprises in the same region by 0.119% in the SDM model and by 0.138% in the SAC model. This result is consistent with the conclusions of the study (Obraztsova, Chepurenko, 2020), which postulates that “the education level in regions of different types acts on involvement in entrepreneurial activity in different directions: it slows it down in some cases and stimulates it in others”. The reverse influence of the factor “education” on the entrepreneurship development in a group of prosperous regions is explained by the experience and education of individuals who better understand the level of risks and barriers to the entrepreneurship development in their residence region.
The impact of wages and unemployment on changes in entrepreneurial activity is much greater if spatial interactions are taken into account (1,139 vs 0.392 in wages; 0.581 vs. 0.0108
in unemployment). In terms of wages and unemployment, we can note that direct effects are insignificant and much less indirect (SDM model). This means that wage growth in all other regions by 1% increases the number of small businesses in this region by 1,139%; an increase in the unemployment rate in all other regions by 1% increases the number of small businesses in this region by 0.556%. The results obtained indicate that local measures to stimulate entrepreneurship in a particular region will lead to more modest results than policies implemented at the state level (Pereira, 2014).
Economic crime has a statistically insignificant effect on the number of small and medium-sized enterprises, since the activities of small and medium-sized enterprises are mainly concentrated in the legal field of the Russian Federation.
The number of Internet subscribers has a positive impact on the entrepreneurship development. One percent in the region increases the number of new small businesses in the same region by 0.194% in the SDM and by 0.196% in the SAC. The cumulative effect in the SAC model is 1.058%. The indirect effect is not significant; it means that the growth in the number of subscribers in one region does not increase entrepreneurial activity in neighboring regions. The direction of influence corresponds to the expected and is consistent with the results in the works (Shideler, Badasyan, 2012; Sorgner, 2017).
The impact of internal research and development costs on the development of entrepreneurship is quantitatively comparable in the conventional panel regression model and spatial models. The direct effect is 0.0273 in the SDM model and 0.0325 in the SAC model. The innovation factor plays an important role in the entrepreneurship development (Drucker, 1998) and encourages many entrepreneurs to engage in entrepreneurial activity. As we have noted above, entrepreneurs’ innovations encourage other entrepreneurs to enter into entrepreneurial endeavors and innovations (Duguet, 2004).
Population density in spatial models is also a significant factor among the factors of small business development. The estimate of the direct effect is quantitatively comparable to the estimate in the panel regression model and is 0.646 in the SDM model and 0.631 in the SAC model. This is reasonable, since in cities, regions with high population density, the urbanization level and concentration of technologies is higher, which stimulates the development of entrepreneurial activity (Helsley, Strange, 2011; Fritsch, Noseleit, 2013).
Conclusion
In the course of the study, we simulated the factors promoting entrepreneurial activity in Russia’s regions for 2011–2019 using spatial regression models. The model includes weighted values of not only the indicator of the number of small-sized enterprises in other regions (the spatial lag of the dependent variable), but also factors promoting entrepreneurial activity: the number of students, wages, unemployment, economic crime, the number of active Internet users, research and development costs, population density (the spatial lag of explanatory factors). We chose spatial model factors on the basis of S.A. Ayvazyan’s method of selecting informative private criterion. We have carried out the selection within each of the seven blocks of variables that explain the emergence of new small enterprises in the regions.
The study takes into account several aspects of the problem. The first is spatial heterogeneity from the point of view of the existence of the established features of the region’s economic development, which may contribute to or limit entrepreneurial initiatives. The second aspect is the existence of the dependent nature of the development of entrepreneurial activity, as well as the forming factors – knowledge about entrepreneurship, innovations, etc., which are used in the neighboring region. In the existing works on entrepreneurship, either the factors promoting entrepreneurship are considered exclusively while leveling possible spatial relationships, or the presence of spatial effects is analyzed only by the dependent variable (entrepreneurial activity). We have proposed and tested several spatial econometric models of entrepreneurial activity. On the basis of proven criterion for the selection of informative indicators, we determined representative indicators within each block of factors promoting entrepreneurial activity, which allows speaking about a reasonable and comprehensive approach to the selection of signs – determinants of entrepreneurial activity. The analysis of the constructed models shows that in Russia there are strong interrelations between regions and their mutual influence on each other by the dependent variable – the formation of new small enterprises, as well as by such factors promoting entrepreneurial activity as wages and unemployment. We have determined that if the spatial aspect is taken into account, the impact of wages and the unemployment rate on the change in entrepreneurial activity is much greater.
For the entrepreneurship development, the size of average wages and the unemployment rate in neighboring regions are of great importance, as well as the education, the digitalization development, innovative opportunities and concentration rate of labor resources in each particular region. In this regard, we expect that the research results will give practical information to the authorities involved in the development and implementation of entrepreneurship development assistance programs about the role of the spatial factor in the study of the determinants of the development of entrepreneurial activity.
