Dynamics and age structure of migration flows of Far Eastern regions

Author: Kulakov M.P., Mishchuk S.N.
Journal: Economic and Social Changes: Facts, Trends, Forecast @volnc-esc-en
Section: Social and economic development
Article in issue: 1 т.18, 2025.
Free access
Migration has long been the main reason for population decline in the Russian Far East. Taking into account a large number of methods and approaches to the analysis and assessment of population migration, we put forward an original methodology for assessing the parameters of population migration between pairs of regions of the Far East. Our methodology for estimating the number of migrants uses the method of age shifting (the component method) together with elements of the method of migration movement balance. In contrast to existing approaches to assessing migration mobility, our approach helps to obtain minimum migration values with a certain range of possible values that guarantee the preservation of population balance. Of particular interest is assessment of migration by age group in the COVID and post-COVID period. A comparative analysis of migration balance data based on official statistics and the values obtained by own calculations reveal a number of anomalies and tampering with official information on population number, birth rate and mortality in children and adolescents under 15 years of age. We reveal an overestimation of the number of newborns in 2018-2021 in five regions of the Far East. In the pandemic years (2020-2021) we observe a small migration increase for population groups aged 17-19 and 20-29 from regions outside the Far East. Migration growth in the three leading regions (the Khabarovsk and Primorye territories and the Republic of Sakha) has age-specific features and changes over time
Migration, age structure, age shifting method, far east
Short address: https://sciup.org/147251342
IDR: 147251342 | UDC: 314.728 | DOI: 10.15838/esc.2025.1.97.13
Text of the scientific article Dynamics and age structure of migration flows of Far Eastern regions
The research was supported by Russian Science Foundation grant 24-28-01046, project/24-28-01046/.
The assessment of population migration is an important task that arises in the study of socioeconomic processes at the regional, national and global levels. Based on data on migration flows, the demographic situation is projected, regional development scenarios are obtained, and national and regional programs are created. At the same time, official migration statistics are just calculated values, not without many shortcomings, visible errors, for example, due to delays in registering in-migrants or out-migrants, or obvious signs of manipulation (Vakulenko et al., 2011; Mkrtchyan, 2020; Andreev, Churilova, 2023). In addition, these values are usually rather generalized like the difference between the inward and outward flows of the population in a region without specifying the directions of these flows (Nazarov, Nosova, 2009; Safiullin et al., 2014). As a result, official information provides only a rough idea of migration, negating its practical and theoretical significance.
In most regions of the Russian Far East, the magnitude of migration outflow is comparable to mortality and is a powerful driver of depopulation (Ryazantsev et al., 2016; Motrich, 2017). An accurate description of the migration structure and its patterns for different regions by age, as well as its dynamics, can be used in the development of demographic policy, as well as measures within the framework of youth and family policies.
Migration processes in the Far Eastern regions differ (Moiseeva, Mishchuk, 2024), which is related to the natural, geographical, historical, economic, cultural, anthropological, and demographic characteristics of the territories under consideration. Despite the decrease in the migration’s proportion of the total population decline in the Far East, the study of its nature, structure and patterns is an important prerequisite for a comprehensive assessment and projections of population change.
In this regard, along with traditional methods of demographic analysis, an original methodology for assessing the parameters of migration between the regions of the Russian Far East is proposed. The methodology is based on an analysis of population change by age caused by natural and migratory movements between various pairs of regions. Such migration estimates allow us to answer a number of questions, which is impossible when analyzing only net migration. In particular, if it is positive, territories contributing to the most intensive inflow or no inflow can be reasonably indicated. If it is negative, the most common destinations can be determined.
It should be noted that many researchers have attempted to directly assess migration between territories and identify its components and structure (Rybakovsky, Tayunova, 2019; Mishchuk, Ryazantsev, 2021; Rusanov, Chudinovskikh, 2022). Most studies, as a rule, are based on an analysis of not only population change presented in official statistics, but also of a number of additional factors. For example, the attractiveness of a destination is assessed (Vasilenko, 2014; Vasilenko, 2015), which directly affects migration intensity and patterns. Special attention should be paid to works using a “gravity” approach to the analysis and assessment of migration (Vakulenko et al., 2011; Kozlova et al., 2014; Korepina, 2017; Khavinson, Kulakov, 2017), where the number of migrants depends on the distance between regional centers (Vakulenko et al., 2011) or the distance of settlements from each other (Kozlova et al., 2014). In addition, the “gravitation” between territories is influenced by various factors of socio-economic development (Vakulenko et al., 2011).
Interesting results were obtained when assessing migration between countries (Renski, Strate, 2013; Abel, 2013; Abel, Sander, 2014; Azose, Raftery, 2019; Gou et al., 2020). To find the coefficients of the corresponding migration matrix, the pseudoBayes and maximum likelihood estimates are used (Abel, 2013; Azose, Raftery, 2019). The works have shown how global migration patterns and structure have changed over the past 50 years (Abel, Sander, 2014; Gou et al., 2020). However, due to large evidence, only the change in the total number of migrants was analyzed, without decomposition by age or sex. It was found that during the study period, countries formed groups (clusters) within which the most intense population movement was noted. It has been shown that changes in these clusters occurred primarily due to the processes of globalization and the formation of a multipolar world (Gou et al., 2020).
If there are sufficiently detailed data on the population structure, as well as fertility and mortality rates, a more “direct” approach can be applied, based, for example, on the ideas of sectoral and territorial population balance (Edinak, Korovkin, 2014; Korovkin, Sinitsa, 2019). However, it requires comprehensive information about the structure of the population, indicators of its change, including not only data on fertility and mortality, but also on the territorial, sectoral, professional, etc. movement of the population (Edinak, Korovkin, 2014). Given sufficient information, this approach allows describing migration as accurately as possible and making some predictions.
This paper proposes a methodology (algorithm) for estimating the number of migrants using the cohort-component method (Whelpton, 1928; Nazarov, Nosova, 2009; Neverova, 2010; Neverova, Revutskaya, 2017; Clark, 2020), as well as the methodical ideology of the balanced territorial movement between coupled regions of the Russian Federation, but without specifying the factors influencing migration (Edinak, Korovkin, 2014). For each age and a certain year, population balance equations are composed between various pairs of regions, taking into account mortality and unknown migration between them. As a result, the issue of estimating the number of migrants is formulated as a purely algebraic problem, namely linear equations system with a highly sparse and ill-conditioned matrix. To solve such systems, there are a sufficient number of effective numerical methods based on orthogonal decompositions of matrices, the least square method and regularization (Bakhvalov et al., 2004; Il’in, Poznyak, 2004).
The aim of the work is to study the structure and dynamics of migration between pairs of regions of the Russian Far East based on the author’s methodology for assessing migration activity.
The first part of the article analyzes the indicators of net migration of the Far Eastern regions based on various data (population, migration increase, mortality and net migration). The paper presents a comparative analysis of net migration based on official and calculated data.
The second part contains calculations and results of assessing the intensity of migration between various regions of the Far East and the rest of the Russian Federation, as well as between pairs of regions of the Far East. At this stage, elements of graph theory, matrix theory, as well as numerical methods for solving systems of linear algebraic equations are used.
The third section presents quantitative estimates of migration by age group between the regions of the Far East.
The paper analyzes data on migration within the Far East, including between pairs of its regions, as well as net migration with other regions of Russia. The proposed approach does not assess migration flows between the Far East and foreign countries. The changes in migration of different population groups in the COVID and post-COVID periods are considered separately. The empirical part of the work includes data analysis for 11 regions of the Russian Far East.
Initial data and calculation of the total net migration
According to the cohort-component technique (Whelpton, 1928; Nazarov, Nosova, 2009; Neverova, 2010; Neverova, Revutskaya, 2017; Safiullin et al., 2014; Clark, 2020), the populations of adjacent cohorts (excluding newborns) are related by the following equation:
N i ( t , k ) = N i ( t — 1, k — 1) — D i ( t — 1, k — 1) + M i ( t — 1, k — 1) , (1)
where N i ( t , k ) is the population of the k age ( k = 1, 2, ..., 100) at the beginning of the t year, Di is the number of deaths for the entire t year, Mi is the migration inflow for the same period (net migration) equal to the difference between the number of arrivals and departures, i index is the number of the territory (region). For the number of children under one year of age, we have the following equation:
N i ( t ,0) = B i ( t - 1) - D; . ( t - 1,0) + M i ( t - 1,0) , (2)
where Bi is the number of children born in the entire t year, Di is infant mortality.
The simplest analysis of the migratory movement can thereby be carried out using data on the age composition (population of each age), as well as the parameters of the natural movement of the population (fertility and mortality). We will conduct this analysis for 11 regions of the Far East. As initial data, we will use information from the Federal State Statistics Service, including the population by sex and age as of January 1, 2012– 2022 (based on the results of the 2020 All-Russian
Population Census), as well as Rosstat data on mortality and fertility for the period 2016–20231.
Solving equations (1) and (2) with respect to an unknown value M , it is easy to estimate net migration. But since the population data based on the Census results are, in fact, calculated, the found values of M are equal to the migration values that the Federal State Statistics Service has included in the population calculation. Therefore, it will be interesting to compare these very values with data on migration increase from the official statistics portal of Rosstat2. Additionally, we will use Rosstat data on mortality and net migration, decomposed by sex and age3.
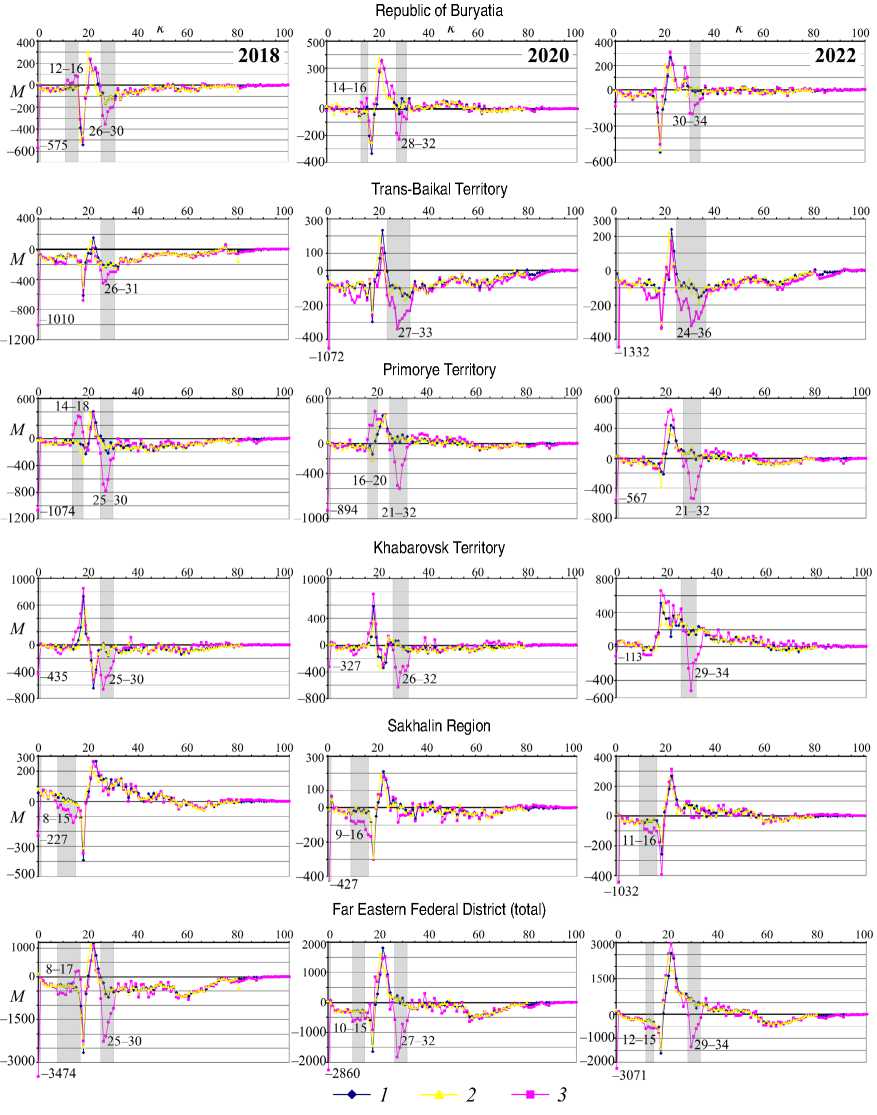
The result of net migration assessment for some regions of the Far East and several years of observation is shown in Figures 1 and 2 . For most regions, there is no significant difference between official data and migration indicators calculated using the cohort-component method (based on equations (1) and (2)). Although, according to calculations, migration turned out to be 15–30% higher than the official one, the age distribution (inward or outward flows and their change in adjacent ages) coincides quite well in general.
However, for a number of regions and some age groups, anomalies have been identified, manifested in the discrepancy between calculated and official migration in certain years and in certain age groups (Fig. 1).
The first and most significant anomaly is associated with an overestimation of the number of newborns in 2018–2021 in five regions (Khabarovsk Territory, Primorye Territory, Sakhalin Region, Republic of Buryatia, Trans-Baikal Territory). A significant overestimation of the number of children under
Figure 1. The net migration value M for population groups aged k ( k = 0, 1, 2, ...100) in 2018, 2020 and 2022, for the regions of the Far East with the most noticeable difference between official and calculated migration
-
1 – data from the Rosstat statistical book (Migration increase by sex, age and bilateral flows. Federal State Statistics Service. A showcase of statistical data. Available at: https://showdata.gks.ru/report/278004/ (accessed: July 9, 2024)), 2 – Rosstat data on request, 3 – own calculation using the cohort-component method. The gray rectangle indicates ages with significant discrepancies in migration estimates.
Figure 2. Comparison of official migration data with calculated data for the regions of the Far East
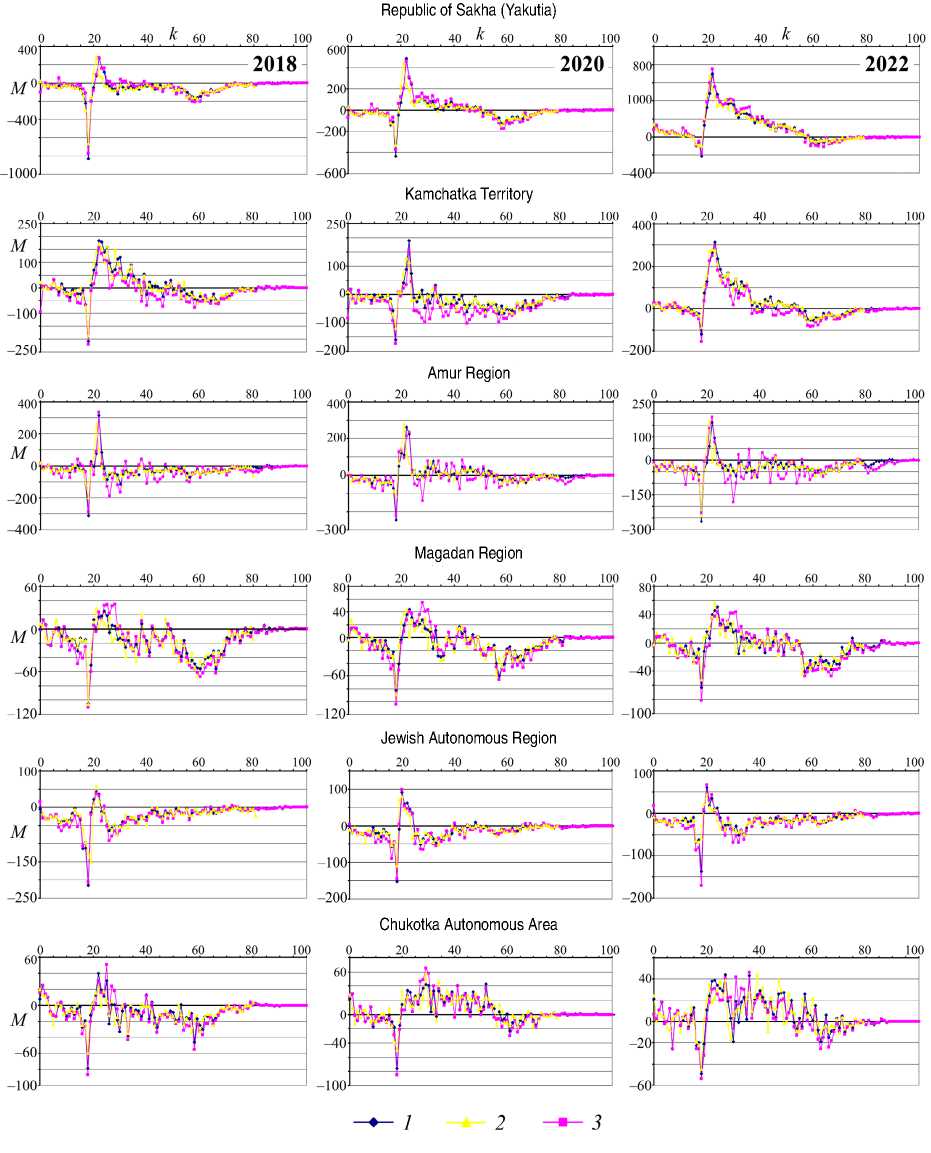
1 – data from the Rosstat statistical book (Migration increase by sex, age and bilateral flows. Federal State Statistics Service. A showcase of statistical data. Available at: (accessed: July 9, 2024)), 2 – Rosstat data on request, 3 – own calculation. The X-axis is age (k = 0, 1, 2, ...100), the Y-axis is the net migration value M.
-
1 year old has led to the fact that the actual infant mortality rate is not able to explain such a rapid decrease in the number of children next year. As a result, the value of M(t,0) in equation (2) is always negative for these regions and 2–20 times higher than the official estimate. There may be several explanations for this discrepancy.
For example, the regions of the Far East are characterized by a significant medical gap in terms of pregnancy, and women often go and give birth in neighboring regions with a more developed healthcare system. As a result, newborns are registered in one region, but mothers with children quickly return to their region, where re-registration is possible. Indeed, for regions where there is no overestimation of the number of newborns (and, respectively, no overestimation of the net newborns number), there is a slight excess of net migration for children aged 1 over the official data. However, numerically, this excess is not able to fully explain the anomalies in newborn migration. In addition, a number of researchers note that the high negative migration obtained according to the All-Russian Census is associated with the common use of administrative data on those who do not participate in the Census personally. According to (Andreev, Churilova, 2023), the proportion of such people is high for some “problematic” regions (Khabarovsk and Primorye territories) of the Far East and correlates well with the proportion of people with the unknown level of education and marital status.
The second anomaly, which has no obvious and simple explanation, is related to the positive estimated inflow of teenagers in the Republic of Buryatia (12–18 years) and the Primorye Territory (14–18 years) in 2018–2019. According to official data, these ages are characterized by nearzero migration or even a small outflow. On the one hand, among older teenagers (16–18 years) there may be applicants for secondary and higher education institutions from other regions, who were not officially registered at that time. It should be noted that since 2020 net migration is at a similar rather high positive peak among young people aged 18–20 which does not contradict official data, i.e. they could have arrived in these regions earlier, but were registered later after reaching majority. Or, more likely, when recalculating the results of the Census, they were “mistakenly” counted as having migrated several years earlier. This is confirmed by the fact that in earlier periods, the peak inflow of teenagers is shifting to younger ages, while by 2022 it corresponds to the age of 20–22 years. In addition, adolescents aged 12–16 in 2018–2019 and earlier could not migrate to these regions independently without their parents. However, during this period, there was no positive inflow of adults who could be their parents or guardians (persons aged over 30 years). After 2020 though, an inflow of such adults has been observed, but there is no similar inflow of children. Perhaps, in the period 2018–2019, migration of families with children to these regions could indeed have taken place, but children alone were taken into account, and adults were considered only according to the results of the All-Russian Census in 2020.
A similar situation is typical for the Sakhalin Region: according to official data, in 2018–2022 there was an inward flow of children and adolescents of all ages, quite synchronously with the inflow of the adult population, i.e. people who may be their parents (19 years and older). However, there is a significant difference between the calculated and official migration data – for children aged 8–16, the estimated net migration is negative, while the official one is positive. Perhaps there was an underestimation of the departure of their parents, which was not clarified according to the results of the Census after 2020.
The third feature, which, unlike others, cannot be called an anomaly, is observed in the Khabarovsk, Primorye, Trans-Baikal territories and the Republic of Buryatia. It manifests itself in a significant difference between the official and estimated net migration in population aged 25–30
in the period 2017–2022. The calculation indicates that there was a large outflow during this period, while official statistics show slightly negative or even positive values. This discrepancy can be explained by the fact that, being the most mobile, this group of the population is not counted for a long time after leaving as having actually changed their place of residence, while arrivals providing a positive or close to zero value mainly consist of migrants who have to be registered (international migrant workers).
The last feature of the data is related to a one-year shift in the distribution peaks of estimated and official net migration for most regions of the Far East. This shift can be explained by migrant registration delays. Moreover, the larger the population of the region, the more noticeable this and the previous features are. For other regions, there is no significant difference between official and calculated statistics (Fig. 2).
It can be thereby assumed that, despite the noted anomalies, the estimated values of net migration for all 11 regions in the time period under review generally better describe the real situation than the official data, and also capture some unobvious trends in population migration. So, for further analysis the calculated data are used. We will focus on the ages with the most reliable migration data and those of particular interest – people over the age of 16.
Calculation of net migration between pairs of regions
The migration figures presented above for a particular region reflect only the final result of migration exchange between all regions of the Russian Federation, without specifying the directions and intensity of flows. In this regard, it is interesting to assess the intensity of migration between various pairs of regions of the Far East and the rest of the Russian Federation. To do this, we apply elements of graph theory, matrix theory, as well as numerical methods for solving systems of linear algebraic equations.
To begin with, let us make a significant assumption, namely that the sum of net migration of all the Far Eastern regions is equal to net migration with the rest of the Russian Federation, but with a minus sign. In this case, we believe that international migration is included in the intraRussian migration, which is quite justified, since the population of the Russian Federation without the Far East is more than 17 times larger than the Far Eastern population. This assumption leads to the fact that emigrants from the Far East who move to other countries first enter territories outside the Far East, increasing the population there, and only then leave the territory of the Russian Federation. Similarly, immigrants from other countries move to the Far East in transit through other Russian regions. This will undoubtedly cause discrepancies in population figures when assessing migration (primarily for territories outside the Far East), which will indirectly indicate the magnitude of international migration. However, this assumption will greatly simplify the analysis and make it possible to use a minimal dataset.
With this formulation of the problem, the Far Eastern regions and the rest of Russia can be described as a complete oriented graph with n = 12 vertices and p = n ( n – 1) / 2 = 66 edges. It is interesting then to evaluate the connectivity of such a graph, to find out if there are any typical directions within it (routes), whether there are closed paths on it and how they change over time for different cohorts. To do this, it is necessary to evaluate the connection strength (edge weight) between each pair of regions (vertices).
As before, we will denote net migration in the t year of the population aged k by M i (t,k ) , where the index i = 1, 2, 3, ..., n = 11 corresponds to the number of the Far Eastern region; M 12( t , k ) = - ^ M i ( t , k ) — net migration between the Russian Federation and the Far East. The regions are numbered as follows: 1 – Republic of Buryatia, 2 – Trans-Baikal Territory, 3 – Republic of Sakha (Yakutia), 4 – Kamchatka Territory, 5 – Primorye
Territory, 6 – Khabarovsk Territory, 7 – Amur Region, 8 – Magadan Region, 9 – Sakhalin Region, 10 – Jewish Autonomous Region, 11 – Chukotka Autonomous Area, 12 – Russian Federation excluding the Far East.
It is easy to understand that each of the values of Mi ( i = 1, 2, ..., 12) is equal to the sum of net migration between all pairs of regions. We will use mij to denote the result of population movement between the i and j regions. Let us call this value a paired net migration. It is clear that mij = - mji , i.e. the results of population movement between the i and j territories will be opposite – the population will be increased by mij for one region and decreased by mij for the other. Consequently, the total net migration of the 11 regions under consideration ( i = 1, 2, 3, ..., 11) and the rest of the RF ( i = 12) is equal to:
M i = m i,2 + m i,3 + m i,4 + ... + m U2 ,
M 2 = - m 1,2 + m 2,3 + m 2,4 . + m 2,12 , M 3 = - m 1,3 - m 2,3 + m 3,4 + . + m 3,12 , M 4 =- m 1,4 - m 2,4 - m 3,4 + . + m 4, n , (3)
M 11 = - m 1,11 - m 2,11 - . - m 10,11 + m 11,12 , M 12 = - m 1,12 - m 2,12 - . - m 10,12 - m 11,12.
Relations (3) define a system of n = 12 linear algebraic equations with p = 66 unknowns. In this case, the system (3) is underdetermined and ill-conditioned. This leads to a situation where small changes of the Mi values make the system incompatible, meaning that it ceases to have an exact solution. However, it is easy to show that while maintaining zero net migration between all territories, i.e. £ M i = 0 , the system will always be compatible (the’’rank of the matrix A , consisting of coefficients before the unknown mij , is 11 and equal to the rank of the expanded matrix ( A | M )). As a result, the system of linear algebraic equations (3) has an infinite number of exact solutions belonging to the hyperplane of dimension 55.
Despite these difficulties, it is possible to numerically find a set of solutions to system (3)
using additional assumptions. To solve system (3), we use the QR decomposition, which transforms a highly sparse matrix A (consisting mainly of zeros) to an orthogonal and upper triangular matrix (Bakhvalov et al., 2004). This will allow distinguishing the basic and free unknowns of the system (3). Next, we perform multiple generation of free unknowns belonging to the valid section of the hyperplane. Obviously, a priori information about the possible limits of the net migration values for a pair of regions is required here. It is quite reasonable to assume that the migration coefficients (the proportion of those who left) do not exceed the value wij = 0.01 , i.e. mij ≤ w ij Nj - Ni . This means that at least one in 100 persons is potentially ready to migrate to another region. In addition, this proportion is higher the more the difference in the population of the two regions.
Each set of unknowns generated in this way is used as a starting point in gradient descent. As a result, the free unknowns and, according to them, the basic unknowns are found that minimize the residual Amij - M → 0 . To improve conditionality, Tikhonov regularization is performed (Il’in, Poznyak, 2004), i.e. an optimization problem Amij - M + λ mij 2 → min is solved, where λ ≤ w ij N j - N i .
As a result, each of the generated initial conditions (200 units) corresponds to 66 values of mij for a pair of territories, which are a fairly accurate solution to system (3) (the residual does not exceed 10-12). It is clear that the set of these 200 solutions is somehow distributed over a valid section of the hyperplane. Let us estimate its possible boundaries. To do this, we will determine the variation limits in the values of the paired net migration, as well as estimate their average value (center of mass) and its range (standard deviation).
As part of our work, we analyze data from 2016 to 2022. For each of the 101 ages, 66 values of mij were obtained (mij = -mji, mii = 0). Therefore, it is logical to combine data from several ages into groups (cohorts) and consider migration estimates for them. Figures 3 and 4, for example, show graphs of net migration values for three age groups: 10–16, 17–19, and 20–29 in different years.
Figure 3 shows the general nature of the solutions of system (3), where the values of its unknowns are duplicated using the equalities mij = - mji and mii = 0 to make the interpretation easier. As a result, the net migration values for each of the regions under consideration with the remaining territories are put in the graphs between the vertical gray lines. Each peak of the positive net migration of the territory number i corresponds to a negative peak of the territory number j ( mij = - mji ). In Figure 3, this is highlighted for the first and last territories.
As can be seen from the graphs, the possible range (standard deviation) of the paired net migration value is not related to the average value of mij . As a rule, it is higher for pairs of territories that differ significantly in population. For example, all regions have a strong range in estimating the net migration with the rest of the Russian Federation, due to the large difference in population. In this case, the standard deviation may indicate the significance (reliability) of the obtained average paired net migration value. It is clear that if the range does not cross the X-axis, then for each of the 200 solutions of system (3), the value mij retains its sign. So, for pairs of territories with these numbers, the direction of migration from one generation of the initial estimate to another does not change
Figure 3. Values of the net migration mij of pairs of territories with numbers i and j using the example of a 10–16 age group in 2016 and 2018
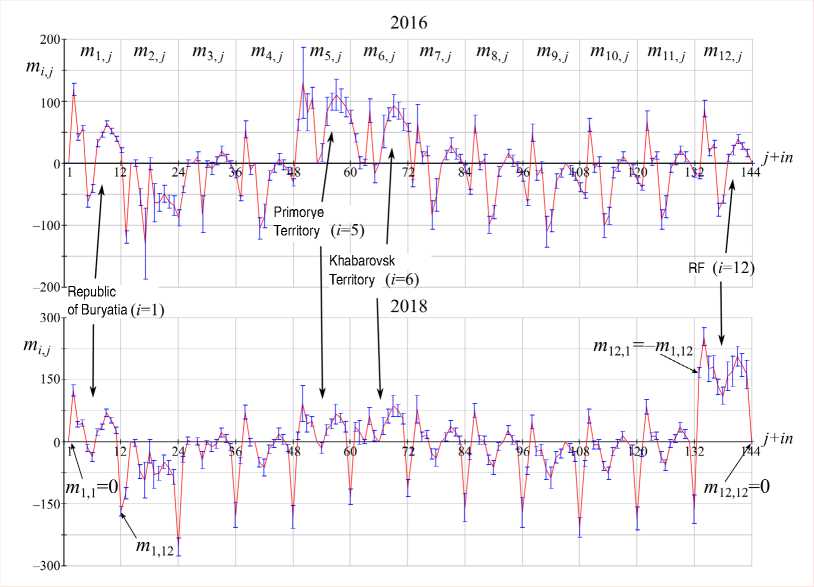
The continuous line is the average value of m ij , the vertical segments are the standard deviation. The X-axis is the ordinal number of the magnitude m ij , the Y-axis is its value.
Source: own calculation.
qualitatively. If the range of possible values crosses the axis and, moreover, the value of mij is close to zero, then different solutions correspond to inactive migration with opposite flows for different solutions. As a result, the reliability of such an estimate of the mij value decreases significantly, and uncertainty arises about the true migration flow. Apparently, this can be interpreted as an extremely weak connection between a pair of territories. This assumption will be used below to estimate the specific number of migrants between regions.
Despite this, in most cases the standard deviation still lies above or below the X-axis, and reliability of the paired net migration mij estimates is beyond doubt. The analysis of the variation of these values for some age groups in different years (Fig. 4) allows us to draw a number of preliminary conclusions.
Figure 4 shows how migration activity has changed between the regions of the Far East for the two most mobile cohorts. The first group includes school graduates and applicants, the
Figure 4. The change in the paired net migration from 2016 to 2023 for age groups 17–19 and 20–29 years
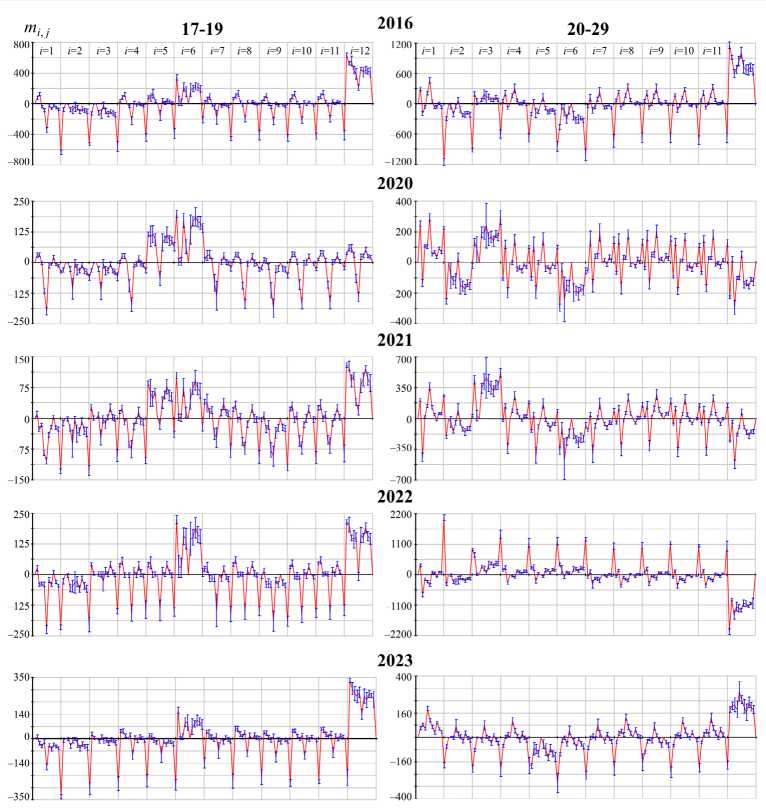
The X-axis is the ordinal number of the variable m ij , the Y-axis is its value. Source: own calculation.
second group includes graduates of secondary and higher educational institutions, as well as young professionals.
A peculiarity of the Far Eastern regions is the high migration activity of these particular age groups, as well as the fact that many of the highly desirable secondary and higher educational institutions are located in three regions: the Primorye Territory ( i = 5), the Khabarovsk Territory ( i = 6) and the Amur Region ( i = 7). These regions are a destination for a significant flow of young people aged 17–19. However, the main stream of youth is directed outside the Far East (more than twice as large). Considering the paired net migration estimates, it can be seen that the flow of young people is quite heterogeneous. For example, the Khabarovsk Territory (leading in receiving youth) has almost no migrants from the Trans-Baikal Territory ( i = 2) and the Republic of Sakha ( i = 3) ( m 6,2 and m 6,3 ≈ 0, the standard deviation crosses the X-axis). The young people of these regions mostly move between neighboring regions, including the Republic of Buryatia ( i = 1). However, of these three regions, the largest flow of young people is directed to the Primorye Territory ( i = 5), partly to the Amur Region. Interestingly, youth aged 17–19 mostly come from the Primorye Territory to the Khabarovsk Territory (as well as outside the Far East), which has the least flow to other regions of the Far East and beyond.
It can be seen from the graphs that the nature of migration of youth aged 17–19 has changed significantly over the marked period of time. This is especially noticeable in the years of the COVID-19 pandemic (2020–2022), when the inflow of young people to the Primorye and Khabarovsk territories and the Amur Region significantly decreased (more than 2-fold). In 2020, the inflow to Russia has become almost zero. Migration rates of this age group reached the level of 2016–2018 only by 2023.
The graphs in Figure 4 show that the second age group (20–29 years) has partly opposite migration trends. It can be concluded that some of the young people return to their native regions after their studies. It is challenging to analyze this age group due to the necessity of comparing migration data for different periods of time, since, first, the study period ranges from three to six years (depending on the student’s major) and young people return after this period of time. In addition, there is a certain delay in registering such departure and then arrival. Second, the group of those who left these regions (the Khabarovsk and Primorye territories), but remained in the Far East, consists not only of yesterday’s nonresident students, but also of local specialists who find jobs in other regions of the Far East.
It can be seen from the graphs in Figure 4 that the maximum out-migration of the population aged 20–29 from the Khabarovsk and Primorye territories in 2020–2021 is directed to the same territories from which there was previously a reverse migration of the cohort of 17 to 19 years old in 2016–2017. But it turns out to be about 1.5 times less than the initial inflow. However, it must be considered that those who have left the two territories are not only graduates, and the return of young specialists is at best only half of what is possible. Such an outflow is not typical for the Amur Region.
In the pandemic years (2020–2022), there was an in-migration of representatives of this age group from territories outside the Far East, and the outward flow that was previously usual for the Khabarovsk and Primorye territories changed to an inflow from almost all territories of the Far East. Interestingly, the main destination territory was the Republic of Sakha (Yakutia) that year. After 2022, migration of the population aged 20–29 returned qualitatively to pre-pandemic levels.
Estimation of the number of migrants between pairs of regions
The value of net migration for each pair of territories depends on the population size in the following obvious way:
m j = wN - wN , (4)
where 0 < w j < 1 is the migration coefficient (coupling strength) of the i region with the j region, equal to the proportion of the considered age group of the j territory that migrates to the i territory. The first member of sum (4) is equal to the number of in-migrants of the i territory, the second member denotes its out-migrants. It is clear that in the general case wij ≠ wji , unlike the values of the paired net migration ( mij = - mji ), which complicates their assessment. In this case, we have 66 completely unrelated equations (4) with 132 unknowns wij . Therefore, the values of wij can take any values within acceptable limits (from 0 to 1) and it is impossible to narrow their variation range.
It is clear from the properties of linear equation (4) that the migration coefficients wij and wji , depending on the value of mij and its sign, can be within the following limits:
0 w ij
= max
m
0, N T w < w j = min 1, к N N у J к
m j + N
N j
and
0 w ji
= max 0, I
—
ти I 1 — I < w 7< w 1 N i ) ^
min f l, N L — m L] . (5)
I N )
It follows from this that the true values of migration coefficients for some territories may be zero, for others – rather small values equal to the ratio of net migration to the population, and for others – very large values. In the lower limit, if the migration coefficient for one territory is zero, then for the other it is equal to mij Nj or - mij Ni , depending on the net migration sign. In the upper limit, if one of the migration coefficients is equal to 1, then the other is equal to ( m ij + N i )/ N j or ( N j - m j )/ N i .
It is clear that all 132 coefficients cannot simultaneously assume the maximum value determined by inequalities (5), since this contradicts the assumption made when estimating the size of the paired net migration: mij = wijNj - wjiNi ≤ w ij Nj - Ni , where wij = 0.01 . Under this assumption, individual wij values may be more than 0.01 due to the large difference in numbers. However, high values of migration coefficients will necessarily be offset by zero or close to zero values of other coefficients.
It is important that for a qualitative description of the relationship’s nature, including a description of the directions of migration flows from one region to another, it is possible to simply use the lower limits of inequalities (5), i.e. wij = wi 0 j , wji = w 0 ji . Such minimal migration can be found, for example, in the work (Azose, Raftery, 2019) in which international migration between pairs of countries was assessed using slightly different methods. In addition, lower limits will allow us to take into account the situation when the range of possible values of the paired net migration falls on both sides of the X-axis.
Considering that the distribution of the paired net migration values obtained from random initial conditions is normal (according to Pearson’s chi-squared test), in the case of a large range of sample values that overlap zero values, the estimate of the sample mean mij randomly differs from zero (according to Student’s t-test). In this case, if m2 ≤ σ2 (σ is the standard deviation of the m ij ij average value estimate), then it can be reasonably argued that mij = 0 and wij = wji = 0. However, “setting to zero” some values of the paired net migration will disrupt the balance of the number of migrants, and the remaining non-zero values for which mi2 > a2 will not satisfy the system (3). Therefore, it is necessary to clarify the remaining only non-zero values. To do this, we set the coefficients preceding the unknowns of system (3) equal to zero if mi2j ≤ σ2 was true at the first iteration. As a result, we get a slightly sparse matrix A, the rank of which is equal to the rank of the expanded matrix and is 11. We apply the QR decomposition for it and solve the corresponding optimization problem in the way described in the previous part.
The solution to the new system of linear algebraic equations is also a set of 66 values of mij , some of which (“set to zero” if the condition mi 2 j ≤ σ 2 is met) can take absolutely any value, since they are preceded by zero coefficients. In order for this whole set to satisfy the initial system (3), they must be only equal to zero. As a result, we can assume that for non-zero values of the paired net
migration mij ≠ 0, the lower estimate of migration coefficients is determined by the lower limit of inequalities (5), and for mij = 0 wij = wji = 0, i.e.
m„ w,, = max 0,—— ' V NJ и w„ = max 0, ji
V
—
тц NJ ,
where mij is the values of the paired net migration of the new system of linear algebraic equations with partially set to zero coefficients.
The quality of the estimates of migration coefficients obtained can be assessed using the residual between the real N ( t,k )* and the model number N ( t,k ), determined by a difference equation of the form:
N ( t , k ) = W ( t - 1, k - 1) N ( t - 1, k - 1) - D ( t - 1, k - 1) , (7)
where N is the vector of population sizes, D is the vector of the number of deaths at the age of k in the year t in each of the 12 territories in question; W = ( w j ) П , } = i — migration matrix consisting of migration coefficients wij , on the diagonal of which is the proportion of the remaining part of n the population after out-migration, i.e. w jj = 1 - ^ w j .
The residual (error), defined as the EuC £ an norm |^(t, k) - N(t, k)*|, has a relatively small value for all years of observation and all ages. A component-wise analysis of the vectors N (t, k) - N (t, k )* shows that for the Far Eastern Federal District regions, if the paired net migration rounded to integers, N- (t, k) - Ni (t, k )*| < 3 for i = 1, 2, ..., 11, i.e. the Far Eastern Federal District regions are short in the accounts by no more than three people according to model (7). Without rounding up the number of migrants, this difference is quite small (|n,-(t, k) - N i (t, k )* | < 10-6 for i = 1, 2, ..., 11). However, in both cases, the difference N12( t, k) - N 12( t, k )* between the model and the real population of the Russian Federation, excluding the Far East (i = 12), is consistently high, reaching 10–15 thousand people in some years and for different ages. Such a high difference is primarily due to a rather rough estimate of the number of deaths outside the Far East. In this case, the last component of vector D12 of equation (7) is obtained on the basis of the average age-related mortality rates presented in official statistics for five-year cohorts throughout the Russian Federation. In addition, the study describes Russia as a closed system of 12 coupled territories without taking into account external migration. As a result, the difference between the model and real numbers contains not only inaccurate mortality data, but also international migration and naturalization processes which are not taken into account.
Similarly, we can compare the difference between the vector of model M ( t,k ) and real M ( t,k )* net migrations. In the case of rounding mij to integers | m ( t , k ) - M ( t , k )*| < 3 , without rounding I M ( t , k ) - M ( t , k ) *| < 10 ".
From the obtained values of migration coefficients, it is easy to calculate the number of in-migrants ( wijNj ) and out-migrants ( wjiNi ) for each i territory. To do this, we define a matrix P = ( P ij ) n, j = 1 , where
_ J wN , i ^ j , ^ j "[ ( 1 - W j ) N j , i = j .
The row of the matrix P with the number i (except the diagonal) contains the number of people who came to the i territory from the j territory ( i ≠ j ). In the column, respectively, it is the number of those who left the j territory for the i territory ( i ≠ j ). On the diagonal P is the total number of people who left this territory for all the others.
Migration estimates analysis
Table 1 shows the obtained minimum migration indicators (coefficients of the matrix P), which are best consistent with the real net migration and population. These values indicate how much the population in each territory has increased or decreased as a result of migratory movement. In addition to estimating the minimum number of migrants, Table 1 shows the calculation of the total number of each region’s inmigrants, its proportion to all out-migrants, as well as the number of people moving within the Far East, and its proportion to all migrants.
Table 1. The lower estimate of the number of in-migrants aged 17–19 to the territory number i (row) from the territory number j (column).
|
2016 |
||||||||||||||
|
Territory No |
1 |
2 |
3 |
4 |
5 |
6 |
7 |
8 |
9 |
10 |
11 |
12 |
In-migrants from all territories (people and their proportion (%) to out-migrants) |
|
|
1 |
1233 |
34 |
62 |
0 |
0 |
0 |
0 |
0 |
0 |
0 |
0 |
0 |
96 |
7.8 |
|
2 |
0 |
1213 |
0 |
0 |
0 |
0 |
0 |
0 |
0 |
0 |
0 |
0 |
0 |
- |
|
3 |
0 |
0 |
1564 |
0 |
0 |
0 |
0 |
0 |
0 |
0 |
0 |
0 |
0 |
- |
|
4 |
50 |
84 |
112 |
744 |
0 |
0 |
0 |
0 |
0 |
0 |
0 |
0 |
246 |
33.1 |
|
5 |
98 |
132 |
160 |
48 |
599 |
0 |
34 |
0 |
49 |
0 |
0 |
0 |
521 |
87.0 |
|
6 |
287 |
0 |
0 |
237 |
189 |
221 |
223 |
202 |
239 |
223 |
198 |
0 |
1798 |
813.6 |
|
7 |
0 |
0 |
126 |
0 |
0 |
0 |
725 |
0 |
0 |
0 |
0 |
0 |
126 |
17.4 |
|
8 |
86 |
119 |
147 |
0 |
0 |
0 |
0 |
625 |
37 |
0 |
0 |
0 |
389 |
62.2 |
|
9 |
49 |
82 |
110 |
0 |
0 |
0 |
0 |
0 |
825 |
0 |
0 |
0 |
241 |
29.2 |
|
10 |
65 |
98 |
126 |
0 |
0 |
0 |
0 |
0 |
0 |
667 |
0 |
0 |
289 |
43.3 |
|
11 |
89 |
122 |
151 |
0 |
0 |
0 |
24 |
0 |
40 |
0 |
618 |
0 |
426 |
68.9 |
|
12 |
509 |
542 |
570 |
459 |
410 |
221 |
444 |
423 |
460 |
444 |
420 |
0 |
4902 |
0.00 |
|
Migration within the Far Eastern Federal District (people and %) |
724 |
671 |
994 |
285 |
189 |
0 |
281 |
202 |
365 |
223 |
198 |
0 |
||
|
58.7 |
55.3 |
63.6 |
38.3 |
31.6 |
0.00 |
38.8 |
32.3 |
44.2 |
33.4 |
32.0 |
0.00 |
|||
|
2020 |
||||||||||||||
|
Territory No |
1 |
2 |
3 |
4 |
5 |
6 |
7 |
8 |
9 |
10 |
11 |
12 |
In-migrants from all territories (people and their proportion (%) to out-migrants) |
|
|
1 |
355 |
23 |
16 |
0 |
0 |
0 |
0 |
0 |
7 |
0 |
0 |
0 |
46 |
13.0 |
|
2 |
0 |
371 |
0 |
0 |
0 |
0 |
0 |
0 |
0 |
0 |
0 |
0 |
0 |
- |
|
3 |
0 |
0 |
380 |
0 |
0 |
0 |
0 |
0 |
0 |
0 |
0 |
0 |
0 |
- |
|
4 |
0 |
30 |
24 |
312 |
0 |
0 |
0 |
0 |
0 |
0 |
0 |
0 |
54 |
17.3 |
|
5 |
107 |
130 |
124 |
100 |
76 |
0 |
71 |
92 |
114 |
90 |
85 |
64 |
977 |
1285.5 |
|
6 |
183 |
0 |
0 |
176 |
76 |
0 |
147 |
168 |
189 |
166 |
161 |
140 |
1406 |
- |
|
7 |
0 |
0 |
53 |
0 |
0 |
0 |
225 |
0 |
43 |
0 |
0 |
0 |
96 |
42.7 |
|
8 |
0 |
38 |
31 |
0 |
0 |
0 |
0 |
288 |
22 |
0 |
0 |
0 |
91 |
31.6 |
|
9 |
0 |
0 |
0 |
0 |
0 |
0 |
0 |
0 |
477 |
0 |
0 |
0 |
0 |
- |
|
10 |
0 |
40 |
34 |
0 |
0 |
0 |
0 |
0 |
24 |
282 |
0 |
0 |
98 |
34.6 |
|
11 |
22 |
44 |
38 |
0 |
0 |
0 |
0 |
0 |
28 |
0 |
267 |
0 |
132 |
49.4 |
|
12 |
43 |
66 |
60 |
36 |
0 |
0 |
7 |
28 |
50 |
26 |
21 |
204 |
337 |
165.2 |
|
Migration within the Far Eastern Federal District (people and %) |
312 |
305 |
320 |
276 |
76 |
0 |
218 |
260 |
427 |
256 |
246 |
0 |
||
|
87.9 |
82.2 |
84.2 |
88.5 |
100.0 |
- |
96.9 |
90.3 |
89.5 |
90.8 |
92.1 |
- |
|||
|
2023 |
||||||||||||||
|
Territory No |
1 |
2 |
3 |
4 |
5 |
6 |
7 |
8 |
9 |
10 |
11 |
12 |
In-migrants from all territories (people and their proportion (%) to out-migrants) |
|
|
1 |
808 |
0 |
0 |
0 |
0 |
0 |
0 |
0 |
0 |
0 |
0 |
0 |
0 |
- |
|
2 |
0 |
565 |
0 |
0 |
0 |
0 |
0 |
0 |
0 |
0 |
0 |
0 |
0 |
- |
|
3 |
13 |
0 |
337 |
0 |
0 |
0 |
0 |
0 |
0 |
0 |
0 |
0 |
13 |
3.9 |
|
4 |
62 |
54 |
0 |
337 |
0 |
0 |
0 |
0 |
0 |
0 |
0 |
0 |
116 |
34.4 |
|
5 |
0 |
0 |
0 |
0 |
460 |
0 |
0 |
0 |
0 |
0 |
0 |
0 |
0 |
- |
|
6 |
164 |
0 |
0 |
102 |
122 |
133 |
0 |
83 |
116 |
106 |
96 |
0 |
789 |
593.2 |
|
7 |
18 |
0 |
0 |
0 |
0 |
0 |
279 |
0 |
0 |
0 |
0 |
0 |
18 |
6.5 |
|
8 |
81 |
73 |
0 |
0 |
40 |
0 |
0 |
299 |
34 |
0 |
0 |
0 |
228 |
76.3 |
|
9 |
47 |
39 |
0 |
0 |
0 |
0 |
0 |
0 |
420 |
0 |
0 |
0 |
86 |
20.5 |
|
10 |
58 |
50 |
0 |
0 |
16 |
0 |
0 |
0 |
0 |
345 |
0 |
0 |
124 |
35.9 |
|
11 |
68 |
60 |
54 |
0 |
26 |
0 |
0 |
0 |
20 |
0 |
325 |
0 |
228 |
70.2 |
|
12 |
297 |
289 |
283 |
235 |
256 |
133 |
279 |
216 |
250 |
239 |
229 |
0 |
2706 |
- |
|
Migration within the Far Eastern Federal District (people and %) |
511 |
276 |
54 |
102 |
204 |
0 |
0 |
83 |
170 |
106 |
96 |
0 |
||
|
63.2 |
48.9 |
16.0 |
30.3 |
44.4 |
- |
- |
27.8 |
40.5 |
30.7 |
29.5 |
- |
|||
|
The diagonal contains the total number of out-migrants of the i territory. A non-zero inward flow from territories outside the Far East is highlighted in gray. Source: own compilation. |
||||||||||||||
Figure 5. Migration flows between the regions of the Far Eastern Federal District and the rest of the Russian Federation for age groups (a) 17–19, (b) 20–29, and (c) 30–44 years
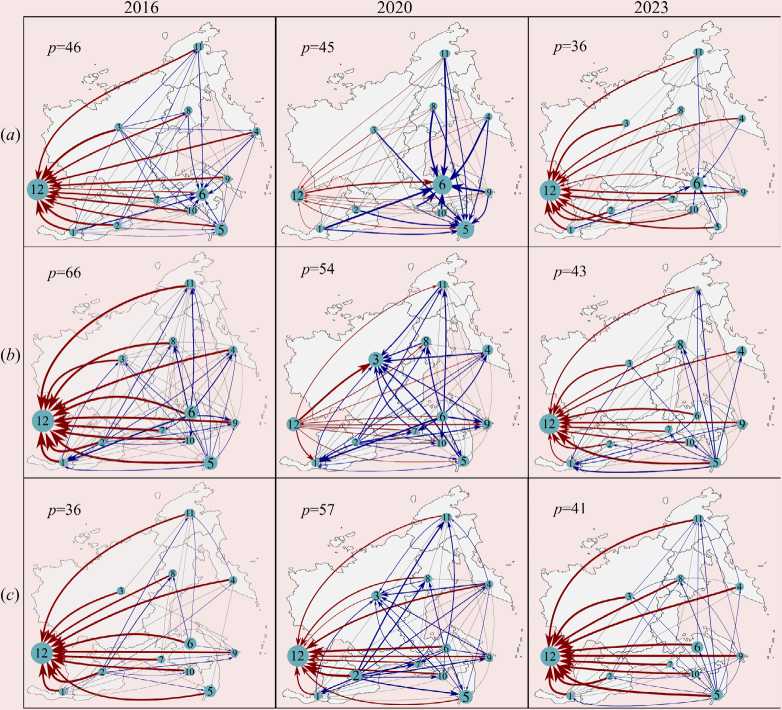
The blue lines represent the largest internal migration flows, the gray lines represent small flows (less than 100 people per year), and the red lines represent the Far Eastern Federal District’s external migration. The p value is the number of edges of the migration flow graph.
Source: own calculation.
Let us consider the values of migration indicators for the three most active age groups – 17–19, 20–29 and 30–44 years.
Estimating the values of minimum migration indicators makes it possible to visualize bilateral flows of migrants between regions using the values Pij or wij as the weights of the oriented graph’s edges (Fig. 5). Note that even after “setting to zero” some values of the paired net migration, the Far Eastern territories turn out to be strongly interconnected. Most of them are linked with each other even though this connection is weak. Graphs constructed for selected age groups do not have cycles, but contain explicit points of attraction (sinks) and repulsion (sources) of population flows. Migration outside the Far East (and inside in 2020–2021), as well as migration to the most developed regions (Khabarovsk, Primorye territories, Republic of Sakha (Yakutia)) are among the largest flows.
According to Figure 5, the intensity (line thickness) and directions (arrows) of population flows between regions differ significantly for different age groups and change considerably over time. In addition, the connectivity of territories changes noticeably, which represents the number p of the graph’s edges. Let us consider the quantitative characteristics of these population flows and their change over time.
As already noted, the migration estimates obtained (coefficients of the P matrix) show a lower estimate of the number of migrants. This means that the number in Tables 1–3 at the intersection of the i row and the j column (i ≠ j) is actually slightly higher. It is impossible to say exactly how much higher. The number at the intersection of the j row and the i column has to be higher just by this value, so that the difference between these parameters is equal to the paired net migration of two territories.
The migration estimates shown in Tables 1–3 make it possible to see how each territory’s migration outflow is divided, as well as visualize it in the form of a diagram (Fig. 5). For example, it is easy to see that the flow of people aged 17– 19 from the Primorye Territory (column 5) is divided into two parts – most of migrants leave the Russian Federation, the smaller part’s destination is the Khabarovsk Territory. At the same time, the inward flows of the Khabarovsk Territory (row 6) originate from all territories of the Far East with the exception of the Trans-Baikal Territory and the Republic of Sakha (Yakutia). Moreover, this inflow in 2016 was more than 80 times larger than the outflow. In 2020, a small inflow from abroad was added to the inflow to both the Khabarovsk and Primorye territories.
Unexpectedly, the Amur Region, where an inflow of young people from different territories was directed during the preliminary analysis of the paired net migration values, “lost” most of it. Only a small inflow was recorded from the Republic of Sakha (2016–2020), the Republic of Buryatia (2017–2019, 2021–2023), the TransBaikal Territory (2018) and the Magadan Region (2020–2021). In this case, the range of possible net migrations exceeded the acceptable level, and the corresponding migration flow was “set to zero” as unreliable. Most likely, there is actually an equal exchange of young people with neighboring regions. Interestingly, in the pandemic years (2020–2021), with a general decrease in the migration of young people aged 17–19, there was a slightly increased inflow to the Amur Region from other territories that had not previously been associated with it. COVID-19 restrictions probably led to a certain redistribution of the flow of young people between the most attractive, but remote territories (outside the Far East), and closer ones. However, after 2022, migration rates to the Amur Region returned to the pre-pandemic level, both in terms of the total number of migrants and typical migration patterns (structure).
Interestingly, according to the proportion of out-migrants among youth aged 17–19 who left the Far East, the regions can be divided into “east-oriented” (Republic of Buryatia, Republic of Sakha (Yakutia) and Trans-Baikal Territory) and “west-oriented”. From the first group of regions, young people mostly move within the Russian Far East (the proportion of those who migrated but remained in the Far East is more than 50%). The youth of the second group tends to leave the Far East (the proportion of those who left it but remained in the Russian Federation is more than 60%). It is expected that during the pandemic years, all the Far Eastern regions became a place of destination for young people (the proportion of those who migrated but remained in the Far East is more than 80%). Only the Khabarovsk and Primorye territories’ outflow more than compensated the inflow. But in the last two years of observation (2022–2023), a decrease in the inflow of young people has been recorded, while maintaining its consistently large flow outside the Far East.
It should be noted that according to official data and our calculations of net migration, young people changed their migration pattern in 2020 (as of January 1), i.e. actually before the introduction of COVID-19 restrictions. Perhaps this is due to some peculiarities of the Census that took place in the fall of 2021, which was so strangely reflected in the data of this age group. In other ages, a significant change in migration patterns was noted in 2021.
Table 2. Lower estimate of the number of in-migrants aged 20–29
|
2016 |
||||||||||||||
|
Territory No |
1 |
2 |
3 |
4 |
5 |
6 |
7 |
8 |
9 |
10 |
11 |
12 |
In-migrants from all territories (people and their proportion (%) to out-migrants) |
|
|
1 |
1598 |
295 |
0 |
0 |
199 |
468 |
47 |
0 |
0 |
7 |
0 |
0 |
1016 |
63.6 |
|
2 |
0 |
2470 |
0 |
0 |
0 |
61 |
0 |
0 |
0 |
0 |
0 |
0 |
61 |
2.5 |
|
3 |
188 |
51 |
600 |
79 |
204 |
115 |
134 |
75 |
77 |
118 |
76 |
0 |
1117 |
186.2 |
|
4 |
61 |
213 |
0 |
764 |
155 |
316 |
62 |
0 |
2 |
37 |
0 |
0 |
846 |
110.7 |
|
5 |
0 |
55 |
0 |
0 |
2085 |
121 |
0 |
0 |
0 |
0 |
0 |
0 |
176 |
8.4 |
|
6 |
0 |
0 |
0 |
0 |
0 |
3575 |
0 |
0 |
0 |
0 |
0 |
0 |
0 |
- |
|
7 |
0 |
124 |
0 |
0 |
88 |
227 |
1209 |
0 |
0 |
0 |
0 |
0 |
439 |
36.3 |
|
8 |
65 |
219 |
0 |
2 |
163 |
327 |
67 |
739 |
3 |
21 |
0 |
0 |
867 |
117.3 |
|
9 |
61 |
211 |
0 |
0 |
150 |
320 |
63 |
0 |
771 |
42 |
0 |
0 |
847 |
109.9 |
|
10 |
0 |
176 |
0 |
0 |
116 |
285 |
23 |
0 |
0 |
994 |
0 |
0 |
600 |
60.4 |
|
11 |
70 |
225 |
0 |
8 |
165 |
321 |
70 |
4 |
8 |
45 |
748 |
0 |
916 |
122.5 |
|
12 |
1153 |
901 |
600 |
675 |
845 |
1014 |
743 |
660 |
681 |
724 |
672 |
0 |
8668 |
- |
|
Migration within the Far Eastern Federal District (people and %) |
445 |
1569 |
0 |
89 |
1240 |
2561 |
466 |
79 |
90 |
270 |
76 |
0 |
||
|
27.9 |
63.5 |
0.00 |
11.7 |
59.5 |
71.6 |
38.5 |
10.7 |
11.7 |
27.2 |
10.2 |
0.00 |
|||
|
2020 |
||||||||||||||
|
Territory No |
1 |
2 |
3 |
4 |
5 |
6 |
7 |
8 |
9 |
10 |
11 |
12 |
In-migrants from all territories (people and their proportion (%) to out-migrants) |
|
|
1 |
132 |
238 |
0 |
108 |
105 |
292 |
61 |
72 |
48 |
94 |
77 |
204 |
1299 |
984.1 |
|
2 |
0 |
1342 |
0 |
0 |
0 |
0 |
0 |
0 |
0 |
0 |
0 |
0 |
0 |
0.0 |
|
3 |
132 |
0 |
0 |
240 |
237 |
0 |
193 |
205 |
181 |
226 |
209 |
337 |
1960 |
0.0 |
|
4 |
0 |
131 |
0 |
520 |
0 |
185 |
0 |
0 |
0 |
0 |
0 |
97 |
413 |
79.4 |
|
5 |
0 |
134 |
0 |
0 |
502 |
188 |
0 |
0 |
0 |
0 |
0 |
100 |
422 |
84.1 |
|
6 |
0 |
0 |
0 |
0 |
0 |
1862 |
0 |
0 |
0 |
0 |
0 |
0 |
0 |
0.0 |
|
7 |
0 |
177 |
0 |
47 |
44 |
231 |
254 |
0 |
0 |
33 |
0 |
143 |
675 |
265.7 |
|
8 |
0 |
166 |
0 |
35 |
32 |
220 |
0 |
301 |
0 |
0 |
0 |
132 |
585 |
194.4 |
|
9 |
0 |
190 |
0 |
59 |
56 |
244 |
0 |
24 |
229 |
45 |
29 |
156 |
803 |
350.7 |
|
10 |
0 |
145 |
0 |
0 |
0 |
199 |
0 |
0 |
0 |
415 |
0 |
111 |
455 |
109.6 |
|
11 |
0 |
161 |
0 |
31 |
28 |
215 |
0 |
0 |
0 |
17 |
315 |
127 |
579 |
183.8 |
|
12 |
0 |
0 |
0 |
0 |
0 |
88 |
0 |
0 |
0 |
0 |
0 |
1407 |
88 |
6.3 |
|
Migration within the Far Eastern Federal District (people and %) |
132 |
1342 |
0 |
520 |
502 |
1774 |
254 |
301 |
229 |
415 |
315 |
0 |
||
|
100.0 |
100.0 |
0.0 |
100.0 |
100.0 |
95.3 |
100.0 |
100.0 |
100.0 |
100.0 |
100.0 |
0.0 |
|||
|
2023 |
||||||||||||||
|
Territory No |
1 |
2 |
3 |
4 |
5 |
6 |
7 |
8 |
9 |
10 |
11 |
12 |
In-migrants from all territories (people and their proportion (%) to out-migrants) |
|
|
1 |
142 |
68 |
81 |
52 |
160 |
111 |
59 |
33 |
95 |
56 |
31 |
0 |
746 |
525.4 |
|
2 |
0 |
314 |
0 |
0 |
91 |
0 |
0 |
0 |
27 |
0 |
0 |
0 |
118 |
37.6 |
|
3 |
0 |
0 |
401 |
0 |
79 |
0 |
0 |
0 |
0 |
0 |
0 |
0 |
79 |
19.7 |
|
4 |
0 |
0 |
0 |
246 |
107 |
58 |
0 |
0 |
0 |
0 |
0 |
0 |
165 |
67.1 |
|
5 |
0 |
0 |
0 |
0 |
1313 |
0 |
0 |
0 |
0 |
0 |
0 |
0 |
0 |
- |
|
6 |
0 |
0 |
0 |
0 |
49 |
634 |
0 |
0 |
0 |
0 |
0 |
0 |
49 |
7.7 |
|
7 |
0 |
0 |
0 |
0 |
101 |
0 |
313 |
0 |
0 |
0 |
0 |
0 |
101 |
32.3 |
|
8 |
0 |
36 |
48 |
0 |
127 |
78 |
26 |
208 |
62 |
0 |
0 |
0 |
377 |
181.3 |
|
9 |
0 |
0 |
0 |
0 |
65 |
0 |
0 |
0 |
523 |
0 |
0 |
0 |
65 |
12.4 |
|
10 |
0 |
0 |
0 |
0 |
104 |
55 |
0 |
0 |
39 |
254 |
0 |
0 |
198 |
78.0 |
|
11 |
0 |
0 |
49 |
0 |
128 |
79 |
27 |
0 |
63 |
0 |
204 |
0 |
346 |
169.6 |
|
12 |
142 |
210 |
223 |
194 |
302 |
253 |
201 |
175 |
237 |
198 |
173 |
0 |
2308 |
- |
|
Migration within the Far Eastern Federal District (people and %) |
0 |
104 |
178 |
52 |
1011 |
381 |
112 |
33 |
286 |
56 |
31 |
0 |
||
|
- |
33.1 |
44.4 |
21.1 |
77.0 |
60.1 |
35.8 |
15.9 |
54.7 |
22.1 |
15.2 |
0.0 |
|||
|
Source: own compilation. |
||||||||||||||
The analysis of the lower estimates of migration of the following age group (20–29 years) is generally consistent with the results of a preliminary analysis of the paired net migration values (Tab. 2) . It is possible to identify the regions with the largest outflow (more than 1000 people per year) – the Trans-Baikal, Khabarovsk and Primorye territories, and the regions with the largest population inflow – the Republic of Sakha (Yakutia), the Kamchatka Territory, the Magadan Region for all the years of observation. For the first group of regions, the destination territories are mainly other regions of the Far East (more than 60%), which remains fairly stable in the structure (patterns), with the exception of 2022, when the outflow was replaced by an inflow. It should be noted that the population leaves small regions moving mainly outside the Far East (more than 70% of all out-migrants).
The migration attractiveness of the Republic of Sakha, the Kamchatka Territory, the Magadan and Sakhalin regions has changed significantly. For example, in 2016–2017, the maximum in-migration among the 20–29 age group was recorded in the Republic of Sakha (Yakutia) and the Magadan Region. After 2018, there was an increased interest in migrating to the Sakhalin Region (1.5 times more than to other regions). During the pandemic years, most of the cohort’s representatives came to the Republic of Sakha (Yakutia), mainly from the regions of the Far East. In addition, in some years there were surges of inflows to the Republic of Buryatia in 2016, 2020 and 2023, the Kamchatka Territory and the Sakhalin Region in 2018–2019.
During the pandemic years and immediately after them (2021–2022), this age group contributed to perhaps the most massive inflow from all territories, including regions outside the Far East, as well as provided the largest proportion of internal migration (up to 100%). It probably includes both the forced return of a part of the population from other regions, and the subsequent massive inflow of international migrant workers in 2022, who could not enter the Russian Federation in 2020–2021 due to COVID-19 restrictions.
According to calculations, by 2023, migration rates for the population aged 20–29 have not recovered to their previous levels. This is reflected both in quantitative indicators and in the diversity of migration patterns. In our opinion, it is rather premature to say that there have been qualitative changes in migration for this age group, since data for 2023 on the number, mortality and migration of this most active migration group may be preliminary and adjusted by the beginning of 2025.
For the next cohort (30–44 years), according to the results of the migration indicators analysis, a new departure leader can be noted – the TransBaikal Territory (Tab. 3) . Its population outflow remained at approximately the same high level as for the previous age group, though still within the Far East (more than 60%). At the same time, for the Primorye and Khabarovsk territories, the outward flow rate equaled the average for the Far East, but the main outflow is oriented beyond the Far East. However, in some years (2019–2021), there were surges of departures from the Khabarovsk Territory, but due to an increase in the proportion of internal Far Eastern migration. In the pandemic years, especially in 2021, the Khabarovsk and Primorye territories again surpassed other regions both in terms of the number of out-migrants aged 30–44 and the migration structure. In 2021–2022, the Amur Region was added to the leaders in population outflow for this age group.
There was also a change in the leading regions receiving migrants aged 30–44 – the Magadan, Sakhalin regions and the Chukotka Autonomous Area alternately received a maximum of migrants (up to 1,500 per year). However, in the pandemic years, due to the return of the population from all regions of the Russian Federation, the Republic of Sakha (Yakutia) became the obvious leader in terms of in-migration (more than 3,000 people per year).
We can confidently say that unlike the previous age group (20–29 years) the migration structure of the cohort of 30 to 44 years has changed significantly after 2022, because, despite the recovery of the total number of migrants by 2023, “atypical” migration
Table 3. Lower estimate of the number of in-migrants aged 30–44
Conclusion
In the present study, a methodology for assessing migration activity between pairs of regions was developed and tested. The methodology is based on the construction and solution of fairly simple population balance equations between all related regions and uses a quite small amount of data on population, fertility and mortality. Solving these equations, taking into account reasonable restrictions imposed on migration parameters, allows us to specify narrow ranges of the number of migrants between each pair of regions, ensuring a sufficiently accurate match with the observed natural and migratory movement of the population in each region. Using fairly simple static criteria (Pearson’s chi-squared test and Student’s t-test), it is easy to discard some of the found migration parameters that accidentally differ from zero, i.e. to identify regions that are not interconnected, and, on the contrary, to prove that some other regions are actually connected.
The author’s methodology was applied to assess migration between 11 regions of the Far East and the rest of the Russian Federation. At the stage of processing the initial data for a number of regions, some anomalies and manipulations with official data on the population, birth and mortality rates of children and adolescents under 15 years were found, which does not allow us to unambiguously describe their migration. Therefore, the migration of older and at the same time the most mobile age groups is considered in detail, without noticeable peculiarities in the initial data – 17–19, 20–29 and 30–44 years. The migration indicators found for them are lower estimates that ensure the preservation of population balance. It should be noted that our estimates do not pretend to be absolutely accurate. They are only the “average” of the minimum values of migration indicators with a certain range of possible values that guarantee the preservation of population balance. Therefore, the actual migration is likely to be slightly higher. The lower estimates showing the migration increase by interchanging population with each region are quite sufficient to identify the destination territories where a large number of migrants move and indicate regions of origin this inflow comes from.
It should be noted that numerous works devoted to migration both in the Far East and other regions of Russia do not provide such a detailed description of bilateral flows (Neverova, 2010; Neverova, Revutskaya, 2017; Vakulenko et al., 2011; Korovkin, Sinitsa, 2019). The studies can be mentioned that have built detailed networks of flows between countries (Abel, 2014; Gou et al., 2020). However, they only consider changes in the total number of migrants without taking into account the age structure. As a result, it is not clear whether the changes in the patterns of international migration over the past 50 years, revealed in these works, were accompanied by a corresponding reform in the age structure of the migrating population. An analysis of migration processes in the Far East showed that even within a short time period (2016–2023), this happened several times.
An analysis of migration estimates performed for different age groups and their changes over time revealed a number of features of population movement. Let us list the main results.
-
1) The majority of migrants (more than 60%) from all 11 Far Eastern regions of the considered age groups leave the Far East. In the pandemic years (2020–2021), there was a change in the migration pattern – a small inward flow from territories outside the Far East for age groups 17–19 and 20– 29 years.
-
2) The leaders in receiving internal migrants are the Khabarovsk, Primorye territories and the Republic of Sakha (Yakutia), the attractiveness of which varies among different age groups and over time. The majority of those who arrived in the Khabarovsk and Primorye territories are young people aged 17–19, who, most likely, enroll in secondary and higher educational institutions. These regions are of consistently high interest among young people and this trend peaked during the pandemic years (in proportion to migration
outside the Far East). Although recently there has been a slight decrease in migration to the Primorye Territory.
-
3) The outflow of the population aged 20–29 is mostly directed to the origin regions of people aged 17–19 (which they left 3–5 years before that). However, in general, this flow is 1.5–2 times less than the initial inflow. Interest in coming to the Republic of Sakha (Yakutia) and partly to the Republic of Buryatia among this age group has especially increased during the pandemic years.
-
4) The internal migration of the cohort aged 30–44 is as diverse as possible, directed to almost all regions of the Far East and has significantly increased during the years of coronavirus restrictions. The Khabarovsk and Primorye territories became the leaders in terms of this age group’s migration outside the Far East.
