Dynamics of investment in fixed capital in the economy of the northern regions

Author: Gadzhiev Yusif Alimovich, Akopov Valerii Ishkhanovich, Kanev Viktor Nikolaevich
Journal: Economic and Social Changes: Facts, Trends, Forecast @volnc-esc-en
Section: Regional economy
Article in issue: 1 (37) т.8, 2015.
Free access
The article describes characteristics and trends of investment in fixed capital of the Northern regions. It singles out phases of rapid pre-crisis growth, crisis, post-crisis growth and stagnation. Stagnation and decline in recent years are caused by completed major investment projects, reduced own funds of enterprises, limited availability of investment resources and increased capital outflow. The article reveals that the growth of investment in fixed capital of the North in the post-crisis period is provided by the regions, carrying out major investment in oil and gas pipeline transport, oil extraction, production and distribution of electricity, gas and water. The changes in the sectoral structure of investment in fixed capital of the Northern regions are barely visible; the share of investment in the traded sector is still high, especially in mining, due to the Northern regions’ specialization in the extractive industries. The share of investment in the public sector and social services remains low...
Stagnation, investment in fixed capital, structure of investment by types, purchase of fixed assets, northern regions, new construction, modernization and reconstruction
Short address: https://sciup.org/147223700
IDR: 147223700 | UDC: 332.1:330.322.21 | DOI: 10.15838/esc/2015.1.37.4
Text of the scientific article Dynamics of investment in fixed capital in the economy of the northern regions
Nowadays the main task of the country’s economy is to find a way out of stagnation. Its practical solution is directly related to overcoming deceleration and boosting economic growth by means of increased investment, primarily in the real sector as the main factor in modernization and economic growth. The situation is especially critical in the Northern regions, as the productive facilities are worn out, and the funding of investment does not fully ensure its updating and necessary technological and structural changes in the economy. These circumstances determine the need to study characteristics of dynamics, territorial, sectoral, and specific structures of investment in the fixed capital of the Northern regions.
Analysis of investment dynamics
Dynamics of investment in fixed capital of the economy in the North in 2000–2014
(January–February) was characterized by an unstable trend ( figure ) [5, pp. 922923; 7, pp. 932-933; 11]. In the period under analysis in the North the indices of physical volume of investment in fixed capital dropped twice sharply, falling below 100% in 2005 and during the 2009–2010 global crises, then they grew rapidly in 2011 and again quickly fell in 2013–2014. In the first case the recession was caused by their sharp reduction in such investmentintensive regions, as Yamalo-Nenets Autonomous Okrug and Khanty-Mansi Autonomous Okrug, due to the termination of investment cycles; in the second case – by the consequences of the global economic and financial crisis; in the third – by the low base effect; in the fourth – by the completion of major investment projects and the entrepreneurs’ expectations for more favorable conditions for investments.
Dynamics of investment in fixed capital of the Northern regions and Russia in 2000–2014, %
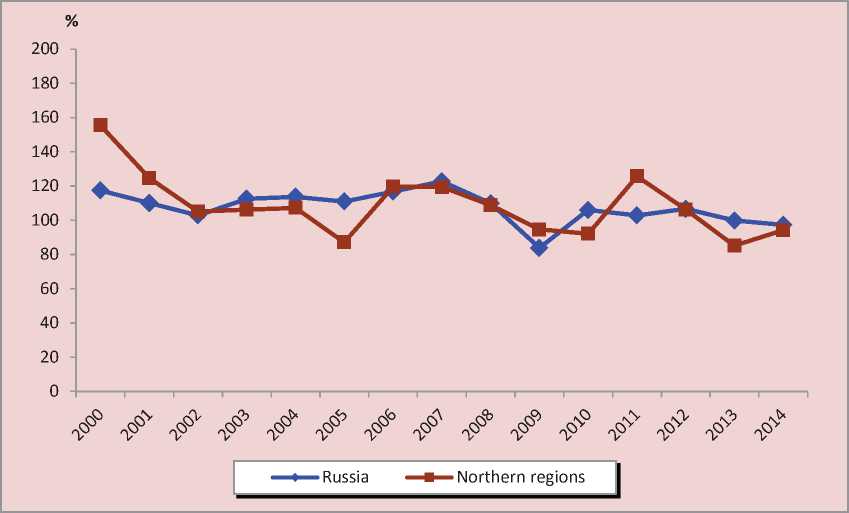
In Russia, compared with the North, the dynamics of investment in the economy was more smooth, it did not have a sharp drop (below 100%) in investment in 2005, but had a short-term downturn in 2009, then followed by significant growth in 2010– 2012; in 2013–2014 there was a slight decline [5, pp. 922-923; 7, pp. 932-933; 11]. The main reasons are the following: restricted availability of investment resources (direct investment and loans) for domestic enterprises; speculation on the currency market due to the ruble depreciation; suspension of the natural monopolies’ investment programs due to the tariffs freezing in 2014 and the sharp increase in the capital outflow, which significantly exceeds the volume of lending to the economy due to the events in Ukraine.
It should be noted that during the crisis in the Northern regions of Russia the decline in investment was much deeper than the drop in GRP and GDP. So, in 2009 investment in fixed capital in the North and in the Russian Federation fell respectively to 5.4 and 16.2% against 3.3% of GRP and 7.6% of GDP [4, pp. 296-293; 7, pp. 932-933].
In 2000–20121 the dynamics of investment in fixed capital of the North had three phases: growth (2000–2008), crisis recession (2008–2009) and post-crisis growth (2009– 2012) ( tab. 1 ). The recovery phase was characterized by the rapid growth of investment in the Northern regions, which amounted to 97.9% (in Russia – 152.4%).
The revenue from large-scale export of raw materials, cheap foreign loans and government funding were key factors promoting rapid investment growth in the Northern regions and the country in general. Nenets Autonomous Okrug, the Sakhalin Oblast and the Arkhangelsk Oblast, Chukotka Autonomous Okrug, Kamchatka Krai and the Sakha (Yakutia) Republic had the highest rates of investment growth in 2000–2008 due to large investment in oil and gas production, diamond and gold mining, and defense industry. Khanty-Mansi Autonomous Okrug and the Komi Republic had the lowest rates due to the high base effect.
The crisis years, on the contrary, were marked by the deep decline of investment in the fixed capital of the Northern regions. In 2008–2009 it amounted to 7.9% (in Russia – 16.3%). The drop was especially sharp in Nenets Autonomous Okrug, the Republic of Karelia and the Magadan Oblast due to the global financial crisis consequences, namely drastic reduction of the funds from parent enterprises and considerable appreciation of the loans provided by foreign and domestic banks. It was also partly affected by the regions’ specialization on the industries sensitive to decline.
The growth of investment in fixed capital in the crisis years was observed in Chukotka Autonomous Okrug, Kamchatka Krai, the Komi Republic and the Sakha (Yakutia) Republic due to the continuous financing of large investment projects, particularly, the construction of the “Eastern Siberia–Pacific Ocean” oil pipeline (ESPO) and the “Bovanenkovo-Ukhta” gas pipeline, the launch of the “World” and the “Aykhal” mines in the
Table 1. Growth of investment in fixed capital of the Northern regions, 2000–2012, %*
|
Regions |
2000–2008 |
2008–2009 |
2009–2012 |
2010–2012 |
|
Russian Federation, total |
152.4 |
-16.3 |
16.7 |
9.6 |
|
Northern regions, total |
97.9 |
-7.9 |
20.7 |
31.8 |
|
Republic of Karelia |
85.2 |
-31.9 |
26.3 |
26.4 |
|
Komi Republic |
65.1 |
24.7 |
110.6 |
66.6 |
|
Arkhangelsk Oblast |
364.2 |
-50.2 |
37.7 |
22.8 |
|
Nenets Autonomous Okrug |
651.4 |
-61.6 |
-41.8 |
-32.5 |
|
Murmansk Oblast |
152.3 |
-18.4 |
34.8 |
23.9 |
|
Khanty-Mansi Autonomous Okrug |
44.5 |
-4.3 |
25.3 |
25.5 |
|
Yamalo-Nenets Autonomous Okrug |
84.6 |
-10.8 |
-19.8 |
25.6 |
|
Sakha (Yakutia) Republic) |
256.7 |
9.4 |
61.7 |
36.2 |
|
Kamchatka Krai |
280.2 |
61.9 |
12.9 |
1.6 |
|
Magadan Oblast |
154.9 |
-24.6 |
231.4 |
65.7 |
|
Sakhalin Oblast |
446.6 |
-16.3 |
-59.9 |
18.4 |
|
Chukotka Autonomous Okrug |
282.4 |
61.9 |
104.5 |
503.2 |
|
* Calculated by: [5, pp. 922-923, pp. 918-919; 7, pp. 928-929, pp. 932-933]. |
||||
Sakha (Yakutia) Republic [7] and the “Step” investment project in the pulp and paper industry in the Komi Republic [8] and investment in the extraction of gold and silver in Chukotka Autonomous Okrug and Kamchatka Krai [9].
The post-crisis period (2009–2012) was characterized by the significant growth rates of investment in fixed capital of the Northern regions economy, which amounted to 20.7% (in Russia – 9.5%). They were especially high in the Magadan Oblast, the Komi Republic, Chukotka Autonomous Okrug mainly due to the allocations to mineral extraction, transport and the low base effect. At the same time, the negative growth rates were recorded in the Sakhalin Oblast, Nenets Autonomous district and Yamalo-Nenets Autonomous Okrug due to the completion of investment projects, the small amount of own funds and the limited availability of investment resources (direct investments and loans).
The regions’ contribution to the investment growth rates
The regions’ contribution to the growth rates of investment in fixed capital (IFC) was determined by the re-calculation of nominal volumes in 2004 constant prices and the calculation of absolute growth (CAG) as the difference between the actual volume (IFC) of the regions of the current and base years and the correlation of absolute values of growth (IFC) of the regions with the overall growth (IFC) in percent.
The pre-crisis years (2005–2008) were characterized by the positive contributions of all regions to the growth rates of investment in fixed capital of the Northern regions. Export-oriented Yamalo-Nenets Autonomous Okrug, Khanty-Mansi Autonomous Okrug and the Sakha (Yakutia) Republic made the greatest contribution due to the revenues from oil, gas and diamonds export and the inflow of cheap foreign loans (tab. 2). Nenets Autonomous Okrug, the Sakhalin Oblast and the Arkhangelsk Oblast made a less significant contribution. Chukotka Autonomous Okrug, the Magadan Oblast and the Republic of Karelia made the lowest contribution. In general, despite a slight decrease, the Northern regions’ contribution to the growth of investment in fixed capital of the Russian economy remains substantial – 14.9%.
The crisis years (2008–2009) were marked by the drastic negative contribution (20.8%) of the Northern regions to the fall of investment in fixed capital of the country (see tab. 2). It was manifested in the oil and gas producing regions, such as Nenets Autonomous Okrug, Yamalo-Nenets Autonomous Okrug, Khanty-Mansi Autonomous Okrug and the Arkhangelsk Oblast, to the greatest extent. The main reasons were the following: the sharp reduction of own and borrowed funds due to substantial decline in the world oil and gas prices, the rising cost of loans on the global and domestic markets, the investors’ waiting for more favorable conditions to invest. During this period, only six regions made insignificant positive contribution to investment growth.
The post-crisis period was characterized by the Northern regions’ large contribution
Table 2. Contribution to the growth of investment in fixed capital of the Northern regions’ economy in 2005–2012, %*
|
Regions |
2005–2008 |
2008–2009 |
2009–2012 |
|||
|
Russian Federation |
Northern regions |
Russian Federation |
Northern regions |
Russian Federation |
Northern regions |
|
|
Economy, total |
100 |
100 |
100 |
100 |
100 |
100 |
|
Northern regions |
14.9 |
- |
-20.8 |
- |
22.7 |
|
|
Republic of Karelia |
0.3 |
1.9 |
-0.7 |
-3.2 |
0.4 |
1.9 |
|
Komi Republic |
0.7 |
5.0 |
1.1 |
5.2 |
9.5 |
41.7 |
|
Arkhangelsk Oblast |
1.1 |
7.3 |
-4.1 |
-19.9 |
1.1 |
4.9 |
|
Nenets Autonomous Okrug |
1.5 |
9.9 |
-5.8 |
-27.7 |
-1.2 |
-5.1 |
|
Murmansk Oblast |
0.6 |
4.1 |
-1.9 |
-9.2 |
1.2 |
5.2 |
|
Khanty-Mansi Autonomous Okrug |
3.0 |
20.4 |
-3.5 |
-17.1 |
9.1 |
39.9 |
|
Yamalo-Nenets Autonomous Okrug |
3.7 |
25.0 |
-5.1 |
-24.4 |
-5.9 |
-25.9 |
|
Sakha (Yakutia) Republic |
2.3 |
15.1 |
2.3 |
11.0 |
8.6 |
38.0 |
|
Kamchatka Krai |
0.1 |
0.6 |
0.1 |
0.3 |
0.1 |
0.6 |
|
Magadan Oblast |
0.2 |
1.1 |
-.5 |
11.0 |
2.0 |
8.9 |
|
Sakhalin Oblast |
1.4 |
9.1 |
-2.2 |
0.3 |
-3.3 |
-14.7 |
|
Chukotka Autonomous Okrug |
0.1 |
0.7 |
-0.5 |
11.0 |
1.0 |
4.6 |
* Calculated by: [5, pp. 922-923, pp. 918-919; 7, pp. 928-929, pp. 932-933].
to the growth rate of investment in fixed capital of the country’s economy (22.7%) due to the Komi Republic, Khanty-Mansi Autonomous Okrug and the Sakha (Yakutia) Republic (see tab. 2). At the same time, the large negative contribution of Yamalo-Nenets Autonomous Okrug and the Sakhalin Oblast was associated with the relocation of significant funds to other regions by OAO Gazprom, for example to the Komi Republic, the construction of the “Yamal-Europe” gas pipeline.
Sectoral structure of investment
Recently the structure of investment in fixed capital by sectors and branches of the Northern regions’ economic activity has not changed radically. Thus, in 2005– 2012 the share of investment of traded and non-traded sectors remained almost unchanged and amounted to 58.9 and 35.8%, respectively, while that of the public and social services sector fell considerably: from 5.8 to 4.9% (tab. 3). Let us mention that the share of investment of the traded sector in the Northern regions was significantly higher than in Russia, and the share of the non-traded sector and the public and social services sector, on the contrary, was much lower. The Northern regions’ raw-material orientation caused this situation.
Investment in mineral extraction prevails in the traded sector of the Northern regions (see tab. 3). In 2012 its share was almost 3.5 times higher than in Russia. The share of investment in manufacturing
Table 3. Structure of investment in fixed capital in terms of the key sectors of the RF Northern regions (in current prices), %*
|
Region |
2005 |
2008 |
2012 |
|||
|
Russian Federation |
Northern regions |
Russian Federation |
Northern regions |
Russian Federation |
Northern regions |
|
|
Economy, total |
100 |
100 |
100 |
100 |
100 |
100 |
|
Traded sector |
34.3 |
58.5 |
34.2 |
57.7 |
35.9 |
59.2 |
|
Agriculture, hunting and forestry |
4.0 |
0.6 |
4.4 |
0.4 |
4.3 |
0.3 |
|
Fisheries |
2.1 |
1.0 |
0.1 |
0.1 |
0.1 |
0.3 |
|
Mining |
13.4 |
55.3 |
14.1 |
54.5 |
16.4 |
56.8 |
|
Manufacturing |
16.8 |
2.3 |
15.7 |
2.7 |
15.1 |
1.8 |
|
Non-traded sector |
58.1 |
35.7 |
65.8 |
42.3 |
54.7 |
35.9 |
|
Production and distribution of electricity, gas and water |
6.6 |
5.1 |
7.7 |
3.8 |
10.7 |
7.2 |
|
Construction |
3.5 |
3.1 |
3.4 |
4.1 |
3.0 |
1.8 |
|
Wholesale and retail trade; repair of motor vehicles, motorcycles, etc. |
3.9 |
0.5 |
3.2 |
0.5 |
3.9 |
0.3 |
|
Hotels and restaurants |
0.3 |
0.1 |
0.4 |
0.1 |
0.5 |
0.0 |
|
Transport and communication |
25.9 |
19.9 |
24.4 |
23.6 |
31.5 |
21.4 |
|
Financial activities |
1.4 |
0.3 |
0.9 |
0.3 |
3.3 |
0.6 |
|
Real estate transactions, lease and services |
16.6 |
6.6 |
16.7 |
5.3 |
1.8 |
4.5 |
|
Sector of government and social services |
7.7 |
5.8 |
8.7 |
4.7 |
9.4 |
4.9 |
|
Public administration and military security, mandatory social insurance |
1.5 |
1.1 |
1.7 |
1.2 |
1.9 |
1.4 |
|
Education |
1.5 |
1.8 |
2.0 |
1.3 |
1.9 |
1.4 |
|
Health and social services |
2.2 |
1.4 |
2.4 |
1.2 |
2.3 |
1.1 |
|
Provision of public utilities, social and personal services |
2.4 |
1.6 |
2.7 |
1.1 |
3.2 |
1.0 |
|
* Calculated by: [5, pp. 934-937; 6, pp. 542-545; 7, pp. 942-945]. |
||||||
industry is still insufficient – 8 times less than in the country as a whole. Less than 1% accrues to agriculture, hunting and forestry, fishing and fish farming. In general, investment in the traded sector is not enough to accelerate the pace of economic growth; the sectoral structure of investment remains inefficient, as the allocations to fixed capital of manufacturing and agriculture are negligible.
Nenets Autonomous Okrug (91.9%), Khanty-Mansi Autonomous Okrug (73.4%), Yamalo-Nenets Autonomous Okrug (67.1%), Chukotka Autonomous Okrug (61.9%) and the Sakhalin Oblast (61.9%) had the highest share of investment in fixed capital of the traded sector among the Northern regions in 2012. Investment in mineral extraction prevailed [5, pp. 934937; 6, pp. 542-545; 7, pp. 942-945].
Kamchatka Krai (24.3%), the Komi Republic (26.2%) and the Sakha (Yakutia) Republic (33.5%) have the low share of investment. In the first two regions it was caused by large-scale investment in fixed capital of transport (pipelines), and in the third –in production and distribution of electricity, gas and water. The sectoral structure of investment of the traded sector is the best possible in the Republic of Karelia, where the funds are equally directed to mineral extraction (13.7%) and manufacturing (24.5%) [5, pp. 934-937; 6, pp. 542-545; 7, pp. 942-945].
The non-traded sector of the Northern regions is marked by investment in fixed capital of transport and communication. Their share amounted to 21.4% in 2012 due to the peripheral location of the regions and the laying of pipelines of large extent (see tab. 3). They are followed by investment in production and distribution of electricity, gas and water, real estate transactions, lease and services, etc. In general, the sectoral structure of investment in the non-traded sector of the North is not effective, as little funds are given to such important industries, as construction, wholesale and retail trade, hotel and restaurant activities, etc.
In 2012 among the Northern regions the Komi Republic (71.6%), the Sakha (Yakutia) Republic (57.8%) and Kamchatka Krai (56.7%) had the largest share of investment in the non-traded sector, mostly investment in transport and communications, real estate transactions, lease and services [5, pp. 934-937; 6, pp. 542-545; 7, pp. 942-945]. Nenets
Autonomous Okrug (7.1%), Khanty-Mansi Autonomous Okrug (23.6%), Yamalo-Nenets Autonomous Okrug (29.4%) and Chukotka Autonomous Okrug (33.5%) had the low share of the non-traded sector due to relatively low investment in infrastructure and high investment in the traded sector [5, pp. 934-937; 6, pp. 542545; 7, pp. 942-945].
There were no significant changes in the sectoral structure of investment of the public and social services sector of the North in 2005–2012, although the share of investment in education, public administration and military security increased slightly (see tab. 3).
The regions with the large share of investment in fixed capital of this sector were the following in 2012: Kamchatka Krai (19%) – due to massive investment in education and health and social services; the Murmansk Oblast (16.8%) and the Arkhangelsk Oblast (10.5%) – due to growing investment in public administration. Nenets Autonomous Okrug (1.0%), the Komi Republic (2.2%), Khanty-Mansi Autonomous Okrug (3.0%) and Yamalo-Nenets Autonomous Okrug (3.5%) were characterized by the small share of investment due to private enterprises’ large scale financing of this sector, i.e., extra-budgetary funds.
In general, the sectoral structure of investment in fixed capital of the Northern regions in terms of their economies development can be considered normal; investment in the traded sector prevail, as it brings in return. However, large scale investment in mining operations on the background of too modest investment in manufacturing raises concern. The share of investment in the public and social services sector, particularly, in education, health and public services, is very low.
Structure of investment by types
The structure of investment in fixed capital by types of fixed assets of the North has changed. So, in 2005–2012 the share of investment in machinery, equipment and vehicles decreased from 36.4 to 30.4% (in Russia – from 41.1 to 36.3%); the reduction (27.9%) was especially sharp in the 2009 crisis year ( tab. 4 ).
This reduction is caused by the export-oriented enterprises’ lack of interest in reindustrialization due to easily obtained large revenues in the pre-crisis and a lack of funds in the crisis and post-crisis periods. At the same time, there was an increase in the share of investment in housing, buildings
(excluding housing) and structures due to grown investment in private housing construction and transmission devices (oil and gas pipelines, transmission lines), infrastructure (transport and terminal facilities) and environmental (waste disposal facilities and sewage treatment plants) objects. It should be noted that this structure is characterized by the high level of other investment associated with high costs for maintenance and deep exploratory drilling for oil and gas. The above trends are typical for the Russian economy as a whole.
The Murmansk Oblast (56.6%), the Magadan Oblast (45.0%), Kamchatka Krai (39.3%) and the Republic of Karelia (38.9%) had the highest share of investment in machinery, equipment and vehicles among the Northern regions in 2012 [3, pp. 59-64]. However, this rather indicates their specialization in manufacturing
Table 4. Dynamics of the structure of investment in fixed capital of the Northern regions by types of fixed assets in 2005–2012, %*
The recent years have witnessed positive and negative changes in investment in fixed capital directions in the Northern regions (tab. 5) .
The positive trends in 2007–2012 include the reduction in the proportion of investment in buildings and structures and the rise in the share of investment in machinery, equipment and vehicles in the new construction ; the increase in the share of investment in buildings and structures in the modernization , reconstruction and acquisition of new fixed assets .
Table 5. Dynamics of the structure of investment in fixed capital of the Northern regions by the key directions in 2007–2012, %*
|
Direction |
2007 |
2008 |
2009 |
2010 |
2011 |
2012 |
|
Russian Federation |
||||||
|
New construction |
||||||
|
Buildings and structures |
78.3 |
77.9 |
76.5 |
75.1 |
75.6 |
75.2 |
|
Machinery, equipment, vehicles |
11.9 |
77.9 |
14 |
14.8 |
14.7 |
15.5 |
|
Modernization and reconstruction |
||||||
|
Buildings and structures |
61.1 |
60.5 |
61 |
64 |
61.8 |
75.2 |
|
Machinery, equipment, vehicles |
36.4 |
36.7 |
35.8 |
33.2 |
32.9 |
15.5 |
|
Acquisition of new fixed assets |
||||||
|
Buildings and structures |
4.6 |
6.3 |
7.2 |
7.1 |
7 |
5.8 |
|
Machinery, equipment, vehicles |
88.8 |
88.9 |
88.1 |
89.9 |
90.1 |
91.1 |
|
Northern regions |
||||||
|
New construction |
||||||
|
Buildings and structures |
78.3 |
73.0 |
76.1 |
76.8 |
76.1 |
75.4 |
|
Machinery, equipment, vehicles |
11.9 |
13.8 |
11.4 |
8.3 |
12.8 |
12.4 |
|
Modernization and reconstruction |
||||||
|
Buildings and structures |
61.1 |
64.2 |
67.9 |
63.2 |
71.1 |
70.9 |
|
Machinery, equipment, vehicles |
36.4 |
25.9 |
23.1 |
31.5 |
21.3 |
22.2 |
|
Acquisition of new fixed assets |
||||||
|
Buildings and structures |
4.6 |
10.0 |
13.7 |
11.8 |
11.3 |
11.4 |
|
Machinery, equipment, vehicles |
88.8 |
81.8 |
78.8 |
83.6 |
82.7 |
85.6 |
|
*Calculated by: [1, pp. 64-69; 2, pp. 64-69; 3, p. 64-69]. |
||||||
The negative trends concern the decline in the share of investment in machinery, equipment, vehicle in the modernization, reconstruction and acquisition of new fixed assets .
In 2012 among the Northern regions the largest share of investment in buildings and structures in the new construction belonged to Kamchatka Krai (96.4%), Chukotka Autonomous Okrug (90.1%), the Republic of Karelia (86.2%) and the Magadan Oblast (84.1%); machinery, equipment and vehicles – the Murmansk Oblast (27.0%), the Komi Republic (19.7%) and the Magadan Oblast (14.1%) [3, pp. 64-69].
The large share of investment in buildings and structures in the modernization and reconstruction belonged to the Sakhalin Oblast (94.6%), Kamchatka Krai (86.2%), Chukotka Autonomous Okrug (85.6%) and the Republic of Karelia (84.2%); machinery, equipment and vehicles – the Murmansk Oblast (44.1%), the Magadan Oblast (43.6%) and the Sakha (Yakutia) Republic (32.3%) [3, p. 64-69].
In the acquisition of new fixed assets the large share (85.6%) belonged to investment in machinery, equipment and vehicles. Such investment was particularly high in the Republic of Karelia (97.1%), the Magadan Oblast (95.2%), Kamchatka Krai (94.4%), the Murmansk Oblast (93.8%) and Chukotka Autonomous Okrug (93.5%) [3, pp. 64-69].
Among the Northern regions the large share of investment in buildings and structures was characteristic of Nenets Autonomous Okrug (48.6%), the Sakha
(Yakutia) Republic (16.0%) and the Komi Republic (15.5%) due to the expenditure on infrastructure, environmental and transmission facilities for production needs.
The process to improve the reproductive structure of fixed assets, investment in fixed capital by directions of the Northern regions is ambiguous. In terms of the payback period (repayment) it is more profitable to invest in the modernization and reconstruction than in the new construction, that is why the increase in the share of investment in this form of reproduction of fixed assets can be considered as a progressive trend. However, if you consider this in terms of enterprises’ innovative development, involving the transition to a qualitatively new technological production level, you need to invest in the new construction. Though they give feedback at later time than investment in the modernization and reconstruction, but boost the production due to scientific-technological progress achievements. If the share of morally and physically outdated industrial enterprises is high, obviously, it is more profitable to invest in the first two directions than in the acquisition of new fixed assets.
Thus, the analysis of the dynamics and the structure of investment in fixed capital of the Northern regions’ economy has revealed the following:
– investment in the Northern regions’ economy, compared with Russia, fell down during the crisis to a lesser extent and rose in the recovery period more quickly due to the implementation of large-scale investment projects;
– the Magadan Oblast, the Komi Republic, the Murmansk Oblast and the Sakha (Yakutia) Republic had high growth rates of investment in fixed capital in the recovery period due to investment in mining, pipeline transport and the low base effect;
– the decline of investment in fixed capital of the Northern regions in 2013 and the expected decline in 2014 is caused by the completion of major investment projects, the limited availability of investment resources (direct investments and loans), the entrepreneurs’ expectations for more favorable conditions to invest, the speculations on the foreign exchange market due to ruble depreciation, the suspension of natural monopolies’ investment programs due to the freezing of tariffs in 2014;
– the Komi Republic, Khanty-Mansi Autonomous Okrug and the Sakha (Yakutia) Republic made a great contribution to the growth of investment in fixed capital of the North in the recovery period due to large investment in oil and gas pipeline transport, oil extraction, production and distribution of electricity, gas and water;
– the sectoral structure of investment in fixed capital has not changed significantly, there is still a high share of investment in the traded sector, especially mining, due to the Northern regions’ specialization in the extractive industries;
– the structure of investment in fixed capital by types has changed dramatically, the share of investment in buildings (excluding housing) and structures has increased, the share of investment in machinery, equipment and vehicles has notably decreased due to reluctant investment in rough manufacturing;
– there are positive and negative trends in the structure of investment in fixed capital by directions . The positive ones include the decline in the proportion of investment in buildings and structures and rise in the share of investment in machinery, equipment and vehicles in the new construction ; the increase in the share of investment in buildings and structures in the modernization and reconstruction and the acquisition of new fixed assets . The negative trends are the following: the decline in the share of investment in machinery, equipment and vehicles in the modernization and reconstruction and the acquisition of new fixed assets.
References Dynamics of investment in fixed capital in the economy of the northern regions
- Investitsii v Rossii. 2009: stat. sb. . Rosstat . Moscow, 2009. 323 p.
- Investitsii v Rossii. 2011: stat. sb. . Rosstat . Moscow, 2011. 303 p.
- Investitsii v Rossii. 2013: stat. sb. . Rosstat . Moscow, 2013. 326 p.
- Natsional’nye scheta Rossii v 2003-2010 godakh: stat. sb. . Rosstat . Moscow, 2011.
- Regiony Rossii. Sotsial’no-ekonomicheskie pokazateli. 2006: stat. sb. . Rosstat . Moscow, 2007. 981 p.
- Regiony Rossii. Sotsial’no-ekonomicheskie pokazateli. 2009: stat. sb. . Rosstat . Moscow, 2009. 990 p.
- Regiony Rossii. Sotsial’no-ekonomicheskie pokazateli. 2013: stat. sb. . Rosstat . Moscow, 2013. 990 p.
- Respublika Sakha (Yakutiya): Megaproekt novoi Rossii . Moscow: Promsvyaz’bank, 2010.
- Sotsial’no-ekonomicheskoe polozhenie Respubliki Komi. Yanvar’-dekabr’ 2009 g. . Komistat . Syktyvkar, 2010.
- Statisticheskii ezhegodnik Chukotki. 2009: statisticheskii sbornik . Anadyr’, 2010.
- Indeksy fizicheskogo ob”ema investitsii v osnovnoi kapital . Available at: C:\DOCUME~1\411-GS~1\LOCALS~1\Temp\info-stat-02-2014.rar\ info-stat-02-2014\07 investitsii\
