Dynamics of Sea and Land Surface Temperatures in the Tropical Belt Based on Satellite Data

Author: Vysotskaya G.S., Pisman T.I., Botvich I.Yu., Shevyrnogov A.P.
Journal: Журнал Сибирского федерального университета. Серия: Техника и технологии @technologies-sfu
Section: Исследования. Проектирование. Опыт эксплуатации
Article in issue: 5 т.18, 2025.
Free access
The study analyzes monthly data of the MODIS-Aqua satellite scanner on the sea surface temperature (SST) for 2002–2021 combined with the Terra-MODIS data on the land surface temperature (LST) for a period between February 2001 and January 2024. Land surface of the continents (America, Africa, and Asia) and ocean (Pacific, Atlantic, and Indian) surfaces in the tropical belt (30° N‑30° S) have been studied. Variations in the proportions of the areas with positive LST trends relative to the total land surface area are cyclical and occur synchronously with the similar SST variations. Each cycle lasts about 5–6 years. Comparison of SST and LST shows that the proportion of areas with the positive SST trends is insignificantly higher than the proportion of the areas with the positive LST trends while the proportion of areas with the negative SST trends is considerably higher than the proportion of the areas with the negative LST trends. For the continents examined in the current study (America, Asia, and Africa), the proportions of the areas with the positive LST trends relative to the total land surface area of these continents change synchronously. The proportions of areas with negative LST trends relative to the total land surface area of these continents are considerably less correlated. The global response of SST and LST is caused by the abrupt change of the sign of the Oceanic Nino Index (ONI) trend from negative to positive.
Continents, oceans, tropics, land surface temperature (LST), sea surface temperature (SST), satellite data, trends, MODIS-Aqua, Terra-MODIS
Short address: https://sciup.org/146283151
IDR: 146283151 | UDC: 528.88
Динамика температуры поверхности океана и суши в тропической зоне по спутниковым данным
В работе проанализированы ежемесячные данные спутникового сканера MODIS-Aqua по температуре поверхности океана (ТПО) за 2002–2021 гг. совместно с данными сканера Terra-MODIS по температуре поверхности суши (ТПС) за период с февраля 2001 по январь 2024 г. Объектами исследований являются поверхность суши материков (Америка, Африка, Азия) и поверхность океанов (Тихий, Атлантический и Индийский) в тропической зоне (300 с.ш.– 300 ю.ш.). Для ТПС выявлено, что изменения долей площадей с различными трендами ТПС от общей площади поверхности суши носят циклический характер и происходят синхронно с аналогичными изменениями ТПО. Периоды циклов составляют около 5–6 лет. При сравнении ТПО и ТПС выявлено, что доля площадей с положительными трендами ТПО незначительно превосходит долю площадей с положительными трендами ТПС, тогда как доля площадей с отрицательными трендами ТПО значительно превосходит долю площадей с отрицательными трендами ТПС. Для исследуемых материков (Америка, Азия, Африка) показано, что доля площадей с положительными трендами ТПС от общей площади поверхности суши этих материков меняется синхронно. Доли площадей с отрицательными трендами ТПС от общей площади поверхности суши этих материков коррелируют в существенно меньшей степени. Выявлено, что глобальный отклик ТПО и ТПС возникает при резкой смене знака тренда океанического индекса Эль-Ниньо (ONI) с отрицательного на положительный.
Text of the scientific article Dynamics of Sea and Land Surface Temperatures in the Tropical Belt Based on Satellite Data
Цитирование: Высоцкая Г. С. Динамика температуры поверхности океана и суши в тропической зоне по спутниковым данным / Г. С. Высоцкая, Т. И. Письман, И. Ю. Ботвич, А. П. Шевырногов // Журн. Сиб. федер. ун‑та. Техника и технологии, 2025, 18(5). С. 634–643. EDN: LFMYNE
Climate research has always been based on analysis of time series, which are quasi-periodic and non-stationary [4].
Global changes in the Earth’s climate are directly related to climate changes in the Global Ocean and are determined by thermodynamic interactions with the atmosphere. Dynamics of the air temperature has attracted the greatest research effort. In recent years, however, special consideration has been given to the role of the ocean in the current climate change.
Analysis of the climate data on sea surface temperature (SST) and land surface temperature (LST) in the tropics can reveal possible relationships between solar activity and climatic processes [1]. Research in this field can contribute to a deeper insight into mechanisms of climate formation and the production of more accurate forecasts of climate change.
The purpose of the present research was to study the dynamics of land surface temperature (LST) trends in the Earth’s tropical zone (30° N – 30° S) for a period between 2001 and 2024 and sea surface temperature (SST) trends for a period between 2002 and 2021 based on satellite data.
Material, data and methods
Land surface of the continents (America, Africa, and Asia) and surface of the oceans (Pacific, Atlantic, and Indian) in the tropics (30° N – 30° S) were studied.
The study analyzes monthly data of the MODIS-Aqua satellite scanner on the sea surface temperature with a resolution of 4320×2160 (9 km at the equator) for 2002–2021 from the Ocean Color Data web site [5] combined with the Terra‑MODIS data on the land surface temperature, Terra‑MODIS (MOD 11С3.061), for a period between February 2001 and January 2024.
In the current study, trends of ocean surface temperature were analyzed for a period between July 2002 and the present time in five‑year (60‑month) intervals. Changes in the ocean temperature were calculated for each pixel, seasonal dynamics being subtracted from the time series. Then, similar trends were calculated for the same period with a 1-month shift until the period between August 2016 and July 2021. Statistical significance of the positive or negative dynamics was assessed when calculating each trend. Then, the numbers of reliably positive and negative trends and the difference between those numbers were calculated for each pixel.
In a similar way, with the same shift and interval, trends of land surface temperature were calculated using Terra‑MODIS (MOD 11С3.061) data for a period from February 2001 to January 2024. The numbers of reliably positive and negative trends and the difference between those numbers were calculated for each pixel.
Results and discussion
The surface between 30° N and 30° S constitutes half the Earth’s surface, making a major contribution to regulation of the Earth’s heat budget. It absorbs a substantial part of solar energy and preserves it, influencing the climatic processes; it receives the greatest amount of the solar radiation and can serve as an indicator of variations in solar activity.
In the tropical zone, warming processes prevail in the Atlantic and Indian Oceans and in the western part of the Pacific Ocean (Fig. 1a). On land, considerable warming is observed in tropical Africa (Fig. 1b).
Comparison of Fig. 1a and Fig. 1b demonstrates that warming processes on land prevail most where either there is no effect of the ocean at all or warming also prevails in the adjacent ocean parts.
Moreover, the areas where the negative trends prevail are incomparably smaller on land than in the ocean.
Then, different parts of land surface, namely parts of the continents of America, Asia, and Africa situated between 30° N and 30° S, were selected. For each part of the land surface, its area and the proportion of the areas with the trends with different signs relative to this area were calculated.
In the tropical zone, the proportions of areas with different LST trends relative to the total land surface vary cyclically (Fig. 2). Each cycle lasts about 5–6 years. The process reaches the greatest scope in periods of 2000.02–2005.01, 2006.03–2011.02, and 2011.08–2016.07.
The proportion of the areas with the positive LST trends is in opposition to the proportions of the areas with no variations in LST trends. Over about 6 years, the proportion of the areas with the
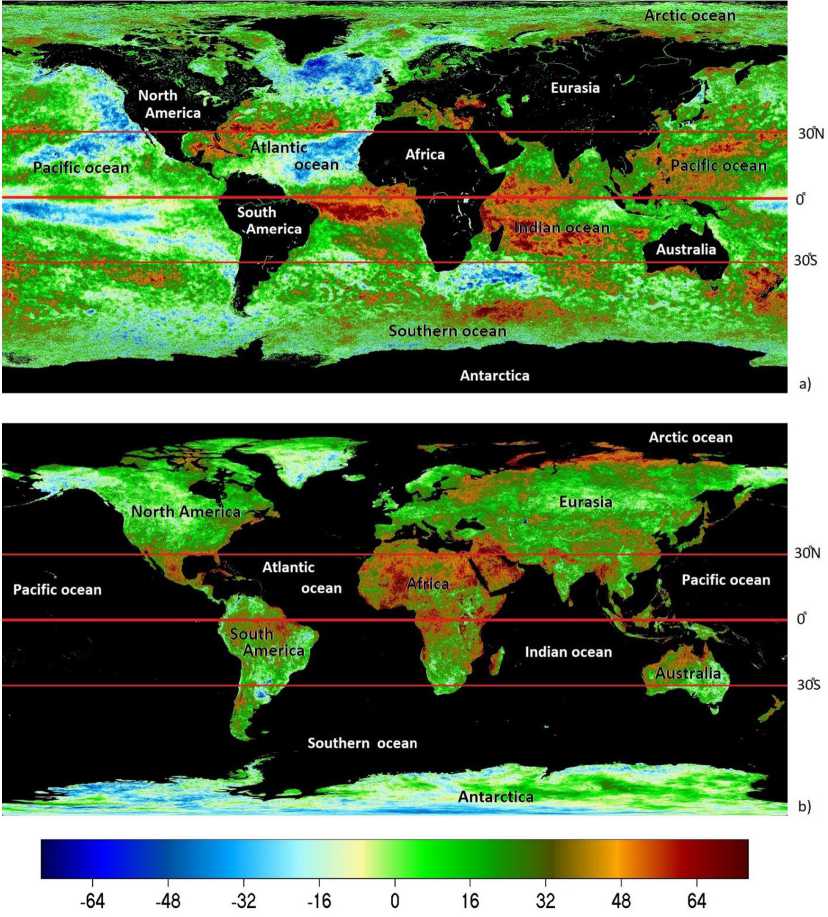
Fig. 1. Spatial distribution of the differences between the numbers of the positive and negative trends of the a) ocean surface temperature and b) land surface temperature positive LST trends drops from 50 % to 10 %. Within the same period, the proportion of the areas with the negative LST trends is increased insignificantly (approximately from 0 to 20 %). The proportion of the areas with the negative LST trends is weakly correlated with the proportions of the areas with no variations in the LST trends (Fig. 2).
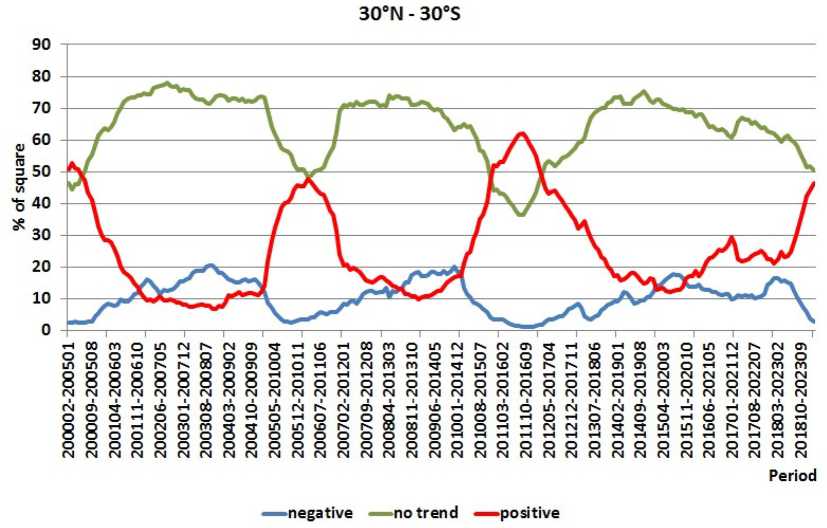
Fig. 2. Temporal dynamics of the proportions of the areas with different directions of LST trends relative to the total land surface area in the tropical zone
For the continents examined in the current study (America, Asia, and Africa), the proportions of the areas with the positive and negative LST trends relative to the total land surface area change sufficiently synchronously (Fig. 3), and this synchrony is considerably higher for the positive LST trends. This is supported by the data in Table 1.
The proportion of the areas with the positive SST trends is insignificantly higher than the proportion of the areas with the positive LST trends (Fig. 4a), but the proportion of the areas with the negative SST trends is considerably higher than the proportion of the areas with the negative LST trends (Fig. 4b). In addition, coefficients of correlation between the proportions of the areas with positive trends are substantially higher than coefficients of correlation between the proportions of the areas with negative trends (Table 2).
Comparison of Tables 1 and 2 shows that the events accompanied by the large-scale spread of the similarly directed trends concern both components of the ocean–atmosphere system.
It has been assumed that the SST in the tropical zone should be most sensitive to variations in solar activity. The most important thermodynamic mechanism of energy transformation in the tropics is the El Nino – Southern Oscillation (ENSO) phenomenon observed in the Pacific Ocean. This phenomenon exhibits quasi-periodicity of 5–7 years [4].
The list below demonstrates that the El Nino event is not rigidly related to the observed events of the synchronous distribution of positive trends over the major part of the tropical belt area.
30°N - 30°S positive trends
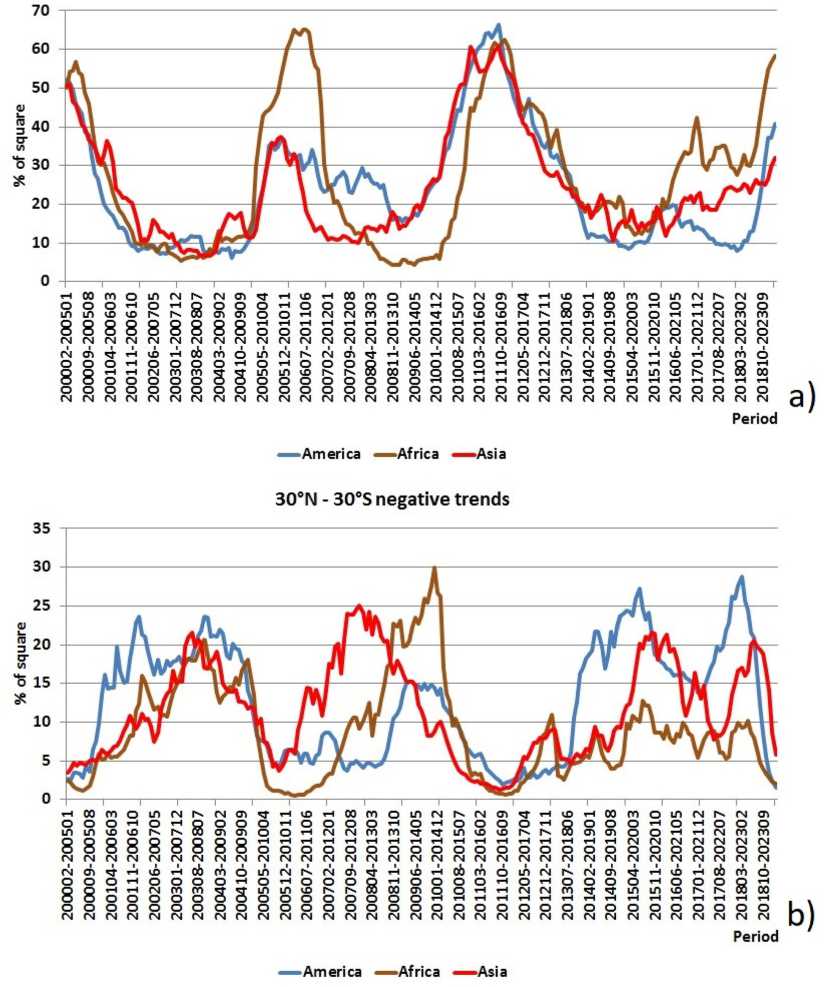
Fig. 3. Temporal dynamics of the proportions of the areas relative to the total land surface area in the tropical zone for different continents a) with positive LST trends, b) with negative LST trends
Table 1. Coefficients of correlation (synchrony) between proportions of the areas with differently directed trends over the entire land surface between 30° N and 30° S and on different continents
|
Areas between which correlation is calculated |
Negative trends |
No trend |
Positive trends |
|
Land – America |
0.744807 |
0.860015 |
0.889601 |
|
Land – Africa |
0.884261 |
0.922828 |
0.935074 |
|
Land – Asia |
0.700855 |
0.8514 |
0.874689 |
|
America – Africa |
0.459352 |
0.62001 |
0.695923 |
|
America – Asia |
0.34019 |
0.880435 |
0.859161 |
|
Africa – Asia |
0.464512 |
0.608037 |
0.678267 |
Note: Column 1 (Negative trends) relates to Fig. 3 b, Column 3 (Positive trends) relates to Fig. 3a. – 639 –
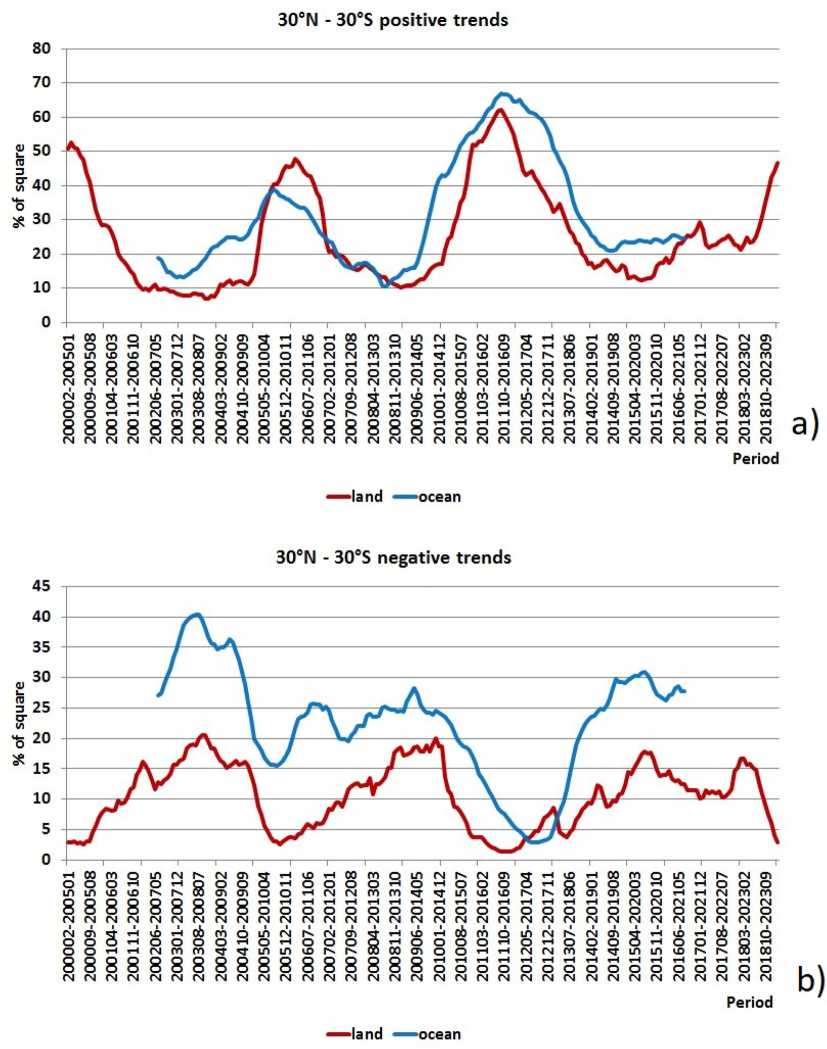
Fig. 4. Temporal dynamics of the proportions of the areas with the positive (a) and negative (b) SST and LST trends relative to the total surfaces of the ocean and land in the tropical zone
Table 2. Coefficients of correlation (synchrony) between proportions of the areas with differently directed trends over the entire ocean surface between 30° N and 30° S and proportions of the areas with differently directed trends over the entire surface of the land and different continents
|
Areas between which correlation is calculated |
Negative trends |
No trend |
Positive trends |
|
Ocean – Land |
0.793368 |
0.735768 |
0.866401 |
|
Ocean – America |
0.796483 |
0.796946 |
0.848943 |
|
Ocean – Africa |
0.552891 |
0.581655 |
0.716616 |
|
Ocean – Asia |
0.624229 |
0.689305 |
0.911301 |
Note: Column 1 (Negative trends) relates to Fig. 4b, Column 3 (Positive trends) relates to Fig. 4a.
-
1. El Nino: 2023–24 SOI: Moderate to strong SST: Moderate to strong
-
2. La Nina: 2020–23 SOI: 2021 moderate to strong SST: Moderate to strong
-
3. El Nino: 2015–16 SOI: Moderate to strong SST: Very strong
-
4. La Nina: 2010–12 SOI: Strong
-
5. El Nino: 2009–10 SOI: Weak to Moderate SST: Moderate
-
6. La Nina: 2008–09 SOI: Weak to Moderate SST: Weak
-
7. La Nina: 2007–08 SOI: Weak to Moderate SST: Moderate
-
8. El Nino: 2006–07 SOI: Weak SST: Weak
-
9. El Nino: 2002–03 SOI: Weak SST: Weak to Moderate
-
10. La Nina: 1998–01 SOI: Moderate SST: Moderate
-
11. El Nino: 1997–98 SOI: Strong SST: Very strong [6].
The fluctuation between the unusually warm (El Nino) and cold (La Nina) conditions in the Pacific tropics makes the greatest contribution to year-to-year climate variations on Earth [7]. El Nino and La Nina closely interact with the Southern Oscillation, which covers the tropical regions of the Indian and Pacific Oceans.
El Nino is characterized by the Oceanic Nino Index – ONI – for the 2000–2024 period, which is cited unchanged from the web site of the NOAA Climate Prediction Centre [8]. ONI is the parameter that traces anomalies of the sea surface temperature in the central equatorial region of the Pacific Ocean. ONI is the moving three-month average of the average SST anomalies based on the data in the area located at (120°‑170°W, 5°S‑5°N) [9].
Comparison of Fig. 3a and Fig. 2–4 shows that a mere temperature rise in this area does not necessarily lead to the wide distribution of positive trends. Therefore, slopes of trends were calculated in the moving mode at 60-month intervals (Fig. 5b). Comparison of Fig. 5b and Fig. 2–4 demonstrates that the global response of SST and LST is associated with the abrupt change of the sign of the ONI trend from negative to positive. Then, we calculated coefficients of correlation between the slope of ONI trends in the moving mode and the percent distribution of positive trends: 0.79 for the ocean in the tropics, 0.74 for the land in the tropics, 0.9 for America, 0.83 for Asia, and 0.49 for Africa without temporal shift and 0.55 with a 5–6-month temporal shift.
Conclusion
The study analyzed monthly data of the MODIS-Aqua satellite scanner on the sea surface temperature (SST) for 2002–2021 combined with the Terra-MODIS data on the land surface temperature (LST) for a period between February 2001 and January 2024. Land surface of the continents (America, Africa, and Asia) and ocean (Pacific, Atlantic, and Indian) surfaces in the tropical belt (30° N‑30° S) were studied.
The results suggested the following conclusions:
-
– Variations in the proportions of the areas with positive LST trends relative to the total land surface area are cyclical. Each cycle lasts about 5–6 years.
-
– Comparison of SST and LST revealed that the proportion of areas with the positive SST trends is insignificantly higher than the proportion of the areas with the positive LST trends. However, the proportion of areas with the negative SST trends is considerably higher than the proportion of the areas with the negative LST trends.
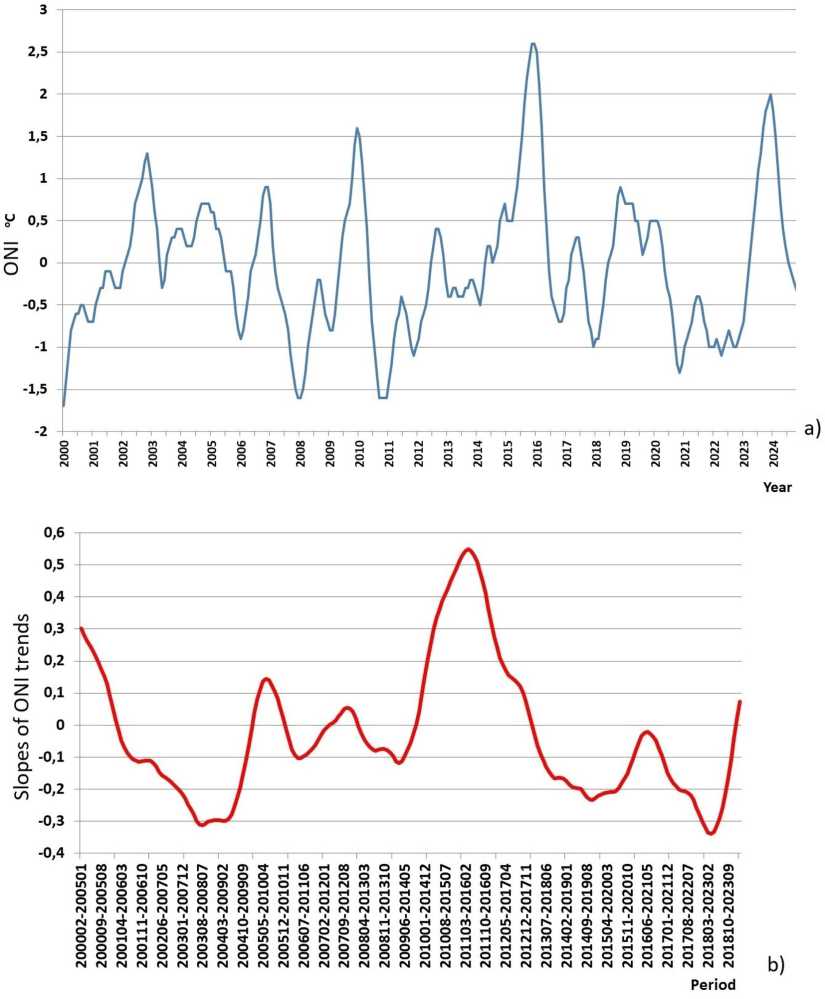
Fig. 5. Temporal dynamics of the Oceanic Nino Index (ONI) – (a) and slopes of ONI trends in the moving mode – (b)
-
– For the continents examined in the current study (America, Asia, and Africa), the proportion of the areas with the positive LST trends relative to the total land surface area of these continents changes synchronously. The synchrony of changes in the proportions of areas with negative trends is considerably lower.
-
– The global response of SST and LST is caused by the abrupt change of the sign of the Oceanic Nino Index (ONI) trend from negative to positive.
