Early detection of osteoarthritis based on cartilage thickness in knee X-ray images

Author: Shivanand S. Gornale, Pooja U. Patravali, Prakash S. Hiremath
Journal: International Journal of Image, Graphics and Signal Processing @ijigsp
Article in issue: 9 vol.11, 2019.
Free access
Arthritis is a joint disorder featuring inflammation. There are numerous forms of Arthritis. Arthritis essentially causes joint dis-functioning which may further tend to cause deformity and disability. Osteoarthritis (OA) is one form of arthritis which is mostly seen in old age group. A patient suffering from OA needs to visit medical experts where clinical and radiographic examination is carried out. Analysis of bone structures in initial stage is bit complex. So any vague conclusion drawn from the radiographic images may make the treatment faulty and troublesome. Thus to overcome this we have developed an algorithm that computes the cartilage area/thickness using various shape descriptors. The computed descriptors obtained the accuracy of 99.81% for K-nearest neighbour classifier and 95.09% for decision tree classifier. The estimated cartilage thickness is validated by radiographic experts as per KL grading framework which will be helpful to the doctors for quick and appropriate analysis of ailment in the early stage. The results are competitive and promising as reported in the literature.
Knee X-ray, Osteoarthritis (OA), ROI, Cartilage area, Decision tree, K-NN
Short address: https://sciup.org/15016083
IDR: 15016083 | DOI: 10.5815/ijigsp.2019.09.06
Text of the scientific article Early detection of osteoarthritis based on cartilage thickness in knee X-ray images
The knee joint is one of the strongest and most significant joints in the human body. It enables the lower leg to move with respect to the thigh while supporting the body's weight. The knee joint is crucial to numerous ordinary exercises, including walking, running, sitting and standing. Knee Osteoarthritis (KOA) restricts the knee joint movement causing deformity and disability.
Patients suffering from knee joint pain are asked to go for X-ray imaging in the initial stages. The radiological features of Knee OA include joint space narrowing, loose bones, sclerosis etc [10]. In a Knee joint the area between femur and tibia called cartilage plays very important role in diagnosis of OA. The thickness of the cartilage can specify the disease severity based on which medications are prescribed by the experts to the patients. Form the literature it found that there are no any standard tools available for the measurement of cartilage thickness. The main objective of this experimentation is to evaluate the disease in the early stage by estimating the cartilage thickness/area using different machine learning techniques [4] [9]. The computed cartilage area/thickness is further validated by medical expert as per Kellgren and Lawrence grading system which will be helpful to the doctors for quick and appropriate analysis of OA in the early stage [25]. The Kellgren and Lawrence framework is given in the Table 1 below.
|
KL Grades |
OA Analysis |
|
Grade0(Normal OA) |
Radiographic parameters related to OA are absent |
|
Grade1(Doubtful OA) |
Reduced joint space width |
|
Grade2(Mild OA) |
Clear/ visible narrowing of joint space |
|
Grade3(Moderate OA) |
Numerous bony outgrowths, sclerosis |
|
Grade4(Severe OA) |
Massive bone spurs, extreme sclerosis, bone deformity |
In the rest of the paper, Section-II reveals the earlier work that incorporates cartilage analysis for the assessment of disease. Section-III represents the methodology proposed. The experimental results with experts validation is given in Section-IV and lastly conclusions are drawn in Section-V.
-
II. Related Work
The earlier work reveals that the researchers have tried using different statistical and performance analysis techniques to compute the cartilage thickness for the detection of ailment [10]. Different computer aided approaches have been proposed for the acknowledgment and grading of Osteoarthritis utilizing X-ray and MRI images of Knee Osteoarthritis. Nabil Mehta et al[1] , has compared two different radiographic techniques for computation of joint space width. The techniques used are computerized surface delineation method and normal digitization method. The surface fit method demonstrated better results for measuring joint space width in medial compartment but for lateral compartments joint space width were similar for both the methods. Heidi L Oksendahl et al[3] , have used metatarsal phalangeal semi-flexed radiographic technique to measure the joint space width using Knee x-ray images in lateral and medial compartments. The authors concluded that lateral compartment mean joint space width (6.2mm) was greater than medial compartment mean joint space width (3.9mm) and came across that medial compartment is more effective in documenting the progression of OA than the lateral compartment.
S. S. Gornale et al, have used contour based segmentation method for the analysis of OA using Knee x-ray images [11-14]. The semi-automated approach was utilized for extracting the region of interest. Features like texture based, shape, statistical and Zernike moments were computed and classified using Random forest and K-Nearest Neighbour classifiers. The accuracies of 87.92% and 88.88% were obtained respectively [11-12]. Further utilizing the same method for extracting region of interest histogram gradients were computed and classified using multiclass SVM achieving the accuracy of 95% [13]. The implementation was further conceded using different segmentation methods like Prewitt, Sobel, Texture based and Otsu’s based methods [14]. Among all the methods Prewitt method obtained a better accuracy of 97.55% compared to other methods. In [15] automatic identification of cartilage region is obtained for OA analysis. The accuracy of 97.86% is demonstrated using various local and gradient features. Lior Shamir et al. [2], have developed a systematic computer assisted technique for recognition of OA using knee x-ray images. WND-CHRM algorithm is used to analyze the images based on various features, namely, Zernike features (first four moments), Tamura texture features, Haralick features, Chebyshev statistics and multiclass histograms. The features are classified using weighted nearest neighbour classifier. The experimental outcome specify the classification rate of 91.5% for Moderate OA against normal OA and 80.4% for Minimal OA differentiated from normal. However, it is observed that the time unpredictability for joint detection is negligible, but to classify an x-ray image it takes 105s. Further, it is proposed to include parallel processing to reduce computational complexities and consider longitudinal knee x-ray images for OA detection.
From the literature it is observed that, Cartilage region is a prime factor/parameter for the examination of OA. The cartilage thickness or joint space width between femur and tibia helps in understanding the disease severity which may help the subjects for appropriate treatment. Many researchers have utilized various semi automated techniques in estimating cartilage thickness for evaluating the severity of disease. Therefore there is need of automatic of algorithm/technique that aide in speedy estimation of thickness for early identification of the ailment.
-
III. Proposed Methodology
-
3.1. Data set
A dataset of 1650 Knee x-ray images are considered for the implementation that are collected from different health centers with DICOM standards. DICOM (Digital imaging and Communications in Medicines) standard is international standard to transmit, store, retrieve, print,
3.2. Bone edge detection
The proposed methodology is implemented using preprocessing techniques like bone edge detection and noise removal of knee X-ray, identification of region of interest (Osteoarthritis region) based on density, segmenting the obtained ROI using active contour method, computation of cartilage area between femur and tibia and classification of Osteoarthritis into Kellgren and Lawrence grades using decision tree and k-nn classifier. The flow diagram of the proposed methodology is shown in Figure 1.
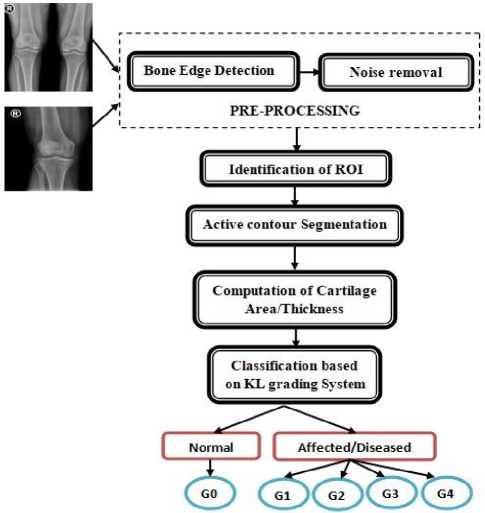
“Fig.1. Block Diagram (G-0: Normal, G-1: Doubtful, G-2: Mild, G-3: Moderate, G-4: Severe)”
process and display medical imaging information. It makes information interoperable and also meets the evolving technologies and requirements of medical imaging [7]. Each and every Knee x-ray is manually assigned a KL grade by an orthopedician who examine 65 to 110 radiographic images per day. The annotations made by expert as per KL grading framework is given in Table 2.
Table.2. Kellgren and Lawrence grades assigned by Medical Expert
|
KL Grade |
Medical Expert Opinion |
|
Normal(G-0) |
514 |
|
Doubtful(G-1) |
477 |
|
Mild(G-2) |
232 |
|
Moderate(G-3) |
221 |
|
Severe(G-4) |
206 |
|
Total |
1650 |
Edges are noticeable variations that are encapsulated by salient shape features of a particular image. In this proposed work, detection of bone edges is implemented by finding the difference between the neighboring pixels [15]. The bone edge detection at pixel (x, y) for input image A with respect to row and column is given in equations (1) and (2). The output of bone edge detection is shown in Fig 2.
A (x, y ) = A (x, y)-A (x -1, y) (1)
A(x,y) = A(x,y)-A(x,y -1) (2)
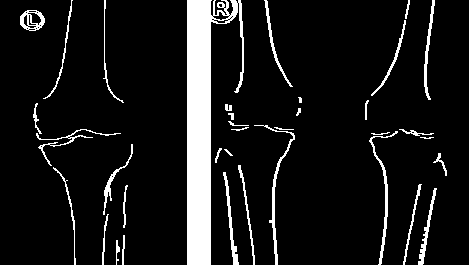
Fig. 2. Detection of Bone edges
-
3.3. Noise Removal
-
3.4. Identification of Region of Interest
Mainly x-ray images are eminent in salt and pepper noise. Adaptive median filtering is helpful in lessening salt and pepper noise or impulsive noise and beneficial in preserving edges of an image that result in reduction of irregular noise [18][22].
Identification of region of interest of an image can be implemented by partitioning the entire image into significant structures. The required or interested structures or objects from the partitioned image can be segregated from background or foreground. It can be scaled, estimated or evaluated for processing. The whole identification process is divided into 4 steps: firstly segment the complete image into many parts row wise along the axes. Secondly, extract the region of interest (ROI) from each segmented part. Thirdly estimate the area of each segmented part to detect the bone density [6]. The region in the image that is denser or thicker, results in high density value [14]. Lastly extract the region with high density value and enhance it using sine adaptive filter [19]. The steps used by sine adaptive filter are given in equations (3) to (6)
|
CF = 0 |
: П :0 2 |
(3) |
|
K = П 2 |
FW * П 2 |
(4) |
|
CF ( CF |
> K ) = n 2 |
(5) |
|
l out = I |
in sin ( CF ) |
(6) |
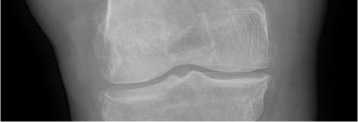
(a)
(b)
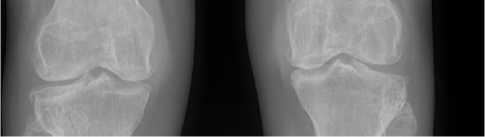
Fig.3. Identification of Region of interest: (a) Single knee ROI (left/right) (b) ROI identification both left and right
-
3.5. Active Contour Segmentation
After identifying the region of interest next step is to extract/segment the cartilage region using active contour algorithm. The identified region of interest along with specific mask is given as an input to the active contour algorithm that uses Chan-Vese method [13] for implementation. The whole process is done automatically without any manual interactions.
An active contour or snake is a curvature characterized in an image that is permitted to change its area and shape until it best fulfils predefined conditions [5][21]. It very well may be utilized to fragment an item by giving it a chance to settle much like a contracting snake around the frontier of an entity [13].
A snake S is frequently modeled as a parameterized curve S(c) = (x(c), y(c)) where the parameter c varies from 0 to 1. So, S (0) gives the coordinate pair (x (0), y (0)) of the starting point, S (1) gives the end coordinates, and S(c) with 0 < c < 1 gives all intermediate point coordinates [8][21]. The boundaries of targeted mask are used by active contour as the initial state of contour evolution to segment the foreground and background regions of the input image [13].
En = J En (S (c)) = J ((En (S (c)) Ene (S (c)) Enc (S (c))) ds
The term Eni depends on internal powers of the snake. The term Ene depends on external powers. The last term Enc can be utilized to vigor extra imperatives, such as, fining the production of loops in the snake, or fining an undesired image surroundings. The output of active contour segmentation is depicted in figure 4 below
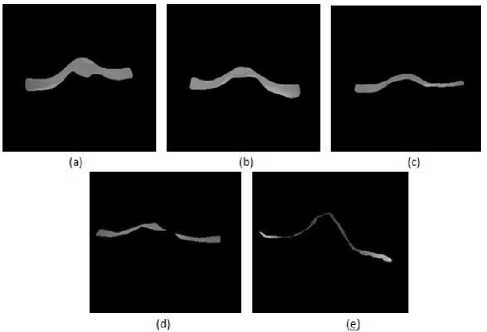
Fig.4. ROI extraction using active contour method: (a) Normal (G0) (b) Doubtful (G1) (c) Mild (G2) (d) Moderate (G3) (e) Severe (G4)
-
3.6. Feature Extraction
-
3.7. Classification
The image dataset of 1650 Knee x-rays are considered for the experimentation. The proposed algorithm is implemented using decision tree and K-NN classifiers.
Shape is a significant and essential component which is utilized to portray the image content. The main problem dealing with the shape is progressively unpredictable due to distortions present in an image. The depiction of shape is predominantly dependent on shape characteristics which are either found on the shape boundary or boundary substances. Shape descriptors should be capable of finding the equivalent shapes from the image dataset for obtaining good retrieval accuracy [17]. The shape descriptors like Major Axis length, Minor Axis length, Perimeter and Area were computed using this region. The respective equations are given below
Area is number of pixels in an image.
Major Axis length= (m+n) (8)
Where, m, n is the distances from each focus to any points on the ellipse.
Minor Axis length= ^( m + n )2 — f 2 (9)
Where, f is the distance between foci and m, n are the distances from each focus to any points on the ellipse.
Decision tree : It is widely used classifier for multiclass problems. In decision tree the outcome is demonstrated in terms of leaf node where as non-leaf nodes depicts the decision. Here the various decedents are encircled based on the attributes examined by non-leaf nodes. The major step while building the decision tree is to figure out which characteristic is to be investigated and which among numerous possibility tests dependent on characteristic has to be performed. In decision tree the important query is to estimate the optimal partition of m components into n sections [16]. Every leaf is allocated one single class corresponding to most suitable target value. It may so happen that the leaf node may hold the probability vector specifying target attribute comprising some specific value. Further the classification is carried out by navigating from the root to a leaf along the path.
K Nearest Neighbors (K-NN): In k-NN the affinity between the test data and the training set is virtually obtained by the classifier [14]. K- Nearest Neighbour will classify the class label based on measuring the distance between testing and training data. KNN will classify by suitable K value which in turn finds the nearest neighbor and provides a class label to un-labeled images [7]. Depending on the types of problem, a variety of different distance measures can be implemented [23] [24]. In this work, City-block distance, Cosine, Correlation and Euclidean distance is considered with K=3 which is empirically fixed throughout the experiment. Basically, K-NN is non-parametric classifier which finds the minimum distance d between training sample M and testing pattern N i and T=3 using equation (10).
d Eucidean ( M , N ) = 4 ( M - N ) ' ( M - N ) (10)
-
IV. Experimental Analysis
In this work, the dataset of 1650 knee X-ray images with DICOM standards are considered for the experimentation. The cartilage area is calculated using various shape descriptors. The computed area/thickness is classified as per Kellgren and Lawrence grading framework using decision tree and K-nn classifiers. Following are the steps followed to compute the proposed methodology for early detection of OA based on cartilage thickness.
Input: Digital Knee X-ray image
Output : Computing thickness of cartilage area grade wise.
Step 1: Acquisition of Digital knee X-ray with DICOM standard.
Step 2: Pre-processing
Step 2.1: Bone edge detection i.e. detecting the edges of the image by finding the difference between with neighboring pixels.
Step 2.2: Noise removal with adaptive median filter for edge enhancement and to preserve edges.
Step 3: Identification of region of interest
Step 3.1: Segment the image into multiple parts based on pixel density.
Step 3.2: Extract Region of interest from each segment.
Step 3.3: Calculate the area in each segmented part and enhance the image with the adaptive sine filter.
Step 3.4: Detect the bone edges in the upper and lower layer and extract it from the original image.
Step-4: Automatic segmentation of the ROI using active contour method.
Step-5: Compute the thickness of cartilage area using segmented image.
Step-6: Classification of image grade-wise based on the thickness of cartilage area.
End
The experimentation is carried out using 2-fold cross validation, to examine the robustness and optimality of the algorithm. For the image dataset of 1650 images, 50% images are trained and 50% images are tested. This process is repeated 5 times and the average accuracies are considered. The implementation was performed using decision tree and K-NN classifier.
Table.3.Aggregate Accuracies using two classifiers
|
Classifiers |
Aggregate Accuracies |
|
K-NN |
99.81% |
|
Decision tree |
95.09% |
Table.4.Confusion Matrix of classification by K-NN classifier
|
Class |
Normal |
Doubtful |
Mild |
Moderate |
Severe |
|
Normal |
512 |
0 |
0 |
0 |
0 |
|
Doubtful |
2 |
477 |
0 |
0 |
0 |
|
Mild |
0 |
0 |
232 |
1 |
0 |
|
Moderate |
0 |
0 |
0 |
220 |
0 |
|
Severe |
0 |
0 |
0 |
0 |
206 |
Table.5.Confusion Matrix of classification by Decision tree classifier
|
Class |
Normal |
Doubtful |
Mild |
Moderate |
Severe |
|
Normal |
468 |
18 |
4 |
1 |
0 |
|
Doubtful |
36 |
447 |
0 |
0 |
0 |
|
Mild |
10 |
10 |
228 |
0 |
0 |
|
Moderate |
0 |
0 |
0 |
220 |
0 |
|
Severe |
0 |
2 |
0 |
0 |
206 |
In this work, along with the classification accuracy, the performance of the proposed method is evaluated with the following matrices like Precision, Recall and F-measure. The precision and recall are given in equation (11) and (12)
P
Pr ecision
T p
T p + F p
T
= P
Re call
T P + F N
Where, TP stands for True Positive, FP stands for False Positive and FN stands for False Negative. F-measure/score computes the test accuracy. F-measure is given in the equation (13)
P *R
Pr ecision Re call
Measure / T) D \
( P Pr ecision + R Re call )
The Precision, Recall and F-measure for both the classifiers are given in table 6.
|
Classifiers |
Precision |
Recall |
F-Measure |
|
K-NN |
0.9983 |
0.9983 |
0.9983 |
|
Decision tree |
0.9652 |
0.9577 |
0.9614 |
From the proposed methodology it is observed that there is some miss-classification with respect to medical expert opinion as it subjective in nature. However, there are no any computer aided appropriate and automatic methods available for Osteoarthritis recognition that can give 100% recognition. In view of this no doctors are going to lose their jobs, however this proposed methodology would be helpful to doctors to assist the ailment for early detection.
The graphical representation of expert opinion and proposed methodology using K-NN and decision tree classifier is shown in figure 5. Further the experimentation was carried out to compute the thickness of the cartilage i.e. the area between the femur and tibia. The computed thickness in as per Kellgren and Lawrence grading system is given in table 7 below
Table.7. Mean and Standard deviation of Cartilage thickness grade wise
|
Classes |
Computed Cartilage thickness (mm) |
|
Grade0 (514) |
6.332±1.309 |
|
Grade1 (477) |
5.274±1.002 |
|
Grade2 (232) |
4.469±0.889 |
|
Grade3 (221) |
3.289±0.579 |
|
Grade4 (206) |
2.407±0.305 |
From the above table it is clearly seen that the thickness is high for Normal grade and very small for severe grade. Generally, manual interpretations of knee x-ray images are bit complex and may take some time for the analysis. The experts’ opinion may differ during the initial stages of Osteoarthritis which may make the treatment faulty and intricate. Based on the thickness of the cartilage doctors may classify the severity of the disease in the initial stage.
-
V. Discussion
A dataset of 1650 knee X-ray images that are annotated by medical expert as per KL grading system are used to implement the proposed method. The main objective of
the algorithm is to compute the cartilage thickness using distinctive geometrical features. The computed features are classified using K-NN and decision tree classifiers obtaining the accuracies of 99.81% and 95.09% respectively. The computed cartilage thickness is assigned KL grades which are further validated by medical expert. From the computations it was observed that the Knee cartilage thickness has highest value for Normal grade (G-0) and least value for Severe grade (G-4). In view of these qualities procured experts/doctors can undoubtedly perceive the ailment in lesser time and may start the treatment at the earliest. Further the study is carried out to find the co-relation between the joint space width and cartilage thickness for early detection of OA.
Conflict of Interest
The authors declare no conflict of interest regarding the publication of this work.
Acknowledgement
References Early detection of osteoarthritis based on cartilage thickness in knee X-ray images
- Nabil Mehta, Jeffrey Duryea, Gary J. Badger, Matthew R. Akelman , Morgan H. Jones , MPH, Kurt P. Spindler, and Braden C. Fleming, “Comparison of 2 Radiographic Techniques for Measurement of Tibiofemoral Joint Space Width”, The Orthopaedic Journal of Sports Medicine, 5(9), 2325967117728675, DOI: 10.1177/2325967117728675.
- Lior Shamir, Shari M.Ling,William W.Scott, Angelo Bos, Nikita Orlov, Tomasz Macura, D.Mark, Luigi Ferrucci, Ilya G.Goldberg “Knee X-ray Image Analysis Method for Automated Detection of Osteoarthritis”, IEEE Transactions on Biomedical Engineering, February 2009, Volume 56, No.2, DOI: 10.1109/TBME.2008.2006025, pp.407-415.
- Heidi L. Oksendahl, Nigel Gomez, Colleen S. Thomas, Gary Badger, Michael J. Hulstyn, Paul D. Fadale, and Braden C. Fleming, “Digital Radiographic Assessment of Tibiofemoral Joint Space Width: A Variance Component Analysis”, J Knee Surg. 2009 Jul; 22(3): PP:205–212, PMID: 19634723.
- J Christopher Buckland-Wright, Diana G Macfarlane, John A Lynch, M Kris Jasani, Charles R Bradshaw, “Joint space width measures cartilage thickness in osteoarthritis of the knee: high resolution plain film and double contrast macro-radiographic investigation”, Annals of the Rheumatic Diseases 1995; 54: PP: 263-268.
- K.R.Ananth, Dr.S.Pannirselvam “A Geodesic Active Contour Level Set Method for Image Segmentation”, I.J. Image, Graphics and Signal Processing (IJIGSP), MECS Publisher, 2012, Volume 4, No.5, June 2012, ISSN: 2074-9074 (Print), ISSN: 2074-9082(Online), DOI: 10.5815/ijigsp.2012.05.04, pp.31-37.
- Jukka Hirvasniemi, Jaakko Niinimaki, Jerome Thevenot, Simo Saarakkala, “Bone Density and Texture from Minimally Post-Processed Knee Radiographs in Subjects with Knee Osteoarthritis”, Annals of Biomedical Engineering, 2019 May, 47(5):1181-1190. Doi: 10.1007/s10439-019-02227-y. Epub 2019 Feb 14.
- S .S Gornale, Abhijit Patil and Mallikarjun Hangarge and R Pardesi. (2019) Automatic Human Gender Identification Using Palmprint. In: Luhach A., Hawari K., Mihai I., Hsiung PA., Mishra R. (eds) Smart Computational Strategies: Theoretical and Practical Aspects. Springer, Singapore. ISBN: 978-981-13-6295-8, pp.: 49-58, 22 March 2019.DOI: https://doi.org/10.1007/978-981-13-6295-8_5.
- V. Caselles, R. Kimmel, G. Sapiro, “Geodesic active contours”, International Journal on Computer Vision, July 1995, Volume 22, Issue 1, DOI: 10.1023/A: 1007979827043, pp. 61-79.
- Marie-Pierre Hellio Le Graverand, Steve Mazzuca, Jeff Duryea, Alan Brett, “Radiographic grading and measurement of joint space width in osteoarthritis”, Rheumatic diseases clinics of North America, 2009 August; 35(3):PP: 485-502. Doi: 10.1016/j.rdc.2009.08.005.
- Shivanand S. Gornale, Pooja U. Patravali, Ramesh R. Manza, “A Survey on Exploration and Classification of Osteoarthritis Using Image Processing Techniques”, International Journal of Scientific & Engineering Research, Volume 7, Issue 6, June-2016 ISSN 2229-5518 ,pp.334-355.
- Shivanand S. Gornale, Pooja U. Patravali, Ramesh R. Manza, “Detection of Osteoarthritis using Knee X-Ray Image Analyses: A Machine Vision Based Approach”, International Journal of Computer Applications (IJCA), ISSN-0975-8887, Volume 145, Number 1, July 2016,pp: 20-26.
- Shivanand S. Gornale, Pooja U. Patravali, Ramesh R. Manza, “Computer Assisted Analysis and Systemization of knee Osteoarthritis using Digital X-ray images”, Proceedings of 2nd International Conference on Cognitive Knowledge Engineering(ICKE), Chapter 42, pp:207-212, ISBN 978-93-86751-04-1, Excel Academy Publishers, Aurangabad, Maharashtra, December 2016.
- Shivanand S. Gornale, Pooja U. Patravali, Kiran S. Marathe, Prakash S. Hiremath," Determination of Osteoarthritis Using Histogram of Oriented Gradients and Multiclass SVM", International Journal of Image, Graphics and Signal Processing (IJIGSP), Vol.9, No.12, pp. 41-49, 2017.DOI: 10.5815/ijigsp.2017.12.05.
- Shivanand S. Gornale, Pooja U. Patravali, Archana M. Uppin, Prakash S. Hiremath, "Study of Segmentation Techniques for Assessment of Osteoarthritis in Knee X-ray Images", International Journal of Image, Graphics and Signal Processing(IJIGSP), Vol.11, No.2, pp. 48-57, 2019.DOI: 10.5815/ijigsp.2019.02.06.
- Shivanand S. Gornale, Pooja U. Patravali, Prakash S. Hiremath “Identification of Region of Interest for Assessment of Knee Osteoarthritis in Radiographic Images”, International Journal of Medical Engineering and Informatics”, INDERSCIENCE. (Accepted).
- Kruti R, Abhijit Patil, Shivanand Gornale, "Fusion of Features and Synthesis Classifiers for Gender Classification using Fingerprints", International Journal of Computer Science and engineering, Vol.-7, Issue-5, May 2019 E-ISSN: 2347-2693.
- Mitisha Narottambhai Patel, Purvi Tandel, “A Survey on Feature Extraction Techniques for Shape based Object Recognition”, International Journal of Computer Applications (0975 – 8887) Volume 137 – No.6, March 2016.
- I. Frosio, N. A. Borghese, "Statistical Based Impulsive Noise Removal in Digital Radiography", IEEE Transactions on Medical Imaging, vol. 28, Issue 1, pp. 3-16, 2009, DOI: 10.1109/TMI.2008.922698.
- Nithya R and Santhi B, “Computer Aided Diagnostic System for Mammogram Density Measure and Classification”, Biomedical Research (0970-938X), Volume 28, Issue 6, 2017, pp.2427-2431.
- Kayvan Najarian, Robert Splinter, “Biomedical Signal and Image Processing”, Second Edition ISBN 9781439870334 May 4, 2012 by CRC Press.
- www.cs.uu.nl.
- Proceedings of the International Conference on ISMAC in Computational Vision and Bio-Engineering 2018 (ISMAC-CVB)", Springer Science and Business Media LLC, 2019.
- Abhijit Patil, Kruthi R and Shivanand Gornale, " Analysis of Multi-modal Biometrics System for Gender Classification Using Face, Iris and Fingerprint Images", International Journal of Image, Graphics and Signal Processing (IJIGSP), Vol.11, No.5, pp. 34-43, 2019.DOI: 10.5815/ijigsp.2019.
- Shivanand S Gornale, Ashvini K Babaleshwar, Pravin L Yannawar," Detection and Classification of Signage’s from Random Mobile Videos Using Local Binary Patterns", International Journal of Image, Graphics and Signal Processing(IJIGSP), Vol.10, No.2, pp. 52-59, 2018.DOI: 10.5815/ijigsp.2018.02.06.
- Shivanand S.Gornale, Pooja U. Patravali (2017), “Medical Imaging in Clinical Applications: Algorithmic and Computer based approaches”, Basic Chapter, “Engineering and Technology: Latest Progress”, pp: 65-104, ISBN 978-81- 932850-2-2, Meta Research Press.
- Shivanand S. Gornale, Pooja U. Patravali, Prakash S. Hiremath, “Assessment of Osteoarthritis in Radiographic Images: A Machine Learning Approach”, Cognitive Informatics, Computer Modeling and Cognitive Science, Book Chapter, Elsevier (Accepted).
