Economic and statistical analysis of employment and unemployment and evaluation of their impact on the premeditated bankruptcy of enterprises in the regions of Russia through balanced scorecard

Author: Utkin A.I.
Journal: Экономика и бизнес: теория и практика @economyandbusiness
Article in issue: 4-2 (74), 2021.
Free access
The article examines an economic and statistical analysis of employment and unemployment in the regions of Russia and identifies risk-forming factors that determine the occurrence of bankruptcy of enterprises with a damage in the labor potential of the population. An assessment of the impact of employment and unemployment factors on the premeditation of bankruptcy of commercial organizations at the regional level is carried out within the framework of the balanced scorecard concept. As a result of identification of regional trends of premeditated bankruptcy, the strategic prospects for maintaining the continuity of the enterprise’s activities are determined based on the analysis of bankruptcy according to the model of R.S. Saifullin and G.G. Kadykov.
Employment, unemployment, risk-forming factors of bankruptcy, premeditation of bankruptcy, balanced scorecard, the model of r.s. saifullin and g.g. kadykov
Short address: https://sciup.org/170183413
IDR: 170183413 | DOI: 10.24412/2411-0450-2021-4-2-212-219
Экономико-статистический анализ занятости и безработицы и оценка их влияния на преднамеренное банкротство предприятий в регионах России с использованием сбалансированной системы показателей
В статье проведен экономико-статистический анализ занятости и безработицы в регионах России и выявлены рискообразующие факторы, определяющие возникновение банкротства предприятий при ухудшении трудового потенциала населения. Проведена оценка влияния факторов занятости и безработицы на преднамеренность банкротства коммерческих организаций на региональном уровне в рамках концепции сбалансированной системы показателей. В результате идентификации региональных тенденций преднамеренности банкротства определены стратегические перспективы сохранения непрерывности деятельности предприятия на основе анализа банкротства по модели Р.С. Сайфуллина и Г.Г. Кадыкова.
Text of the scientific article Economic and statistical analysis of employment and unemployment and evaluation of their impact on the premeditated bankruptcy of enterprises in the regions of Russia through balanced scorecard
The emergence of structural shifts in employment and unemployment due to the accumulation of bad payables leads to the bankruptcy of a commercial organization and is often the result of premeditated actions of the head or founder of the enterprise in the abuse of official powers [1]. At the same time, premeditated bankruptcy provides taxing operations for the sale of the liquidation mass and the liquidation of the organization’s property [1; 2]. Managers who intend to lead an enterprise to a state of bankruptcy and worsen the situation of employees of the organization proceed from the fact that operations of the sale of liquidated objects are subject to value added tax on a general basis and thereby cause huge financial damage to the property of the organization. Unambiguous identification and forecasting of risk-forming factors of deliberate bankruptcy of a commercial organization which arise when the labor potential deteriorates and the share of unemployment increases can be carried out by developing a process model within the balanced scorecard concept [2].
To find ways to identify the factors of unemployment, regional trends of premeditated bankruptcy and ways to comprehensively manage the financial well-being and overall
financial performance of the enterprise, it is necessary to improve the integrated methodology of economic and statistical analysis. The modification of this tools consists in the development of a unified list of criteria for selecting the key factors of premeditated bankruptcy, which comprehensively characterize the situation of the unemployed and the damage to the financial condition of a commercial organization, correlated with all the parameters of financial activity and forming projections of the balanced scorecard [3]. The economic and statistical analysis proposed for application in the framework of the criteria approach will allow to select risk-forming factors based on the determination of the compliance of the regional trends generated by them with the premeditation of bankruptcy and the economic meaning of the criteria. In this regard, based on the modified methodology, it will be possible to reduce the entire multi-faceted assessment of bankruptcy to the analysis of the key factors selected on the basis of criteria and using the analytical model of R.S. Saifullin and G.G. Kadykov to form strategic projections of the organization’s activities within the framework of the balanced scorecard, comprehensively covering the damage from unemployment and the direc-
tions (prospects) of improving the financial and economic potential.
According to the conducted research, the economic activity of the population working
at enterprises aged 15-72 years in the federal districts and regions for the IV quarter of 2015 was heterogeneous (table 1).
Table 1. Economic activity of the population aged 15-72 years by federal districts and regions for the IV quarter of 2015 [4]
|
Subject of the Russian Federation |
Economically active population, thousand people |
Including |
The level of economic activity of the population, % |
Employme nt level, % |
Unemploym ent level, % |
|
|
employ ment |
unemploy ment |
|||||
|
1 |
2 |
3 |
4 |
5 |
6 |
7 |
|
Russian Federation |
76701.5 |
72329.6 |
4371.9 |
69.2 |
65.3 |
5.7 |
|
Central Federal District |
21182.1 |
20431.7 |
750.4 |
71.0 |
68.4 |
3.5 |
|
Belgorod region |
815.5 |
783.4 |
32.0 |
69.3 |
66.5 |
3.9 |
|
Bryansk region |
627.9 |
602.5 |
25.3 |
66.9 |
64.2 |
4.0 |
|
Vladimir region |
766.6 |
714.2 |
52.4 |
71.4 |
66.6 |
6.8 |
|
Voronezh region |
1160.0 |
1107.1 |
52.9 |
65.3 |
62.3 |
4.6 |
|
Ivanovo region |
546.9 |
517.5 |
29.5 |
69.1 |
65.4 |
5.4 |
|
Kaluga region |
544.2 |
521.0 |
23.2 |
70.9 |
67.9 |
4.3 |
|
Kostroma region |
323.0 |
305.5 |
17.5 |
65.7 |
62.1 |
5.4 |
|
Kursk region |
571.6 |
547.6 |
24.0 |
67.6 |
64.8 |
4.2 |
|
Lipetsk region |
586.9 |
564.3 |
22.6 |
66.8 |
64.2 |
3.9 |
|
Moscow region |
3911.0 |
3779.6 |
131.5 |
71.0 |
68.6 |
3.4 |
|
Oryol region |
393.8 |
368.2 |
25.6 |
67.4 |
63.0 |
6.5 |
|
Ryazan region |
528.8 |
502.8 |
26.0 |
61.0 |
58.0 |
4.9 |
|
Smolensk region |
526.5 |
496.7 |
29.8 |
70.3 |
66.3 |
5.7 |
|
Tambov region |
526.6 |
502.5 |
24.1 |
64.5 |
61.6 |
4.6 |
|
Tver region |
705.8 |
665.0 |
40.8 |
70.6 |
66.5 |
5.8 |
|
Tula region |
807.1 |
777.3 |
29.8 |
69.3 |
66.7 |
3.7 |
|
Yaroslavl region |
699.8 |
660.9 |
38.9 |
72.8 |
68.7 |
5.6 |
|
Moscow |
7140.2 |
7015.8 |
124.4 |
75.5 |
74.1 |
1.7 |
|
North-Western Federal District |
7596.7 |
7230.4 |
366.4 |
71.2 |
67.8 |
4.8 |
|
Karelia Republic |
327.2 |
299.1 |
28.1 |
67.8 |
62.0 |
8.6 |
|
Komi Republic |
480.4 |
441.1 |
39.3 |
71.8 |
65.9 |
8.2 |
|
Arkhangelsk region |
608.2 |
562.2 |
46.0 |
67.3 |
62.2 |
7.6 |
|
Vologda region |
609.7 |
560.6 |
49.1 |
68.0 |
62.5 |
8.0 |
|
Kaliningrad region |
533.0 |
504.5 |
28.6 |
71.7 |
67.9 |
5.4 |
|
Leningrad region |
959.1 |
912.0 |
47.1 |
69.7 |
66.3 |
4.9 |
|
Murmansk region |
457.2 |
420.8 |
36.4 |
75.5 |
69.5 |
8.0 |
|
Novgorod region |
321.7 |
305.8 |
15.9 |
68.8 |
65.4 |
5.0 |
|
Pskov region |
332.0 |
311.5 |
20.5 |
66.7 |
62.6 |
6.2 |
|
Saint-Petersburg |
2968.2 |
2912.8 |
55.4 |
73.8 |
72.4 |
1.9 |
|
Southern Federal District |
7111.5 |
6646.3 |
465.2 |
67.5 |
63.1 |
6.5 |
|
Adygea Republic |
202.7 |
185.1 |
17.6 |
61.3 |
56.0 |
8.7 |
|
Kalmykia Republic |
146.9 |
133.0 |
13.8 |
70.2 |
63.6 |
9.4 |
|
Krasnodar Krai |
2735.1 |
2574.0 |
161.1 |
67.4 |
63.4 |
5.9 |
|
Astrakhan region. |
526.9 |
486.2 |
40.7 |
69.4 |
64.0 |
7.7 |
|
Volgograd region |
1330.7 |
1232.5 |
98.2 |
68.5 |
63.5 |
7.4 |
|
Rostov region |
2169.2 |
2035.4 |
133.8 |
67.1 |
63.0 |
6.2 |
|
North Caucasus Federal District |
4509.4 |
3989.1 |
520.4 |
65.5 |
58.0 |
11.5 |
|
Dagestan Republic |
1310.5 |
1158.4 |
152.1 |
62.1 |
54.9 |
11.6 |
|
Subject of the Russian Federation |
Economically active population, thousand people |
Including |
The level of economic activity of the population, % |
Employme nt level, % |
Unemploym ent level, % |
|
|
employ ment |
unemploy ment |
|||||
|
1 |
2 |
3 |
4 |
5 |
6 |
7 |
|
Ingushetia Republic |
223.4 |
154.6 |
68.7 |
72.4 |
50.1 |
30.8 |
|
Kabardino-Balkar Republic |
434.7 |
390.7 |
44.0 |
68.5 |
61.5 |
10.1 |
|
Karachay- Cherkess Republic |
223.1 |
184.8 |
38.3 |
64.7 |
53.6 |
17.2 |
|
North Ossetia – Alania Republic |
325.9 |
289.9 |
36.0 |
63.8 |
56.7 |
11.0 |
|
Chechen Republic |
621.0 |
517.5 |
103.5 |
71.3 |
59.4 |
16.7 |
|
Stavropol Krai |
1370.9 |
1293.1 |
77.8 |
65.3 |
61.6 |
5.7 |
|
Volga Federal District |
15463.5 |
14735.8 |
727.7 |
68.7 |
65.5 |
4.7 |
|
Bashkortostan Republic |
2020.5 |
1896.7 |
123.8 |
66.8 |
62.7 |
6.1 |
|
Mari El Republic |
358.0 |
339.3 |
18.7 |
68.6 |
65.0 |
5.2 |
|
Mordovia Republic |
446.1 |
426.5 |
19.6 |
70.9 |
67.8 |
4.4 |
|
Tatarstan Republic |
2073.3 |
2002.1 |
71.2 |
71.7 |
69.2 |
3.4 |
|
Udmurt Republic |
808.4 |
760.5 |
47.8 |
71.1 |
66.9 |
5.9 |
|
Chuvash Republic |
660.8 |
626.6 |
34.2 |
70.7 |
67.1 |
5.2 |
|
Perm Krai |
1300.5 |
1224.0 |
76.5 |
65.8 |
61.9 |
5.9 |
|
Kirov region |
677.9 |
641.0 |
36.9 |
68.5 |
64.8 |
5.4 |
|
Nizhny Novgorod region |
1759.2 |
1685.2 |
74.0 |
70.3 |
67.4 |
4.2 |
|
Orenburg region |
1009.2 |
960.9 |
48.3 |
67.4 |
64.2 |
4.8 |
|
Penza region |
691.0 |
659.0 |
32.0 |
66.3 |
63.2 |
4.6 |
|
Samara region |
1754.3 |
1695.8 |
58.5 |
70.9 |
68.5 |
3.3 |
|
Saratov region |
1248.3 |
1190.5 |
57.8 |
65.5 |
62.5 |
4.6 |
|
Ulyanovsk region |
656.1 |
627.7 |
28.3 |
67.1 |
64.2 |
4.3 |
|
Ural Federal District |
6478.6 |
6065.5 |
413.1 |
70.1 |
65.6 |
6.4 |
|
Kurgan region |
424.9 |
390.0 |
34.9 |
65.7 |
60.3 |
8.2 |
|
Sverdlovsk region |
2256.6 |
2104.1 |
152.5 |
69.2 |
64.5 |
6.8 |
|
Tyumen region |
1935.7 |
1841.6 |
94.1 |
71.4 |
67.9 |
4.9 |
|
Yamalo-Nenets Aut.Okr. |
322.6 |
312.8 |
9.8 |
77.0 |
74.6 |
3.0 |
|
Chelyabinsk region |
1861.4 |
1729.9 |
131.5 |
70.9 |
65.9 |
7.1 |
|
Siberian Federal District |
9840.5 |
9001.9 |
838.6 |
67.9 |
62.1 |
8.5 |
|
Altai Republic |
100.3 |
88.9 |
11.4 |
68.1 |
60.4 |
11.4 |
|
Buryatia Republic |
452.5 |
405.3 |
47.2 |
63.7 |
57.1 |
10.4 |
|
Tyva Republic |
134.3 |
106.4 |
27.9 |
64.8 |
51.3 |
20.8 |
|
Khakassia Republic |
257.7 |
239.5 |
18.2 |
64.8 |
60.2 |
7.1 |
|
Altai Krai |
1178.8 |
1057.0 |
121.8 |
65.7 |
58.9 |
10.3 |
|
Trans-Baikal Krai |
535.9 |
480.2 |
55.7 |
66.3 |
59.5 |
10.4 |
|
Krasnoyarsk Krai |
1507.7 |
1407.2 |
100.5 |
69.2 |
64.6 |
6.7 |
|
Irkutsk region |
1268.1 |
1150.5 |
117.6 |
70.4 |
63.9 |
9.3 |
|
Kemerovo region |
1370.0 |
1264.7 |
105.3 |
66.7 |
61.6 |
7.7 |
|
Novosibirsk region |
1466.9 |
1350.8 |
116.2 |
70.3 |
64.8 |
7.9 |
|
Omsk region |
1036.5 |
962.0 |
74.5 |
69.3 |
64.3 |
7.2 |
|
Tomsk region |
531.8 |
489.4 |
42.4 |
64.6 |
59.5 |
8.0 |
|
Far Eastern Federal District |
3358.2 |
3143.6 |
214.6 |
69.8 |
65.3 |
6.4 |
|
Sakha (Yakutia) Rep. |
494.3 |
458.3 |
36.1 |
69.9 |
64.8 |
7.3 |
|
Kamchatka Krai |
187.7 |
178.8 |
8.8 |
73.8 |
70.4 |
4.7 |
|
Primorsky Krai |
1046.3 |
972.6 |
73.7 |
69.1 |
64.2 |
7.0 |
|
Khabarovsk Krai |
723.4 |
679.1 |
44.3 |
69.2 |
65.0 |
6.1 |
|
Amur region |
415.0 |
392.7 |
22.3 |
67.3 |
63.7 |
5.4 |
|
Magadan region |
94.5 |
90.7 |
3.8 |
78.7 |
75.5 |
4.0 |
|
Sakhalin region |
277.9 |
260.7 |
17.2 |
72.2 |
67.7 |
6.2 |
|
Subject of the Russian Federation |
Economically active population, thousand people |
Including |
The level of economic activity of the population, % |
Employme nt level, % |
Unemploym ent level, % |
|
|
employ ment |
unemploy ment |
|||||
|
1 |
2 |
3 |
4 |
5 |
6 |
7 |
|
Jewish auth. region |
86.2 |
79.1 |
7.1 |
66.8 |
61.3 |
8.3 |
|
Chukotka auth. distr.. |
32.8 |
31.5 |
1.3 |
83.3 |
80.0 |
3.9 |
|
Crimean Federal District |
1160.8 |
1085.2 |
75.6 |
65.2 |
60.9 |
6.5 |
|
Crimea Republic |
956.1 |
892.0 |
64.1 |
64.2 |
59.9 |
6.7 |
|
Sevastopol |
204.7 |
193.2 |
11.5 |
69.8 |
65.9 |
5.6 |
As it can be seen from the table, in 2015, the lowest level of unemployment that meets the criteria (lack of work or incomegenerating occupation, job search and readiness to start it in the surveyed week), and the highest level of employment of the population were recorded in the Central Federal District, the highest level of unemployment and the lowest level of employment-in the North Caucasus Federal District. Moscow and St. Petersburg look the most advantageous. It has the highest employment rate and the lowest unemployment rate. The economically active population in these cities also has the largest share.
The most tense situation in terms of unemployment is in Ingushetia, where the unemployment rate is the highest among all regions – 30.8%. There is also the lowest level of employment in the country – 50.1%, despite the fact that the level of the economically active population is quite high – 72.4%. In other North Caucasian republics, especially in the Chechen Republic and Karachay-Cherkessia, the situation is also quite serious, but not as acute as in Ingushetia.
The second most disadvantaged region in terms of unemployment is the Republic of Tyva. The unemployment rate there is 20.8%, with a very low level of employment – 51.3% and a fairly low proportion of the economically active population.
The Chukotka Autonomous District and the Magadan region hold the palm in terms of the economically active population and employment. The level of the economically active population in Chukotka is 83.3%, the employment rate is 80%, and unemployment is one of the lowest in the country – 3.9%. Slightly worse indicators for the Magadan region. The level of the economically active population there is 78.7%, the employment rate is 75.5%, and the unemployment rate is only 4%. The Yamalo-Nenets Autonomous District is very close to Chukotka and Magadan in terms of employment and unemployment. There is a high percentage of the economically active population of 77%, a solid level of employment – 74.6%, and unemployment is one of the lowest in the country, second only to Moscow and St. Petersburg.
It should be noted that in the Crimean Federal District and in the Republic of Crimea, a fairly low level of employment is recorded – 60.9% and 59.9%, respectively, which is only slightly higher than in the North Caucasus Federal District. However, the unemployment rate here is average – 6.5-6.7 %, and in Sevastopol it is almost the same and even slightly lower than the national average – 5.6%.
We investigated the correlation relationships between employment and unemployment indicators in the regions of the Russian Federation and assessed the impact of riskforming factors on the premeditation of bankruptcy by calculating the Pearson linear correlation coefficient using the STATISTICA 8.0 program (table 2).
Table 2. Correlation relationships between employment and unemployment indicators in the regions of the Russian Federation
Correlations (Spreadsheetl)
Marked correlations are significant at p < .05000 N=87 (Casewise deletion of missing data)
|
Variable |
Эк активн насе пение |
Занятые |
Безработные |
Уровень эк.активности |
Уровень занятости |
Уровень безработицы |
|
Эк.активн.население |
1.00 |
1,00 |
0,70 |
0 141 |
0,27 |
-0,29 |
|
Занятые |
1,00 |
1.00 |
0,68 |
0.15 |
0,28 |
-0,30 |
|
Безработные |
0,70 |
0.68 |
1.00 |
-0.10 |
-0.13 |
0.10 |
|
Уровень эк активности |
0.14 |
0.15 |
-0.10 |
1.00 |
0,82 |
-0.20 |
|
Уровень занятости |
0,27 |
0,28 |
-0.13 |
0,82 |
1.00 |
4.72 |
|
Уровень безработицы |
-0,29 |
-0,30 |
0.10 |
-0.20 |
-0,72 |
1.00 |
Note: statistically significant linear correlation coefficients are identified at p<0.05
The closest correlations were found between the number of economically active population, the number of employed (r =1.0, at p<0.05) and the unemployed (r = 0.7, at p<0.05). The average correlation between the number of employed and unemployed was traced (r = 0.68, at p<0.05). The level of economic activity was closely correlated with the level of employment (r = 0.82, at p<0.05).And a negative correlation was established between the levels of employment and unemployment (r = -0.72, at p<0.05). A weak but statistically significant correlation was found between the number of economically active population and the level of employment (r = 0.27 at p<0.05). A similar relationship was recorded between the number of employed and the level of employment (r = 0.28 at p<0.05). However, a weak negative but significant relationship was found between the number of economically active population in Russian regions and the level of unemployment (r = -0.29 at p<0.05). A similar relationship was established between the number of employed and the level of unemployment (r = -0.30 at p<0.05).
The conducted correlation analysis showed that the majority of indicators of economic activity of the population, employment and unemployment are statistically significantly interrelated. In this regard, in Russia, among the 85 subjects of the Federation, a rather motley picture is obtained in terms of wellbeing or disadvantage in terms of the levels of the economically active population, employment and unemployment. Currently, the most prosperous cities are Moscow, St. Petersburg, the Chukotka Autonomous District, the Magadan region and the Yamalo-Nenets Au- tonomous District. The Republic of Ingushetia and other North Caucasian republics, as well as the Republic of Tyva, should be considered the least prosperous. These subjects of the Russian Federation should be given the closest attention to organize work to combat unemployment and overcome the deterioration of the labor potential of enterprises, to create jobs and improve the economy. In this regard, the impact of employment and unemployment factors on the premeditation of bankruptcy should be assessed as harmful and fundamental.
As a result of the economic and statistical analysis, it is established that the typical riskforming factors of employment and unemployment at the regional level, which in the long term are essential for the occurrence of deliberate bankruptcy, are:
-
- the desire to appropriate for further third-party use a part of the property or the undisclosed surplus of a particular product (material), not taken into account by the page and general results, concerning a significant part of the values and decisive positions (influence on the change in the coefficient of security of own funds);
-
- the desire to hide illegal discrepancies or corrections that have arisen as a result of the abuse of the company’s management of its property, and to eliminate the circle of persons interested in disclosing illegal actions (influence on the change in the current liquidity ratio);
-
- the desire to hide the invalidity of the signatures of the materially responsible persons on the financial and economic documents (if it is established on the basis of documentary data that the materially responsible
person refused to sign the documents on the grounds of incorrect and incomplete verification of values and required rechecking them, and the administration did not take appropriate measures) (influence on the change in the turnover ratio of current assets);
-
- the desire to expand the scope of business and optimize the staff when implementing a merger of several companies (a bankrupt enterprise is included in an organization with a high level of financial efficiency) (impact on changes in the return on sales and return on equity).
These factors of employment and unemployment generate regional trends of intentional bankruptcy [5]. On the example of JSC “Polyot” Ivanovo Parachute Plant, the strategic prospects for maintaining the continuity of the company’s activities and its exposure to deliberate bankruptcy for 2018-2019 were determined using the model of R. S. Saifullin and G. G. Kadykov and the balanced scorecard concept, taking into account the impact of risk-forming factors of employment and unemployment on the financial performance of the organization (table 3).
Table 3. Comparative assessment of the continuity of the activities of JSC “Polyot” Ivanovo Parachute Plant in 2018-2019, taking into account the influence of risk-forming factors of employment and unemployment on the premeditation of bankruptcy within the framework of the balanced scorecard concept
|
N |
Coefficient |
2018 |
2019 |
Deviation |
|
1. |
Ratio of own and borrowed funds |
2.56 |
2.40 |
-0.16 |
|
2. |
The probability of bankruptcy according to the model of R. S. Saifullin and G. G. Kadvkov |
53.70 |
33.27 |
-20.43 |
|
3. |
Coefficient of balance coverage (liquidity) |
3.71 |
3.41 |
-0.30 |
Projection 1 “Finance
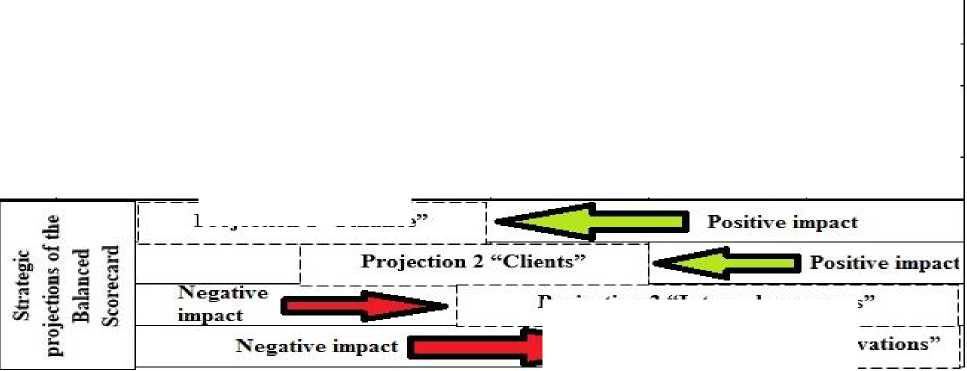
Projection 3 " Internal processes
I Projection 4
When assessing the continuity of the activities of JSC “Polyot” Ivanovo Parachute Plant, the analysis of the premeditation of bankruptcy for 2018-2019 according to the model of R.S. Saifullin and G.G. Kadykov revealed a low probability of intentional bankruptcy of the organization (the probability of bankruptcy R significantly exceeds 1). The company is characterized by significant financial stability and a high level of financial stability and solvency and is not affected by the zone of risk-forming factors of employment and unemployment, which is directly related to the balance of organizational and managerial, accounting, financial and strategic processes of the enterprise. The reliability of the financial and economic potential of JSC “Polyot” is confirmed by the significant indicators of the turnover ratio of current as- sets, return on sales and return on equity, as well as the values of the availability of own working capital and the current liquidity ratio, which fully meet the established standards. However, the negative dynamics of the financing ratio (the ratio of own and borrowed funds) (a decrease of 0.16), the probability of bankruptcy (a decrease of 20.43) and the current liquidity ratio (a decrease of 0.3) in 20182019 demonstrates a decrease in the efficiency of financial activities and a deterioration in financial well-being by the end of the reporting year, caused by the crisis manifestations of economic motives for bankruptcy. The observed negative trends associated with the instability of the financial condition are the only problem (risk) area of the organization’s activity, and in all other aspects the company is not affected by the factors of employment, unemployment and premeditated bankruptcy.
In this regard, the main direction of ensuring the protection of the financial activities of JSC “Polyot” from premeditated bankruptcy should be the constant regulation of the ratio of own and borrowed funds while stimulating the growth of equity capital (ensuring financial potential and independence) and preventing the accumulation of the most urgent obligations (accounts payable).
Thus, the identification of typical riskforming factors of employment and unemployment, which determined the high fre- quency of risks of a crisis financial condition, premeditated bankruptcy and the resulting increase in the share of damage to the labor potential of the population, made it possible to assess the continuity of financial activity and the susceptibility to premeditate bankruptcy of a particular enterprise of JSC “Polyot” Ivanovo Parachute Plant. The company has a reliable potential and is not significantly affected by negative factors, but it is necessary to stabilize the sources of financing in the transition to a multidisciplinary economic system based on the balanced scorecard model.
References Economic and statistical analysis of employment and unemployment and evaluation of their impact on the premeditated bankruptcy of enterprises in the regions of Russia through balanced scorecard
- Krutova Ya.A., Ochakovsky V.A., Samsonenko Yu.A. To the Issue of Correlation of Civil and Tax Law Institutions // Society and Law. - 2018. - №3 (65). - P. 151-155.
- Utkin A.I. Forecasting the Effectiveness of Methods for Managing the Income Potential of Regional Budgets // Economy and Business: Theory and Practice. - 2020. - №1-2 (59). - P. 147-151.
- Balabanov V.S. Diagnostics of Financial Capacity of Corporation // Entrepreneur's Guide. - 2012. - №15. - P. 38-43.
- Federal State Statistics Service. Regions of Russia. Socio-economic indicators / official website. - [Electronic resource] - Mode of access: http://www.gks.ru/ (accessed 11.04.2021).
- The Resolution of the Government of the Russian Federation 29.05.2004 № 257 "On Securing Interests of Russia as a Creditor in Bankruptcy Cases and Bankruptcy Procedures" (ed. 21.07.2017). - [Electronic resource]. - Mode of access: http://base.consultant.ru/ (accessed 11.04.2021).
