Economic behavior of the region’s population: The role of socio-cultural factors in the conditions of the Arctic

Author: Chizhova L.A., Tutygin A.G., Maksimov A.M., Koshunyaeva N.V.
Journal: Economic and Social Changes: Facts, Trends, Forecast @volnc-esc-en
Section: Social and economic development
Article in issue: 4 т.18, 2025.
Free access
The transformations taking place in the socio-cultural space of Russia in the last three decades determine various aspects of human behavior, including economic behavior. The aim of the study is to assess the influence of the basic components of the socio-cultural space of the Arctic region on how the population develops economic behavior strategies, among which are values, norms, attitudes, social well-being, social capital, human capital, identity, and cultural consumption. The article provides a brief description of modern approaches to the study of economic behavior based on interdisciplinary links between economics, sociology and other sciences. Further, with the help of sociological research, we identify and describe trends in the economic behavior of the population of an Arctic region – the Arkhangelsk Region. With the help of G.S. Pospelov’s decision matrices we assess the influence of the components of the socio-cultural space on the choice of an economic behavior strategy and determine the structural hierarchy of the components according to the degree of this influence. In particular, we show that the impact of the basic components on economic behavior demonstrates high stability, while the most significant structural contribution is made by social well-being and the values of “materialism” / “post-materialism”. Scientific novelty of the research lies both in the application of an interdisciplinary approach to the study of the economic behavior of the population of the Arctic region, and in assessing the impact of various structural elements of the socio-cultural space on the manifestation of a particular type of economic behavior of individuals and households (consumer, savings, and investment). Practical significance of the approach we propose is related to the possibility of its further use in order to design models and development programs for various Arctic territories and regions that differ in socio-economic, ethno-cultural and value characteristics and strategies of economic behavior of the population.
Socio-economic development of the territory, socio-cultural space, transformation, economic behavior, method of decision matrices, regions of the Russian Arctic
Short address: https://sciup.org/147251835
IDR: 147251835 | UDC: 332.1, 303.09 | DOI: 10.15838/esc.2025.4.100.9
Text of the scientific article Economic behavior of the region’s population: The role of socio-cultural factors in the conditions of the Arctic
The economic behavior of the population is the subject of research by many Russian and foreign scientists who approach this phenomenon from different perspectives, using extensive tools from different disciplines. Without dwelling on this in detail, we will only refer to such works as (Kremlev, 2024; Orlov, Lugovoi, 2024; Kahneman, Tversky, 1979; Thaler, 2016). At the same time, the study of economic behavior can be carried out at various levels of aggregation, ranging from individual agents and households to entire social communities of various scales.
In this paper, we consider the behavioral processes of aggregates of individual agents and households located on the territory of a single Arctic region of Russia (Arkhangelsk Region), which has a number of pronounced features described in detail in studies (Podoplekin, 2016; Lukin, 2022; Lazhentsev, 2025), as well as in our monographs (Chizhova et al., 2022; Chizhova L.A. et al., 2023), namely: the peripheral location, the dispersion of the population, its low density and concentration in the agglomeration around the regional center; comparatively low (for the region of the European part of the RF) transport accessibility, unfavorable climate and associated costs (in the field of energy, agriculture, etc.); a combination of the old-age population with a large share of newcomers from other regions against the background of monoethnicity; a combination of rental and service type features in the economy of the region; the status of the regional capital as scientific, educational and cultural Center of the European North of Russia and the European sector of the Arctic zone of the RF. These features, some of which are typical of the Arctic regions and some of which are unique, act not only as economic behavior factors, but also set the parameters of the socio-cultural space of the Arkhangelsk Region: a pronounced regional identity, the “fit” of the region in the public consciousness in the historical and geographical context of the Russian North, a high level of cultural and consumer demands, relatively high quality human capital, pragmatic value orientation and low level of social trust.
We should note that the population of the region involved in transformational changes is undergoing a process of sociocultural division into groups with different behavioral characteristics (Lastochkina, 2012). Currently, due to the digitalization of the economy and society, technologies (technological structures) are changing, new business lines and professions are emerging, labor productivity indicators are changing, people’s lifestyles are changing, new forms of connection and communication are emerging, modern methods of collecting and processing information are being used, which together leads to natural and inevitable changes of economic behavior of the population (Tutygin, Chizhova, 2020).
For example, we consider the economic behavior of the population as a set of complex dynamic processes taking place within a certain framework of the socio-cultural space of the region (Chizhova et al., 2023) based on the systemic concept of the space-time approach proposed in the work (Kleiner,
Rybachuk, 2017). This view of the phenomenon of economic behavior in no way contradicts the other interpretations given below, but only complements its dynamic component.
The aim of the study is to assess the influence of the basic components of the socio-cultural space of the Arctic region on the formation of strategies for economic behavior by the population, while we distinguish two concepts related to economic behavior – “type” and “strategy”. The former is rather static in nature, while the latter characterizes the process associated with the choice. The choice of a behavior strategy, as a rule, depends on a large number of factors that are not always clearly expressed and fully understood by the person making this choice, and the type of economic behavior characterized by a set of relevant indicators is precisely correlated with the statement of observed practices.
The difficulty in achieving this goal lies in the fact that a direct assessment of such an impact is extremely difficult for a number of reasons and therefore practically impossible. First, this is caused by a large number of influencing factors that are not amenable to any orderly selection procedure, as well as acceptable quantitative assessment, which, in turn, calls into question the correctness of the application of generally accepted mathematical and statistical methods of analysis. Second, there is a high degree of uncertainty in the sociocultural content, which is inextricably linked to the dynamically changing socio-economic situation in the territory of residence. Third, the first two difficulties are a serious obstacle in any attempt to directly formalize cause-and-effect relationships, and hence to build an appropriate conceptual model of behavior. Thus, the decision to follow a particular strategy of economic behavior by an agent (group of agents, household, etc.) is not accompanied by either an explicit hierarchy of formal choice of alternatives or effective tools for evaluating their usefulness (Tutygin et al., 2024).
In this regard, the research problem, in our opinion, is to overcome contradictions between such socio-cultural entities as values, social wellbeing, human and social capital, identity, cultural consumption, in terms of choosing a behavioral strategy. The authors propose to solve the problem by analyzing the manifestation of these entities through the prism of socio-cultural space (relational manifestations of entities). It is worth noting that it is an integral part of a more general scientific problem, which, in our opinion, consists in a critical mismatch of retrospective characteristics and the current cross-section of the situation in relation to the socio-cultural space of the Russian Arctic.
Based on the above, the research object should be considered the socio-cultural space of the region as a system construct consisting of basic components (entities), and the subject is the economic behavior of agents (population), formed under their direct and indirect influence. Thus, the hypothesis of the study is the assumption that economic behavior is a kind of integrity, the structure of which is largely determined by the basic components of the socio-cultural space (entities). We should say that according to the neoclassical concept, the economic behavior of the population is usually understood as “... a form of human activity, their conscious activity in the reproductive sphere, aimed at subjectively optimizing results (maximizing expected utility) due to the correlation of available preferences and limited resources with possible options for their use ...” (Belekhova, 2018), which fits perfectly into the logic of our research.
We will take the following as the main research tasks:
-
1) to gain a systematic understanding of modern scientific issues related to economic behavior;
-
2) by conducting a sociological study, to identify trends in the economic behavior of the population of a particular Arctic region (Arkhangelsk Region), taking into account its specifics;
-
3) to select and verify the appropriate tools for assessing the impact of the components of the sociocultural space on the economic behavior of the population in relation to the aim of the study.
Methods
Based on the problem statement described above and the set of research tasks, we conclude that it is necessary to choose an additional tool that allows building a formal hierarchy of cause and effect along with using generally accepted sociological analysis procedures. For the aim of studying the influence of the basic components of the socio-cultural space on the choice of strategies of economic behavior (eventually leading to the formation of a particular type of economic behavior), we propose to use the idea of G.S. Pospelov’s method of solving matrices (Pospelov et al., 1981). To implement it, a three-level hierarchy of “strategies – relational manifestations – entities” will be built below, with the help of which, based on the analysis of both quantitative and verbal data collected, estimates of the influence of the components of the sociocultural space on the choice of economic behavior strategy, as well as the share of the “presence” of the basic components in the structure of each of its types will be obtained.
Results
Approaches to the study of economic behavior problems
Modern approaches to the study of economic behavior are based on interdisciplinary links between economics, sociology, philosophy, cultural studies, and psychology.
Economic behavior, being a certain form of socio-cultural process, has a number of socio-philosophical (value) and cultural (mental) characteristics, which are considered in detail in the works (Zolotukhin, 2018; Zolotukhin et al., 2020). The analysis of changing practices of economic behavior in specific territories allows regional authorities to competently choose priorities for strategic management, in the future not only to clarify ideas about the causes of the current socio-economic state of regional communities, but also to predict ways of their further development (Yakovleva, 2019).
In modern research, it is customary to distinguish several types of economic behavior: consumer, credit, savings, and investment. We should note that economic behavior in all its manifestations is extremely important for the functioning of the Russian banking system. For example, the savings of the population are an important source of financial resources, and the pattern of economic behavior is well known: “the volume of deposits of the population increases in December, and in January the population almost always withdraws their funds from banks” (Gamukin, 2020).
Structural shifts in consumption and the transformation of economic behavior at the regional level cannot be explained solely by changes in household income, but require consideration of demographic, settlement and institutional factors (Zubarevich, Safronov, 2019). The population of “rich” regions prefers to spend money on recreation and entertainment, but these expenses are being squeezed in the face of a crisis decline in income. Savings behavior is most developed in the largest federal cities. Overdue loans are higher in the regions of the Russian Federation with low incomes and resource-producing regions, where the population strives to maintain the achieved level of consumption through loans.
The regional specifics of the economic behavior of the population, taking into account economic differentiation, consumer attitudes and behavioral characteristics during the current crisis, are reflected in the work of scientists from the EU countries. Using the example of the Polish voivodeships (regions), it is shown that at their level there is a significant differentiation in the socio-economic development of territories, including household incomes, and the current crisis caused by the consequences of military operations in Ukraine does not help to reduce differences. At the same time, the processes of forming pessimistic consumer attitudes are actively underway, including their economic behavior, leading to a drop in demand and a decrease in the level of satisfaction of needs (Murawska, 2024).
The adaptation of consumer behavior to crisis conditions usually occurs in the following directions: there is an increase in the share of food costs in the structure of consumer spending, there is a decrease in the quantity (volume) of consumption of goods and services, and the quality of purchased goods is noticeably decreasing. Such adaptation mechanisms of residents of Russian regions in the long term lead to a violation of the reproduction of human potential (Dement’eva, 2018).
From the point of view of psychology, economic behavior largely depends on the socially determined aspirations and social environment of an individual, which should be taken into account in the study of economic inequality, social conflict, decisionmaking about childbearing, risk-taking, and goal setting (Genicot, Ray, 2020). Research on gender differences in economic behavior is quite popular. The work of scientists from Ecuador, based on surveys of respondents from 16 Latin American countries, shows that women’s economic behavior is more related to innovation (men are more conservative), and economic realities are described by women most often through reflective assessment and emotional intelligence (Lascano Corrales, 2024).
The work of Chinese scientists analyzes how demographic shifts and state social security affect household investment strategies. The results of panel studies demonstrate a significant negative relationship between the burden of caring for the elderly and household investment behavior. The observed trend toward more conservative investment behavior among households with a higher burden of caring for the elderly is consistent with life cycle theories and prudent savings (Wang et al., 2025).
The results of numerous foreign studies devoted to various aspects of economic behavior in the context of the influence of socio-cultural factors are quite interesting.
For example, the joint work of scientists from the UK and France has shown that not only social, but also personal norms shape human economic behavior. The authors experimentally prove that personal norms, along with social norms and monetary rewards, highly predict the behavior of individuals, being one of the key factors concerning economic behavior (Basic, Venina, 2024).
The role of religion as components of the sociocultural space and its impact on the behavior of economic agents and the dynamics of economic systems in general are considered in the work (Al Fozaie, 2023), which proposes an approach that allows religion itself to be operationalized and analyzed, to check whether it embodies any principles that may hinder socio-economic development, facilitating the construction of a quantitative metric that seeks to distinguish between religion and the economic behavior of its representatives.
The study of the relationship between economic and religious behavior in the context of social changes in society is devoted to the collective work of Indonesian scientists (Syauta et al., 2022). The research shows values (honesty, kindness, sincerity, etc.) and attitudes (to work, to exchange, to organizing everyday life, etc.) that influence the economic behavior of a believer using the example of an analysis of the texts of the Bible and Christian teaching.
Features of the economic behavior of the population of the Arctic region (based on survey materials in the Arkhangelsk Region)
The Arctic regions of Russia are characterized by historical and cultural features and marginal economic and geographical location, which contributes to a more pronounced manifestation of the transformations of the socio-cultural sphere. Life in the Russian Arctic in modern conditions is caused by a whole range of economic, environmental and socio-cultural factors and conditions, which in turn lead to changes in the expectations of the population, social well-being and behavioral patterns. All this fully applies to the Arkhangelsk Region, the population of the Arctic municipalities of which accounts for almost a quarter of the total population of the Arctic zone of the Russian Federation (AZRF)1. The empirical basis of the study was the data from two mass sample surveys conducted by us in the Arkhangelsk Region in May 2023 (378 respondents) and in May 2024 (505 respondents). The type of sample is streaming, quota (by gender, age, and settlement type – city or rural area), its detailed description is contained in the database developed by the team of the Laboratory of Problems of Territorial Development of N. Laverov Federal Center for Integrated Arctic Research (FCIARctic)2.
Figure 1 shows the sample structure of both surveys by gender. In 2023, the gender ratio in the sample roughly corresponded to it in the general population; in 2024, there was a bias in favor of women in our sample. To eliminate this disparity between the genders, the data was reweighed to bring the share of men and women in the sample to the target values.
The diagram in Figure 2 shows the distribution of respondents by age cohort. For all cohorts of the working-age population, the share in the samples correspond to the share in the general population (deviations in one direction or another are within the limits of random error). A significant deviation is observed for older people (60+), which is due to the consistently low availability of respondents of this age when using the chosen method of data
Figure 1. Distribution of respondents by gender, %
2023 survey
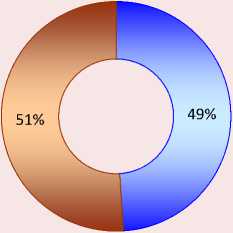
□ Male о Female
2024 survey
□ Male
□ Female
Source: own compilation.
Figure 2. Distribution of respondents by age, %
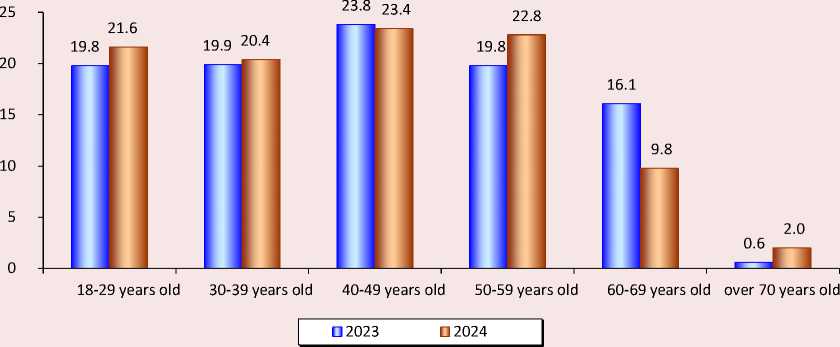
Source: own compilation.
collection (in our case, an online questionnaire). Overweighing of data for these groups was not carried out due to the risk of increasing the impact of statistical outliers on the final distribution of responses. At the same time, the authors consider it justified to focus on the working-age groups as the most economically active, characterized by more diverse economic behavior.
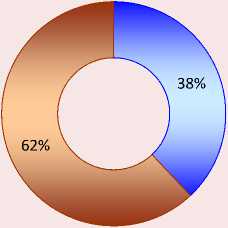
The distribution between rural and urban populations shown in Figure 3 is stable from year to year and reflects the actual settlement structure in the Arkhangelsk Region.
The diagram in Figure 4 shows the distribution of respondents by self-assessment of the purchasing power of their households. We can see that the sample structure for this indicator has changed insignificantly from year to year. At the same time, the polar groups (with the lowest and highest incomes) make up a smaller part of the samples, and the majority of respondents consider themselves to be those groups that cover their needs for everyday goods and have the opportunity to both accumulate savings and (hypothetically) make investments.
Figure 3. Distribution of respondents by settlement type, %
□ Urban locality □ Rural locality
Source: own compilation.
Figure 4. Respondents’ assessment of the purchasing power of their income, %
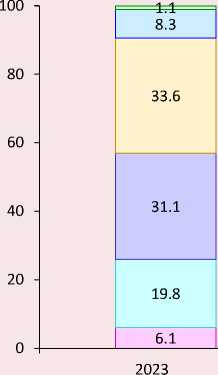
3.4
8.3
38.2
35.0
10.3
4.8
-
□ I don't even have enough money for food
-
□ There is enough money for food, but not enough to buy clothes and shoes
-
□ There is enough money to buy clothes and shoes, but not enough to buy large household appliances
п We have enough money to buy large household appliances, but we can't buy a new car
-
□ We can afford to buy everything except an apartment or a house
-
□ If it is necessary, we could purchase an apartment or a house without applying for a loan
Source: own compilation.
In the course of the analysis, we proceeded from the idea that three meaningfully different types of economic behavior can be distinguished – consumer, savings, and investment (Tutygin, Chizhova, 2020). To measure each type of behavior during operationalization, two main indicators and one additional indicator (risk tolerance) were constructed, which was designed for investment behavior. The indicators were obtained as a result of a logical analysis of concepts describing types of economic behavior: for each type of behavior, one indicator recorded the relative propensity to a particular behavior through the ratio of consumer spending, potential savings and potential investments, another indicator was the respondent’s availability of a tool for implementing a certain type of behavior (credit, deposit, securities).
Table 1. Indicators of economic behavior types
|
Type of economic behavior |
Operationalization (indicators) |
|
Consumer |
– share of monthly consumer spending in total income, %; – availability/absence of a mortgage or consumer loan* |
|
Saving |
– propensity to save**; – availability of a savings instrument (deposit, deposit, etc.)* |
|
Investment |
– investment propensity**; – tolerance to investment risk**; – availability of an investment instrument (stocks, bonds, shares in mutual funds, etc.)* |
|
* Assessment on a dichotomous scale. ** The rating is based on a five-point ordinal scale. Source: own compilation. |
|
Gender and age, settlement type (place of residence), number of minor children and household members, average per capita income, respondent’s assessment of household purchasing power, level of generalized trust, religiosity were considered as social and socio-cultural characteristics of respondents who were tested to determine whether they were any significant factors concerning various types of economic behavior, education and the index of post-materialistic values (Inglehart, 1997), the index of social well-being (calculated on the basis of seven variables – from self-assessment of physical health to subjective wellbeing), ethnic identity3.
We present brief characteristics of the economic behavior of the respondents who participated in the survey.
Consumer behavior has generally remained stable over the previous two years. About half of households spend 60% or more of their monthly income on current consumption, of which about a quarter spend more than 80% of their income. The average share of monthly income allocated to the purchase of consumer goods and services was 50.8% in 2023 and 49.8% in 2024. The share of persons with credit obligations to banks did not actually change during the specified period (49.8% and 47.1%, respectively). At the same time, the share of people who spend all their disposable income on current consumption decreased from 50.8% in 2023 to 35.4% in 2024. This may indicate the adaptation of the region’s population to changes in the economic situation caused by the 2022external shocks.
The share of respondents who are willing to spend 60% or more of their available funds on savings was 68.5% in 2023. About half (49.2%) of them indicated that they were ready to use all available funds for savings. These figures were 80.4% and 39.0%, respectively in 2024. At the same time, the index value of the propensity to save decreased slightly (from 3.9 to 3.7), but remained above average, which is associated with a significant decrease among individuals demonstrating savings behavior.
The share of those who actually invest through market instruments has increased more than 1.5 times over the period under review (from 4.5 to 7.9%). At the same time, the share of people who have free funds and are ready to invest them increased from 50.8% (26.4% of the sample) to 61% (39.4% of the sample). At the same time, the share of those who plan to invest more than half of their funds increased from 13.3% (8.5% of the sample as a whole) to 19.6% (12.6% of the sample) of those who have such an opportunity. The index value of the level of potential investments increased slightly (from 1.1 to 1.3) and remained within the minimum values. In terms of subjective willingness to invest (tolerance to investment risk), there has been a slight increase (from 2.8 to 3.1).
Table 2. Spearman’s ρ rank correlation coefficients
|
Social and socio-cultural characteristics of the respondents |
Year |
Share of monthly income allocated to consumption |
Propensity to save |
Investment propensity |
Investment risk tolerance |
|
Gender |
2023 |
0.128* |
0.172* |
-0.172* |
-0.086 |
|
2024 |
0.113* |
0.153** |
-0.153** |
-0.182** |
|
|
Age |
2023 |
0.012 |
0.322** |
-0.322** |
-0.441** |
|
2024 |
0.096* |
0.163** |
-0.163** |
-0.365** |
|
|
Settlement type |
2023 |
0.095 |
0.000 |
0.000 |
-0.034 |
|
2024 |
0.042 |
0.127* |
-0.127* |
-0.100* |
|
|
Number of minor children |
2023 |
0.125* |
0.258** |
-0.258** |
-0.290** |
|
2024 |
0.029 |
-0.020 |
0.020 |
-0.037 |
|
|
Number of household members |
2023 |
0.084 |
0.100 |
-0.100 |
0.053 |
|
2024 |
0.036 |
-0.023 |
0.023 |
0.025 |
|
|
Average monthly income of a family |
2023 |
-0.199** |
-0.175* |
0.175* |
0.011 |
|
2024 |
-0.190** |
-0.273** |
0.273** |
0.210** |
|
|
Assessment of income purchasing power |
2023 |
-0.315** |
-0.185* |
0.185* |
-0.097 |
|
2024 |
-0.231** |
-0.195** |
0.195** |
0.202** |
|
|
Level of generalized trust |
2023 |
-0.015 |
0.113 |
-0.113 |
0.051 |
|
2024 |
0.023 |
0.021 |
-0.021 |
0.134** |
|
|
Level of religiosity |
2023 |
0.088 |
0.151* |
-0.151* |
-0.142** |
|
2024 |
0.072 |
0.072 |
-0.072 |
-0.147** |
|
|
Level of education |
2023 |
-0.070 |
-0.176* |
0.176* |
0.145** |
|
2024 |
0.045 |
-0.037 |
0.037 |
0.084 |
|
|
Index of post-materialistic values |
2023 |
-0.159** |
-0.289** |
0.289** |
0.162** |
|
2024 |
-0.146** |
-0.181** |
0.181** |
0.160** |
|
|
Index of social well-being |
2023 |
-0.265** |
-0.056 |
0.056 |
0.047 |
|
2024 |
-0.174** |
-0.124* |
0.124* |
0.216** |
|
|
Ethnic identity |
2024 |
0.022 |
0.073 |
-0.073 |
0.044 |
|
* The level of statistical significance is < 0.05. ** The level of statistical significance is less than 0.01. Source: own compilation. |
|||||
Table 2 shows the results of the correlation analysis (Spearman’s ρ) between the respondents’ social characteristics and some indicators of economic behavior.
We should note that most of the statistically significant correlations in Table 2 are weak. An exception in the 2023 survey is the relationship between the assessment of the purchasing power of income and the share of monthly income that goes to consumption, as well as the relationship between age and propensity to save, invest and willingness to invest. According to the 2024 survey, only one moderate (negative) correlation was found – between age and subjective willingness to invest.
We identified the following general patterns of surveys: significant correlations with indicators of all types of economic behavior are found for gender, average monthly household income, and the respondent’s assessment of the purchasing power of their income, in particular, women are more likely to save and men are more likely to invest; the higher the respondent’s income, the more pronounced his investment behavior and less other types of economic behavior; the higher the age, the less willingness to invest and the slightly higher propensity to save.
The results of the correlation analysis of two waves of surveys show the stability of the relationship between the index of post-materialistic values and indicators of consumer, savings and investment behavior. Although all the identified links are weak, the effect of adherence to the values of “postmaterialism” is clearly visible: individuals who are more liberal (in the broadest sense of the term) and feel relatively economically and physically secure spend less of their income on current consumption, and their free cash is more likely to invest rather than save.; Accordingly, more conservative, cautious, and pragmatic (“materialists” according to R. Inglehart) citizens demonstrate preferences in favor of consumption and savings, a lower propensity to invest, and a low tolerance for the risks associated with them.
The remaining socio-cultural indicators such as: ethno-cultural identity (variables of the level of religiosity and ethnic identity), education (indicator of human capital), generalized trust (indicator of social capital), social well-being – either do not show correlation with indicators of economic behavior, or, if statistically significant relationships are identified, are not stable year by year and their identification in a one-year survey would be more correctly explained by the effects of bias in the sample. We should note, however, that a stable relationship between the parameters of sociocultural components and economic behavior is found in some cases: the level of religiosity negatively correlates with willingness to invest, and social well-being negatively correlates with the level of consumer spending.
Thus, after deducting the socio-demographic and socio-economic (household income and purchasing power) characteristics of the respondents, their economic behavior is significantly related primarily to value orientations.
The influence of socio-cultural space parameters on economic behavior
Using the idea of this method for the purpose of studying the influence of the basic components of the socio-cultural space (entities) on the choice of strategies for economic behavior, we will build a three-level hierarchy of “strategies – relational manifestations – entities”. The hierarchy construction procedure will be as follows.
-
1) Let A 1 , A 2 ,..., A n be possible strategies of economic behavior (alternatives), a 1 , a 2 ,..., a n , where Y^aj = 1 and all a.j >0 are their weighting coefficients determined by experts.
-
2) Let us define a list of B 1 , B 2 , ■■■, B m relational manifestations of entities and make a matrix
Р = ^m™ (i = 1, m) to
estimates of p^ contributions of the formation of alternatives to
A j (j = 1n ) , calculate (taking into account normalization) the corresponding weight coefficients (^ :
n
Pi T^Pi
; i = 1, m
or in matrix form:
-
3) For entities C 1 ,C 2 , ^,C l we will make a matrix of estimates Q = (q ki)txm and calculate the weighting coefficients Y k :
m
Yk = ^ЧкГ Pi; Yk = i=i
Y k %l k=i Y k
; к = 1, 1 (2)
or in matrix form:
^ k=1 Y k Li=iPi Yi k=1 Y k
Thus, the weighting coefficients y ^ (k = 1, l) are estimates of the influence of each of the basic components on the agent’s choice of their economic strategy. Moreover, this method allows determining the structure of the influence of the basic components in the context of each type of economic behavior v kJ- :
Using an approach based on the use of decision matrices, we will evaluate the contribution (influence) of the basic components of the sociocultural space on economic behavior. The corresponding hierarchy presented in Table 3 will contain three levels (from top to bottom) unlike the classical hierarchy of G.S. Pospelov: “strategies – relationships – entities”.
The basic components of the socio-cultural space (in our model, it is “entities”) were explicitly defined in the works of academician N.I. Lapin within the framework of the research project “Socio-cultural portrait of the region” primarily as components of the structure of what he calls the anthropic-cultural sphere4. Some conceptual modification of the description of this sphere (in the direction of greater detail and concretization) allowed identifying six such components.
The relational manifestations of each such component represent its relationship (relation – observed / not observed, and if observed, to what extent) to a certain attribute of it, which, in turn, mediates the influence of this component on a certain type of economic behavior. These relational manifestations were logically deduced from the content of concepts describing the components of the socio-cultural space. Values (in terms of R. Inglehart’s concept of post-materialistic values) mean a greater or lesser priority for ensuring basic needs for security and material well-being: high level
Table 3. Hierarchy levels
|
No. Hierarchy level |
Level elements |
|
1 Types (strategies) of economic behavior (alternatives) |
А 1 – consumer А 2 – saving А 3 – investment |
|
2 Relational manifestations of entities |
|
|
3 Basic components of the socio-cultural space (essences) |
C 1 – values C 2 – social well-being C 3 – human capital C 4 – social capital C 5 – identities C 6 – cultural consumption |
Source: own compilation.
of commitment to the values of post-materialism indicates satisfaction of these needs, greater confidence in institutions, trust in interpersonal relationships, and hence a high tolerance for risk, which creates the prerequisites for a more active investment behavior. In turn, high rates, for example, in the cultural consumption component, are manifested in the high priority of cultural leisure in a broad sense compared to career, household management, and utilitarian types of consumption. This in itself affects the scale of consumer behavior, but it also significantly modifies the structure of consumption. The rest of the logical relationships between components (entities) and their relational manifestations follow a similar pattern. At the same time, the relational manifestations of some entities may be influenced by the parameters of other entities to a greater or lesser extent.
We should say that based on the sociological survey results conducted by us in 2023–2024, the weighting coefficients of alternatives for economic behavior types were calculated ( Tab. 4 ).
Experts consistently assessed the impact of hierarchy levels “from bottom to top”. They were asked to assess the degree of influence of entities on the severity of relational manifestations, and the latter on the economic behavior of each of the three types. We used a five-point scale for evaluation: 5 – “very strong”, 4 – “strong”, 3 – “moderate”, 2 – “weak”, 1 – “very weak”.
Seven experts participated in the assessment (E1 – E7), which we consider optimal. This has already been proved by the authors in a number of works (Korobov, 2010; Tutygin et al., 2024). Representatives of academic and university institutions of the Arkhangelsk Region specializing in the study of socio-cultural phenomena, as well as representatives of regional cultural institutions, were involved as experts. The expert survey was conducted in the 2024 fall. The estimates obtained were used to calculate the weighting coefficients of the influence of indicators of socio-cultural space on indicators of economic behavior, which were applied to survey data for both years.
We compiled a matrix R based on the results of expert assessments of the effects of relational relationships on the choice of alternatives ( Tab. 5 ).
Tables 6, 7 show the correlation analysis results of the array of expert assessments of the impact of relational relationships on the choice of alternatives.
Table 4. Alternative weights to economic behavior
|
Alternatives |
А 1 |
А 2 |
А 3 |
|
Alternative weights (2023 survey) |
0.77 |
0.18 |
0.05 |
|
Alternative weights (2024 survey) |
0.75 |
0.19 |
0.06 |
|
Source: own compilation. |
|||
Table 5. Matrix R of average ratings
|
Relational manifestations of entities |
Economic behavior type |
||
|
А 1 |
А 2 |
А 3 |
|
|
B 1 |
3.71 |
4.14 |
4.86 |
|
B 2 |
3.29 |
4.43 |
4.43 |
|
B 3 |
3.29 |
3.43 |
4.00 |
|
B 4 |
4.14 |
3.86 |
3.71 |
|
B 5 |
4.86 |
3.71 |
2.71 |
|
B 6 |
4.14 |
4.57 |
4.57 |
|
Source: own compilation. |
|||
Table 6. Correlation coefficients rab of expert estimates pij
|
rab |
E1 |
E2 |
E3 |
E4 |
E5 |
E6 |
E7 |
|
E1 |
1.0000 |
||||||
|
E2 |
0.5840 |
1.0000 |
|||||
|
E3 |
-0.1181 |
0.2971 |
1.0000 |
||||
|
E4 |
-0.3154 |
0.1543 |
0.8024 |
1.0000 |
|||
|
E5 |
0.4347 |
0.2831 |
-0.1407 |
-0.1835 |
1.0000 |
||
|
E6 |
0.0489 |
0.0673 |
0.3576 |
0.2907 |
0.2015 |
1.0000 |
|
|
E7 |
0.6469 |
0.7576 |
0.0700 |
0.0000 |
0.1735 |
0.0159 |
1.0000 |
|
Source: own compilation. |
|||||||
Table 7. Student’s t-statistic values for r ab
|
t- calc. |
E1 |
E2 |
E3 |
E4 |
E5 |
E6 |
E7 |
|
E1 |
|||||||
|
E2 |
2.8776 |
||||||
|
E3 |
-0.4757 |
1.2448 |
|||||
|
E4 |
-1.3294 |
0.6247 |
5.3773 |
||||
|
E5 |
1.9305 |
1.1808 |
-0.5684 |
-0.7466 |
|||
|
E6 |
0.1958 |
0.2697 |
1.5319 |
1.2153 |
0.8229 |
||
|
E7 |
3.3936 |
4.6429 |
0.2808 |
0.0000 |
0.7047 |
0.0634 |
|
|
Source: own compilation. |
|||||||
The paired correlation coefficients r 12=0.584, r 17=0.647, r 27=0.758 and r 34=0.802 are statistically significant ( α = 0.05; tкр = 2.12), while there are no significant negative relationships.
The coefficients of variation for distributing expert estimates of the elements of matrix R are in the range of 7.78% ≤ Rp ≥ 40.99%.
Table 8 presents the weighting coefficients for 2023–2024, calculated according to formula (1) based on the data in Tables 4 and 5.
We compiled matrix Q based on the results of expert assessments of the influence of entities on relational relationships ( Tab. 9 ).
Table 8. Weight coefficients д ,
|
B i |
B 1 |
B 2 |
B 3 |
B 4 |
B 5 |
B 6 |
|
Д (2023) |
0.1631 |
0.1504 |
0.1418 |
0.1725 |
0.1926 |
0.1797 |
|
Д (2024) |
0.1636 |
0.1512 |
0.1421 |
0.1720 |
0.1910 |
0.1800 |
|
Source: own compilation. |
||||||
Table 9. Matrix Q of average ratings
|
Basic component of socio-cultural space |
Relational manifestations of entities |
|||||
|
B 1 |
B 2 |
B 3 |
B 4 |
B 5 |
B 6 |
|
|
C 1 |
3.71 |
3.43 |
3.71 |
5.00 |
4.29 |
3.86 |
|
C 2 |
3.71 |
4.14 |
4.14 |
3.86 |
4.00 |
4.43 |
|
C 3 |
2.86 |
3.71 |
4.14 |
4.00 |
3.71 |
4.29 |
|
C 4 |
3.43 |
3.86 |
4.14 |
3.57 |
3.29 |
3.71 |
|
C 5 |
2.57 |
3.71 |
2.57 |
3.57 |
2.43 |
2.86 |
|
C 6 |
1.86 |
2.71 |
2.71 |
3.29 |
4.71 |
3.14 |
|
Source: own compilation. |
||||||
Tables 10, 11 demonstrate the correlation analysis results of the array of expert assessments of the influence of entities on rela r cd tional relationships.
Statistically significant ( α = 0.05; tкр =2.03) are the paired correlation coefficients r 12=0.584, r 15=0.336, r 16=0.374, r 17=0.443, r 23=0.504, r 24=0.897, r 25=0.331, r 27=0.400, r 34=0.897, r 46=0.330, r 56=0.388, r 57=0.365 and r 67=0.589, with no negative associations.
The coefficients of variation for the distribution of expert estimates of the elements of matrix Q are in the range 0% ≤ RQ ≥ 57.56%.
Table 12 presents the weighting coefficients for 2023–2024, calculated according to formula (2).
Figure 5 shows the assessment of the influence of the components of the socio-cultural space on the choice of an economic behavior strategy based on 2023–2024 survey results.
The coefficients for assessing the contribution (influence) of the basic components of the sociocultural space on the choice of an economic behavior strategy demonstrate high stability over time. At the same time, the influence of the various components is not the same. The most significant contribution is made by social well-being and the values of “materialism”/“post-materialism”. The high role of the first of these components is easily explained: A high level of social well-being is organically linked to a higher assessment of one’s
Table 10. Correlation coefficients r cd of expert estimates q ki
|
r cd |
E1 |
E2 |
E3 |
E4 |
E5 |
E6 |
E7 |
|
E1 |
1.0000 |
||||||
|
E2 |
0.5480 |
1.0000 |
|||||
|
E3 |
0.2368 |
0.5039 |
1.0000 |
||||
|
E4 |
0.2567 |
0.4994 |
0.8974 |
1.0000 |
|||
|
E5 |
0.3361 |
0.3307 |
0.1824 |
0.1367 |
1.0000 |
||
|
E6 |
0.3740 |
0.2415 |
0.2707 |
0.3302 |
0.3881 |
1.0000 |
|
|
E7 |
0.4432 |
0.3999 |
0.2270 |
0.2972 |
0.3650 |
0.5892 |
1.0000 |
|
Source: own compilation. |
|||||||
Table 11. Student’s t -statistic values for r cd
|
t -calc. |
E1 |
E2 |
E3 |
E4 |
E5 |
E6 |
E7 |
|
E1 |
|||||||
|
E2 |
3.8198 |
||||||
|
E3 |
1.4213 |
3.4017 |
|||||
|
E4 |
1.5487 |
3.3609 |
11.8579 |
||||
|
E5 |
2.0812 |
2.0429 |
1.0817 |
0.8046 |
|||
|
E6 |
2.3517 |
1.4512 |
1.6397 |
2.0399 |
2.4556 |
||
|
E7 |
2.8828 |
2.5438 |
1.3593 |
1.8149 |
2.2859 |
4.2523 |
|
|
Source: own compilation. |
|||||||
Table 12. Weight coefficients Y k
|
C k |
C 1 |
C 2 |
C 3 |
C 4 |
C 5 |
C 6 |
|
П (2023) |
0.1867 |
0.1875 |
0.1755 |
0.1688 |
0.1362 |
0.1453 |
|
П (2024) |
0.1866 |
0.1876 |
0.1755 |
0.1689 |
0.1363 |
0.1451 |
|
Source: own compilation. |
||||||
-
Figure 5. Assessment of the influence of socio-cultural space components on the choice of economic behavior strategy
0.2
0.18
0.16
0.14
0.12
0.10
0.08
0.06
0.04
0.02
Illlll
С1
С2
С3
С4
С5
С6
I ■ 2023 2024
Source: own compilation.
material well-being, health, and legal protection, which, in turn, creates prerequisites for choosing an investment strategy for economic behavior. As for the values of that specific type, which we, following R. Inglehart, identify as an economic behavior factor, they presuppose a choice of two alternatives:
-
1) materialistic values are ensuring economic security in the medium term; hence the choice in favor of expanding current consumption in conditions of high inflation, combined with the creation of some kind of “safety cushion”;
-
2) post-materialistic values are concern for well-being in the future (as a result, preference for a long-term investor’s strategy, not only in stock market instruments, but also in their own human capital, the environment, their community, etc.).
In turn, the reduced influence on the choice of a certain strategy of economic behavior, which is characteristic of such components as the hierarchy of identities and cultural consumption, is due to the following:
-
1) none of the key identities that are widespread in the socio-cultural space of the Arkhangelsk Region (as well as in the Arctic zone of the Russian Federation as a whole) prescribes any normative model of economic behavior to its bearers;
-
2) cultural consumption has an impact on the structure of consumer spending, supplementing it with specific items and thereby affecting the savings rate and investment opportunities of the household; however, for the vast majority of people, such an impact is very limited, since in their case, acts of cultural consumption are episodic.
As we have noted, the influence of the basic components of the socio-cultural space in the structure of each type of economic behavior is described by matrix V, the elements of which are calculated according to formula (3) ( Tab. 13 ).
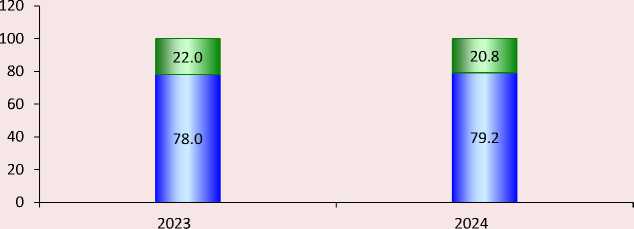
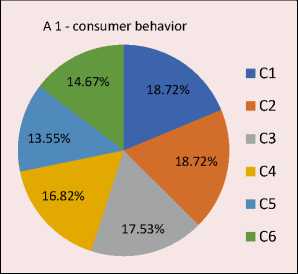
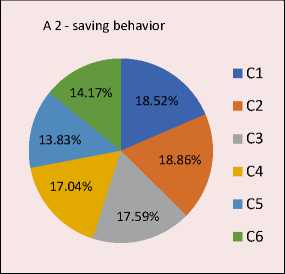
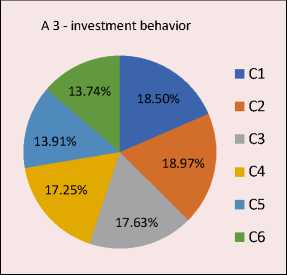
Figure 6 presents the assessment of the economic behavior structure in terms of the basic components of the socio-cultural space.
Table 13. Matrix V of the influence of the basic components in the structure of each type of economic behavior
|
Basic component of socio-cultural space |
Economic behavior type |
||
|
А 1 |
А 2 |
А 3 |
|
|
C 1 |
0.1872 |
0.1852 |
0.1850 |
|
C 2 |
0.1872 |
0.1886 |
0.1897 |
|
C 3 |
0.1753 |
0.1759 |
0.1763 |
|
C 4 |
0.1682 |
0.1704 |
0.1725 |
|
C 5 |
0.1355 |
0.1383 |
0.1391 |
|
C 6 |
0.1467 |
0.1417 |
0.1374 |
|
Source: own compilation. |
|||
Source: own compilation.
Figure 6. Economic behavior structure in the context of the influence of the socio-cultural space components
The structures shown in Figure 6 , in terms of the influence of the components of the socio-cultural space, are essentially identical, as evidenced by the values of the V.M. Ryabtsev index of structural differences, which do not exceed the threshold value of 0.03, which means the identity of structures5:
I 12= 0.008; I 13= 0.014; I 23= 0.006.
As a comment on the estimates based on empirical material, we note the following. Economic behavior is a kind of integrity, the structure of which is largely determined by the basic components of the socio-cultural space (entities).
At the same time, it is worth noting that the greatest contribution to the formation of all three types of economic behavior belongs to the components C 2 (social well-being) and C 1 (values). The group of entities with the least influence consists of entities C 5 (identity) and C 6 (cultural consumption). Entities C 3 (human capital) and C 4 (social capital) occupy an intermediate position.
The logical basis for combining C1 with C2 is as follows. Individuals’ propensity to materialistic or, conversely, post-materialistic values is largely determined by the parameters of social well-being. Theoretically, people with a “rich” experience of economic deprivation, violations of civil rights, who have no access to quality medicine and do not pay due attention to recreation are more likely to adhere to materialistic values. Those who rate their social well-being highly on most parameters are more committed to post-materialistic values.
There is a similar close relationship between C 5 and C 6. The identity largely determines the preferences of both cultural consumption formats and the content itself produced by the spiritual culture industry: those who identify with youth subcultures prefer appropriate cultural products; people with a pronounced religiosity in their cultural and consumer preferences will follow the prescriptions of religious tradition; people who are aware of their belonging to an ethnic minority are more likely to be interested in works of literature or pop music in their native language, etc.
Conclusions
In the course of our research, we have considered in sufficient detail the current issues related to various aspects of economic behavior of the population. We pay special attention to the structural dynamics of the socio-cultural space, which in modern conditions forms a system of factors concerning both direct and indirect influence on the choice of the prevailing type of economic behavior carried out by agents (groups of agents, households, etc.).
Using the tools selected and verified relative to the aim of the study (G.S. Pospelov’s decision matrices), we assessed the impact of the components of the socio-cultural space on the formation of economic behavior and their relationship. In particular, the paper shows that the influence of the basic components of the socio-cultural space on the economic behavior of the inhabitants of the surveyed region is hierarchically structured: the most significant contribution is made by social well-being and the values of “materialism” / “postmaterialism”, the least – identity and cultural consumption.
The methodological approach to assessing the indirect influence of socio-cultural factors on economic behavior, tested on the materials of the Arkhangelsk Region, is our adaptation of well-known methodological solutions for analyzing the relationship between socio-cultural and economic processes. This is the novelty of the research results. We do not see any fundamental limitations for applying their methodology to data obtained for constituent entities of the Russian Federation with a qualitatively different socio-cultural “profile”. Thus, another working tool has appeared in the methodological arsenal of researchers studying the impact of culture on the behavior of economic agents. This is the scientific significance of the article.
The approach we propose can be further used to identify and systematize the verbal and numerical characteristics of the transformational processes of the socio-cultural space of other Russia’s regions, as well as to develop models and development programs for various territories and regions that differ in their socio-economic and ethnocultural characteristics, dominant values of the population, levels of human and social capital, and a pool of collective agents with specific identities.
