Economic significance of heterogeneity in the innovative development of Russian regions in the context of external shocks

Author: Domnich Ye.L.
Journal: Economic and Social Changes: Facts, Trends, Forecast @volnc-esc-en
Section: Science, technology and innovation development
Article in issue: 4 т.18, 2025.
Free access
Modern research highlights the role of technological gaps and heterogeneity of innovative development in differentiating the level and pace of economic growth. This actualizes the analysis of trends in convergence and divergence of levels of innovative development of territories and the identification of special technological clubs within which regions develop convergently. The study systematizes theoretical and empirical approaches to the analysis of differentiation of economic development, understood as a result of differentiation of innovative development. A methodology has been designed to analyze the dynamics and differentiation of innovation activity of Russian enterprises over a long period of development (2010–2023 with details for 2010–2014, 2015–2018 and 2019–2023), taking into account changes in the methodology of statistical observation. An important feature of the methodology is tracking the innovative development of territories both in terms of the costs of innovation activities and the production of innovative goods, which allows using a common economic grouping of regions. The trends in regional innovative development have been identified in terms of changes in innovation activity and its differentiation within the economic groups of regions, which allowed formulating some hypotheses about the relationship between innovative and economic development of Russia’s regions; the hypotheses are to be tested in future studies
Innovation, innovation activity, economic development, convergence, divergence, external shocks, Russia’s regions
Short address: https://sciup.org/147251828
IDR: 147251828 | UDC: 330.3+311.3+332.1 | DOI: 10.15838/esc.2025.4.100.2
Text of the scientific article Economic significance of heterogeneity in the innovative development of Russian regions in the context of external shocks
The processes of convergence and divergence of the levels of economic development of the regions of Russia and foreign countries have been in the focus of attention of researchers for several decades. A close relationship between technology, innovation, and economic growth has been established for the regions of European countries (Badinger, Tondl, 2003; Basile, 2008; Guastella, Timpano, 2016), China (Jimenez-Moro et al., 2023), the United States (O’hUallachain, 2008), and Russia (Domnich, 2023; Nesytykh, 2024). Research highlights the increasing role of innovation and technology gaps in regional divergence of per capita income and labor productivity (Fagerberg, Verspagen, 1996; Rodriguez-Pose, Crescenzi, 2008; Chapman, Meliciani, 2017). Thus, the scientific and practical significance of a multidimensional analysis of regional dynamics and interregional differentiation of innovation activity is determined by the key role of innovation in the mechanism of modern economic growth. In turn, the innovation activity of Russian regions today is enormously and increasingly influenced by external shocks (Shida, 2019; Li, Li, 2022; Shkodinsky et al., 2022; Lenchuk, 2023). It is also necessary to take into account the frequent changes in the methodology of statistical observation of innovations, as well as the multidimensional nature of innovation itself as a phenomenon (Domnich, 2024a).
The aim of the study is to analyze the regional dynamics and differentiation of innovation activity in Russian regions in terms of the costs of innovation and the production of innovative goods. The objectives of the study include theoretical substantiation of the role of technological progress and innovation in differentiating the rates of economic development of countries and regions; substantiation for grouping Russian regions that take into account the comparative level of innovative development; calculation of indicators of innovation activity and its differentiation within the proposed groups of regions, and an economic analysis of the identified trends.
The subject of research is spatial and temporal differentiation of the innovation activity of Russian enterprises in the regions of Russia. The object of study includes 81 regions in 2010–20231 with details for three periods: 2010–2014, 2015–2018 and 2019–2023, due to significant changes in the volume of innovation costs and output during these periods, as well as in the methodology of statistical observation.
Economic growth is a necessary condition for the convergence of economies; therefore, convergence processes are analyzed primarily within the framework of growth theories. Technological progress is considered to be the main source of growth and related processes of convergence or divergence in the long term. Economic growth theories consider the role of technological progress in these processes from different perspectives.
In neoclassical growth models (Solow, 1956; Swan, 1956), technological progress is an exogenous process. It is assumed that technology and knowledge are public goods and all economies (countries and regions) have access to them. Hence, a region-wide and global convergence of growth trajectories is forecasted, based on a decrease in returns on capital accumulation when economies strive for a common long-term sustainable condition.
In endogenous growth models (Romer, 1986; Lucas, 1988), technological progress occurs within the economy due to investments in research and human capital. The unequal ability of countries and regions to accumulate such resources causes the divergence of growth trajectories.
In Schumpeterian models of innovation-based growth (Romer, 1990; Aghion, Howitt, 1992; Grossman, Helpman, 1994), technological progress depends on accumulated knowledge (Coe, Helpman, 1995). Knowledge is considered as appropriated and non-competitive good, which explains the possibility of increasing returns from its use (Castellacci, 2007). The externalities resulting from the dissemination of knowledge are the most important source of sustainable growth in the long term (Koo, 2005). Therefore, differences in innovation potential between countries and regions become the main reason for persistent differences (divergence) in economic indicators (Rodriguez-Pose, Crescenzi, 2008).
In the Schumpeterian multi-country growth model (Howitt, 2000), innovation requires skilled labor and is the only source of technological progress. There are differences between innovative countries that carry out research and development, and non-innovative countries where research and development is not carried out. As a result of technology exchange, innovative countries form clubs whose members develop convergently along parallel growth trajectories; at the same time, non-innovative countries stagnate. In the detailed model (Howitt, Mayer Foulkes, 2005), qualified human resources are already required for both innovation and simulation activities. Accordingly, the countries are divided into three groups: innovation, imitation and stagnation. Innovators and imitators develop along a converging trajectory, but they do not achieve the same level of productivity. The ability of technologically lagging countries and regions to adapt the latest innovations can be undermined by the outflow of human capital, preventing the gap in innovation activity, productivity and income from being bridged.
Thus, in the Schumpeterian tradition, differences in the ability of economies to create and imitate innovations are considered as the most important source of income polarization and the formation of convergence clubs (Castellacci, 2008). Economic growth is the result of the action of two opposing forces: innovation, which generates a technological and economic gap, and imitation, which, as a rule, reduces it (Fagerberg, 1987). Technological progress can be both a driver of convergence (through imitations) and divergence (through innovations) of development levels (Verspagen, 2010). Technologically backward economies can take advantage of their position and increase their growth rates by spreading technology by imitating it (Castellacci, 2007; Fagerberg, 1987). The rate of convergence or divergence depends on the comparative innovation activity in lagging and advanced economies (Fagerberg, 1987).
Therefore, empirical research is aimed, first, at identifying certain technological clubs of countries and regions, and second, at a comparative analysis of the growth and development drivers of such clubs. Based on the research objectives, we are primarily interested in the first task. In our opinion, there are currently two main approaches to its solution: static and dynamic.
The regional specification of national economies also makes it possible to use spatial econometrics tools to demarcate technological clubs. Thus, based on the analysis of spatial correlations of 30 indicators assessing the level of education, employment by sector, unemployment rate, level and growth rate of GDP (GRP), population density and patents by industry in the regions of the European Union (EU) for 1999–2003, it is shown that the latter form a spatial hierarchy of four groups: Southern Europe, Eastern Europe, and two groups of Northern and Western Europe (Verspagen, 2010).
The dynamic clustering of technology clubs is based on a methodology developed in (Phillips, Sul, 2007) for identifying converging time series of panel data. Unlike static clustering methods that group regions using a priori criteria, this approach makes it possible to do this endogenously, identifying groups based on implicit (hidden) factors that determine the convergence of development trajectories within each of the groups. It is based on a sigma convergence of a panel of regions and models its structure as a nonlinear relationship in which the coefficients may vary through time (Barrios et al., 2019, p. 1549). Thus, there are not just clusters, but convergence clubs of countries and regions.
Based on the analysis of patent statistics, methodological studies (Phillips, Sul, 2007) have identified technologically convergent clubs in the EU (Barrios et al., 2019) and China (Jimenez-Moro et al., 2023) regions. In both cases, it is proved that there is no single convergent equilibrium trajectory of innovative development for all regions, which contradicts neoclassical growth models, but is predicted in Schumpeterian models. It is also shown that the number of highly developed leading regions developing convergently in both the EU and China is very small. In the EU in 2002–2012 there were only two such regions in the first club in terms of patent activity (Vorarlberg in Austria and Zealand in the Netherlands) and six in the second club in terms of development (two regions of Germany, Finland and Sweden each); and in China in 1987– 2020 there were seven eastern regions (Anhui, Beijing, Guangdong, Jiangsu, Shandong, Shanghai, Zhejiang), and the composition of the leadership group changed in 1987–2000, 2000–2010, and 2010–2020.
Today, the practice of clustering Russian regions, both innovative and technological, and general economic, is dominated by a static multicriteria approach (Ketova et al., 2021; Byshev et al., 2024; Verenikin, Verenikina, 2024). Regions are arranged into groups and clusters based on formal manipulation of all available statistical indicators. In contrast to the mainstream foreign approaches to identifying regional innovation clubs (Castellacci, 2008; Verspagen, 2010; Stollinger, 2013; Barrios et al., 2019; Jimenez-Moro, et al., 2023) groupings of Russian regions are de facto not based on any theoretical foundation and, in fact, represent a set of statistical artifacts. In addition, it is not uncommon to use science and technology indicators that are not suitable for assessing the volume of innovation in Russian conditions, such as the number of patents and employment in the scientific sector (Baburin, Zemtsov, 2013; Zemtsov et al., 2015).
We have identified technology clubs in Russian regions based on two important and relevant indicators of innovation (the cost of innovation and the volume of innovative products), and used both static and dynamic clustering techniques to group them.
In accordance with the objectives, the study was conducted in two stages.
At the first stage, specific indicators, time periodization, and the grouping of Russian regions for research purposes were substantiated.
Innovations determine the quality of economic development at all stages of the economic cycle, so it is important to analyze the dynamics and differentiation of innovation activity in the regions of Russia both in terms of innovation costs (inno^put ), and innovation output (inno°utput ), where i – index of the region, and t – time. The only source of data on innovation costs and output is statistical observation according to Form 4-innovations (Domnich, 2024a; Domnich, 2024b). It allows estimating the indicators of innovation activity by input and output as, respectively, the ratio of the cost of innovation zidit 2 and volume of shipped innovative products oitit 3 to the total volume of products shipped by enterprises that filled in Form 4-innovations output^:
inno ™ put = zidit/outputit; (1)
inno°^tput = oitit/outputit. (2)
The cost indicators under consideration are brought to a comparable form by converting them into the 2010 prices using the deflators we consider most relevant. For oitit и output^ it is the producer price index5, and for zidit — index of the prices of products (costs, services) for investment purposes6.
There are not many works on issues concerning innovative development periodization (Domnich, 2023; Domnich, 2024a). In this case, it is based on the dynamics of innovation costs and the volume of innovative goods in the Russian economy in 2010–2023 ( Fig. 1 ). This dynamic depends both on objective processes in the national economy and on changes in the sectoral coverage of the statistical survey according to Form 4-innovations7. We can observe a growth period of 2010–2014, a stagnation period of 2015–2018, and a period of mixed dynamics, due, among other things, to a significant increase in the number of industries covered by the survey, 2019–2023.
We have made an economic grouping of regions whose large and medium enterprises (according to the results of the survey based on Form 4-innovations) carry out innovations on a regular basis ( Fig. 2 ). The idea behind the economic grouping (I1... I6) is to identify such groups of regions that would form a time-stable hierarchy from the most developed regions to the least developed ones. At the same time, it is desirable that the rating of regions by innovation costs correspond to their rating by innovation output, that is, if R i t — rank (place in the rating) of region i at time t ,
Figure 1. The costs of innovation activities and the volume of innovative goods of Russian large and medium enterprises in the 2010 prices, trillion rubles
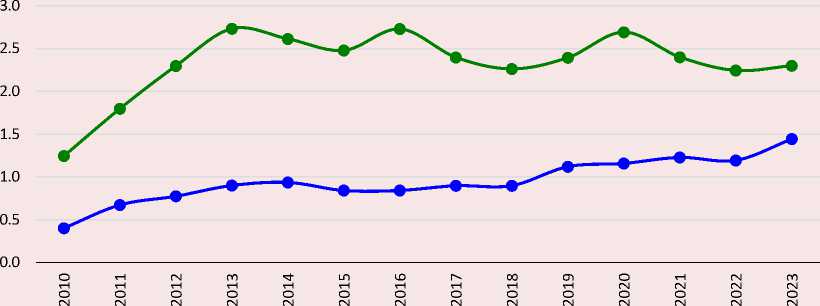
^^^^^н Innovation costs ^^^^^^^^^ Innovative goods output
Source: own calculation.
Figure 2. Economic grouping of regions
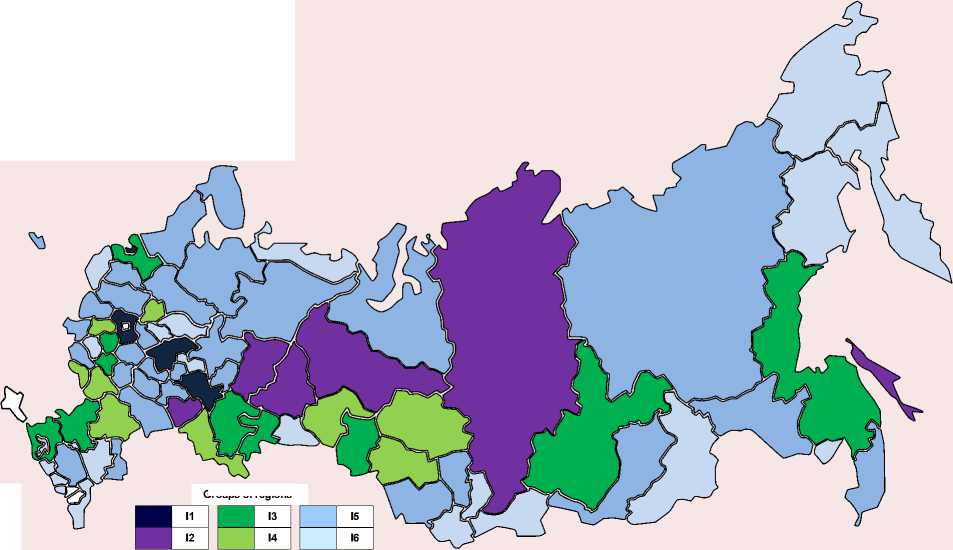
Source: own compilation.
Groups of regions
then it is necessary that R^ « R^ for any i and t . Ranking by initial indicators zidit and oit ( t will create two ratings that do not match and vary from year to year, since the indicators are characterized by low mutual correlation and significant spatial and temporal differentiation (Domnich, 2024b).
It has been established that the average annual cost of innovation activity and the volume of innovative goods over a long period of time can be used as a time-stable criterion. Calculations for 2010–2020, 2010–2021, 2010–2022, and 2010– 2023 indicate that for each region the average annual values of these indicators remain approximately at the same level, regardless of whether the indicator was calculated for 11, 12, 13, or 14 years, with R if = R if for all i and t . This made it possible to form a rating of regions that was the same both in terms of innovation costs and innovative product output. Based on it, six groups were identified, with group I1 comprising the most developed regions and group I6 the least developed ones8. The groups were selected according to the principle of maximum similarity of objects within one group and maximum dissimilarity of objects within different groups.
Groups (I1... I6) do not overlap in economic indicators and differ greatly in economic weight (Tab. 1). In the four most developed (excluding Moscow) regions (Group I1) a quarter of national expenditures on innovation activities and a third of the volume of innovative goods are localized (in total for 2010–2023). Together with Moscow, the top-5 regions account for about half of Russian expenditures on innovation and the production of innovative goods. At the same time, the 21 least developed regions (Group I6) account for less than 1% of national innovation costs and slightly more than 1% of the volume of innovative goods.
At the second stage, indicators of the dynamics and differentiation of innovation activity were calculated for each group of regions.
The characteristics of innovation dynamics in 2010–2014, 2015–2018 and 2019–2023 are based on the average values of innovation activity and the average annual growth rates within each group and period. The indicators of innovation activity are calculated according to formulas (1) and (2). The growth rates of innovation activity are calculated based on the geometric averages of the growth rates of innovation activity over the period.
The characteristic of innovation activity differentiation is based on interregional and intragroup variation of innovation activity. The coefficient of variation (CV) is used as a measure of variation, which corresponds to the experience of relevant studies (Phillips, Sul, 2007; Markowska, Strahl, 2012). The coefficient of interregional variation is calculated as follows:
Щ = (t/innoi, (3)
where:
at — standard deviation;
innot — average value of innovation activity innoit of all regions of the country per year t .
Table 1. Costs of innovation and production of innovative products by group of regions in 2010–2023
|
Group of regions |
Number of regions |
Annual average, billion rubles |
Share, % |
||
|
Innovation costs |
Output of innovative goods |
Innovation costs |
Output of innovative goods |
||
|
I1 |
4 |
from 50 to 70 |
from 680 to 980 |
25.6 |
33.6 |
|
I2 |
6 |
from 25 to 36 |
from 345 to 505 |
18.7 |
18.3 |
|
I3 |
10 |
from 10 to 20 |
from 150 to 280 |
16.3 |
15.6 |
|
I4 |
9 |
from 5 to 10 |
from 70 to 120 |
6.6 |
9.4 |
|
I5 |
30 |
from 1 to 5 |
from 17 to 70 |
8.9 |
14.4 |
|
I6 |
21 |
to 1 |
to 13 |
0.7 |
1.2 |
|
city of Moscow |
1 |
215 |
361 |
22.6 |
15.4 |
|
Source: own calculation. |
|||||
8 For more information about the composition of the groups of regions, see (Domnich, 2024a; Domnich, 2024b).
The coefficient of intragroup variation is calculated according to the formula:
CV* = ^/тпо*, (4)
where:
a * — standard deviation;
тпо * — average value of innovation activity innO i t of the regions of group k in year t .
Coefficient of variation values exceeding 33% are considered high. Convergence of indicators occurs when CVt+T< CVt , and divergence — if CVt+T > CVt , where T — period of time (Glush-chenko, 2012, p. 26). As a measure of variation, the average annual growth rate is used, calculated on the basis of geometric averages of the growth rate of innovation activity over the period.
The results of the study include the objective trends found, as well as scientific hypotheses to be tested in the course of future research.
The innovation activity of Russian enterprises increased consistently only in the pre-sanctions period of 2010–2014, both in terms of innovation costs and the output of innovative products ( Fig. 3 ). Innovation activity in terms of costs increased from 1.5 to 3%, and innovation activity in terms of output increased from 5 to 8.5%. In 2015–2018, external shocks were reflected in the stagnation of cost innovation activity at about 2.5% and output innovation activity at 6.5–7.5%. A significant expansion of the industry coverage of statistical observation according to Form 4-innovations in 2019–2023, which allowed Rosstat to keep the official values of absolute innovation indicators at the same level, led to a noticeable decline in innovation activity, including in terms of costs to 2–2.5% and output to 5.5–6.5%. Thus, the periods in question differ significantly both in terms of
Figure 3. Innovation activity (left scale) and coefficients of its variation (right scale) in the regions of Russia* in 2010–2023, %
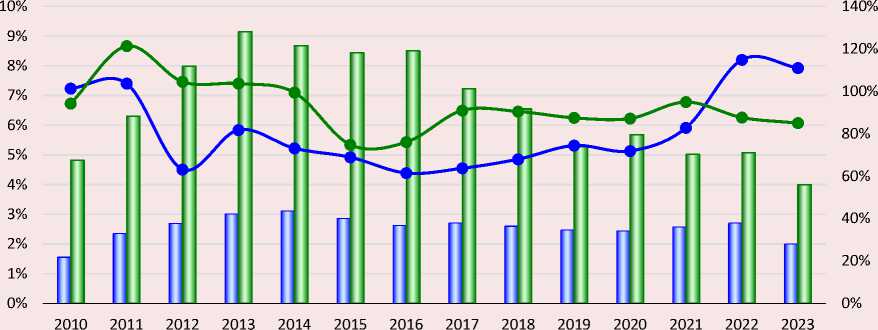
Innovation activity in terms of costs
Innovation activity in terms of output
Coefficient of variation of innovation activity in terms of costs
Coefficient of variation of innovation activity in terms of output
absolute and relative indicators of innovation. The highest average annual innovation activity in terms of costs and output is recorded in 2015–2018, the lowest in 2019–2023, while the initial period of 2010–2014 occupies an intermediate position.
An analysis of the dynamics of innovation activity in the context of the economic grouping of regions allows us to conclude that several of the most developed of them (Group I1) play an exceptional role in shaping the country’s innovation landscape ( Tab. 2 ). This is the only group of regions whose innovation activity consistently exceeds not only the average Russian values, but also those of the Moscow Region in terms of both the cost of innovation and the output of innovative products. Having achieved in 2015–2018 the level of 4% for the first indicator and 14% for the second, Group I1 fell slightly back in 2019–2023, while all other regions, including Moscow, significantly reduced statistically observed innovation activity during this period. In particular, the innovation activity in the Nizhny Novgorod Region during 2010– 2023 did not fall below 10%, and in the Republic of Tatarstan – below 15%. In other words, Group I1 is represented by indisputable and stable leaders who are located exclusively in the European part of the country, specialize in certain manufacturing industries and are supported by government defense orders.
The innovation activity in Group I2 is already comparable to the Russian average, noticeably inferior to the level of Moscow and was declining considerably in 2019–2023. However, even in this group, the regions are able to maintain high rates for several years. Thus, the innovation activity of the Sakhalin Region in 2011–2014 was 54–60%, significantly elevating the region above all others and making the entire Far East a leader during the pre-sanctions period. The innovation activity in the output of the Samara Region during 2010– 2018 did not fall below 14%, and that of the Perm Region in 2016–2020 was not lower than 11%. Thus, if we call this group pure “imitators” in line with the mainstream approach to the classification of regions (Fagerberg, 1987; Castellacci, 2007; Verspagen, 2010; Stollinger, 2013), it would be an oversimplification of the real situation. Rather, they are leaders whose industry structure of innovation is more diversified (compared to Group I1), including due to extractive industries (Krasnoyarsk Territory, Khanty-Mansi Autonomous Area, Sakhalin Region).
Group I3 comprises ten average performers, whose innovation activity roughly corresponds to the national average. Unlike the more developed first two groups, the regions of this group are scattered throughout the country – from the Leningrad Region in the northwest to the Khabarovsk Territory in the east and the Krasnodar Territory in the south. They also have defense enterprises, but their much more modest production base than those of Group I1 and I2 regions does
Table 2. Innovation activity in regions, %
|
Group of regions |
In terms of innovation costs |
In terms of innovative products output |
||||
|
2010–2014 |
2015–2018 |
2019–2023 |
2010–2014 |
2015–2018 |
2019–2023 |
|
|
I1 |
3.5 |
4.1 |
4.1 |
13.5 |
13.9 |
11.2 |
|
I2 |
2.9 |
3.2 |
2.4 |
9.1 |
7.0 |
4.8 |
|
I3 |
2.9 |
2.4 |
2.5 |
5.2 |
7.1 |
5.0 |
|
I4 |
1.8 |
1.8 |
1.4 |
4.0 |
7.8 |
5.7 |
|
I5 |
1.4 |
1.1 |
0.8 |
4.7 |
5.0 |
4.1 |
|
I6 |
0.7 |
0.5 |
0.4 |
3.0 |
2.4 |
1.5 |
|
city of Moscow |
3.3 |
3.6 |
3.3 |
9.2 |
8.5 |
3.4 |
|
Russia, excluding the city of Moscow |
2.6 |
2.7 |
2.3 |
7.5 |
7.6 |
5.2 |
|
Source: own calculation. |
||||||
not allow them to attract significant and long-term investments from the federal budget. Consistently high innovation activity was observed in enterprises of the Lipetsk Region in 2010–2017 (at least 9%), the Tula Region in 2011–2022 (at least 8%) and the Khabarovsk Territory in 2013–2022 (at least 10%).
The most important feature of the innovative development of the three most developed groups of regions (I1, I2, I3) is its isolation from regional economic development as such. The most powerful innovative enterprises of the defense and resource industries are located here, forming technological enclaves within regional economies. There is reason to believe that Schumpeterian models of growth and convergence (Aghion, Howitt, 1992; Howitt, 2000; Howitt, Mayer-Foulkes, 2005) cannot be applied to regions where the main pool of Russian innovations is concentrated (in value terms). The top-20 regions also do not have the usual mechanism for increasing innovation activity through investment in technology research and exploitation, which distinguishes them from the 60 least developed regions (groups I4, I5 and I6) (Domnich, 2024b).
Let us hypothesize that only in the least developed regions (groups I4, I5 and I6) innovation activity can and should be considered in relation to economic development, including as its volatility factor. Their innovative development in the mirror of official statistics is mainly determined by the enterprises of the civil manufacturing industry, and in agricultural regions also by the activities of agricultural enterprises since 2016. Groups I4, I5 and I6 differ markedly from each other in terms of innovation activity. The innovation activity cost and output in Group I5 is twice as high as in Group I6, and in Group I4 it is one and a half times higher than in Group I5. Thus, despite the insignificant share of these three groups in the national innovation pool, each of them may have a pronounced specificity of innovation activity, and therefore possess an independent value from the point of view of economic analysis. At the same time, low values of the absolute value of innovation indicators do not mean low innovation activity. For example, the innovation activity in the Republic of Mordovia in 2010–2022 did not fall below 21%, which is unattainable even for Moscow.
More developed regions also have significant advantages over less developed ones in terms of the comparative dynamics of innovation activity ( Tab. 3 ). In the pre-sanctions years 2011–2014, Moscow and the regions of groups I1 and I2 demonstrated the highest average annual growth rates of innovation activity in terms of costs, while Moscow and the regions of groups I1, I2 and I3 demonstrated innovation activity in terms of output. Innovation activity in the regions of Group I6 decreased on average in the pre-sanctions years. Nevertheless, during the periods associated with the sanctions shock, the highest average annual growth rates of innovation activity are observed in less developed regions: Group I4 (innovation activity
Table 3. Average annual growth rate of innovation activity, %
|
Group of regions |
In terms of innovation costs |
In terms of innovative products output |
||||
|
2011–2014 |
2015–2018 |
2019–2023 |
2011–2014 |
2015–2018 |
2019–2023 |
|
|
I1 |
32.2 |
-3.5 |
-1.6 |
10.9 |
-2.8 |
-7.5 |
|
I2 |
25.6 |
-7.6 |
-2.7 |
24.3 |
-10.8 |
-12.6 |
|
I3 |
-3.7 |
-2.6 |
6.1 |
14.8 |
-0.01 |
-2.3 |
|
I4 |
17.8 |
-11.3 |
0.05 |
-3.4 |
20.6 |
-12.2 |
|
I5 |
6.3 |
-4.8 |
-6.1 |
9.6 |
-5.2 |
-4.2 |
|
I6 |
-13.6 |
-4.3 |
11.3 |
-9.5 |
-7.8 |
-1.1 |
|
city of Moscow |
45.4 |
-2.6 |
1.3 |
83.5 |
-27.6 |
9.7 |
|
Russia, excluding the city of Moscow |
18.9 |
-4.4 |
1.1 |
15.8 |
-6.8 |
-6.3 |
|
Source: own calculation. |
||||||
in terms of output in 2015–2018) and Group I6 (innovation activity in terms of costs in 2019–2023). We can assume that during periods of increasing external shocks, less developed regions receive the opportunity to increase their innovation potential, while the most developed ones retain their leading positions largely by inertia.
A comparative analysis of the dynamics of the two indicators of innovation activity makes it possible to identify spatio-temporal segments where innovation activity in terms of costs and innovation activity in terms of output changed in the opposite direction relative to each other. Here we should point out the dynamics in Group I3 in 2011– 2014 and 2019–2023, Group I4 in 2011–2014, 2015–2018 and 2019-2023, and Group I6 in 2019–2023. The presence of such spatio-temporal segments can be explained by two reasons. The first is the implementation of innovation activities in conditions of a limited production base, when the development of innovations of the current year is possible only by reducing the output of innovative products introduced 2–3 years ago. The second is that two innovation indicators describe innovation processes in various enterprises: some enterprises spend mainly on innovation activities, while others produce innovative products without statistically significant costs.
At the same time, in groups I1, I2, and I5, as well as in the city of Moscow, indicators of innovation activity have always changed in concert with each other, growing or decreasing simultaneously throughout the entire period 2011– 2023. Hence, it is appropriate to assume that the consistency of the dynamics of innovation costs and output is determined by industry specialization and industry diversification of the regional innovation portfolio. It is possible to formulate a hypothesis that innovation processes in the most developed regions (city of Moscow, groups I1 and I2), as well as in Group I5, are more uniform in terms of industry structure and implementation mechanisms than in groups I3, I4 and I6.
The differentiation of innovation activity in Russia’s regions is characterized by high values of the coefficient of variation, which did not fall below 60% for innovation activity in terms of costs, and below 75% for innovation activity in terms of output during the entire period 2010–2023 (see Fig. 3). Variation in innovation activity in terms of output has always been higher than variation in innovation activity in terms of costs with the exception of 2010 and 2022. On average, across all regions, excluding the city of Moscow, the variation in innovation activity in terms of costs was minimal in 2015–2018, and maximal in 2019–2023. ( Tab. 4 ). In contrast, the variation in innovation activity in terms of output was maximal in the pre-sanctions years 2010–2014, decreased in 2015–2018 and remained at the same level on average in 2019–2023.
Table 4. Average annual coefficient of variation in innovation activity, %
|
Group of regions |
In terms of innovation costs |
In terms of innovative products output |
||||
|
2010–2014 |
2015–2018 |
2019–2023 |
2010–2014 |
2015–2018 |
2019–2023 |
|
|
I1 |
29.4 |
27.9 |
52.2 |
28.4 |
30.0 |
38.5 |
|
I2 |
57.1 |
33.8 |
51.6 |
185.7 |
96.5 |
80.3 |
|
I3 |
67.2 |
50.3 |
84.3 |
73.8 |
76.1 |
84.2 |
|
I4 |
106.6 |
64.4 |
69.3 |
88.9 |
62.3 |
63.0 |
|
I5 |
104.4 |
107.0 |
163.1 |
132.6 |
126.3 |
122.5 |
|
I6 |
179.6 |
96.3 |
310.8 |
128.2 |
130.9 |
142.5 |
|
Russia, excluding the city of Moscow |
85.7 |
66.8 |
92.5 |
105.0 |
80.5 |
80.6 |
Source: own calculation.
The coefficient of variation in innovation activity has a pronounced tendency to increase as it moves from more developed regions to less developed ones. According to the results of 2019– 2023, the lowest differentiation of innovation activity in terms of both costs and output is recorded in Group I1, and the highest in Group I6. In Group I1 in 2010–2014 and 2015–2018, the variation in innovation activity was less than 33%, i.e. it could not be considered high. At the same time, in Group I6 the variation in innovation activity in terms of costs in 2010–2014 was 180%, and in 2019–2023 it was 312%, which indicates the extremely high volatility of the indicator within the group. This means that less developed regions have a greater variety of innovative development trajectories than more developed ones (Aghion, Howitt, 1992; Howitt, 2000; Howitt, Mayer-Foulkes, 2005). Hence, it can be hypothesized that the role of innovation in differentiating the pace and level of economic development is higher in less developed regions of Russia than in more developed ones. Currently, it is difficult to carry out econometric verification of this hypothesis, due to a number of statistical limitations.
The coefficient of variation of innovation activity in terms of costs differs from the variation of innovation activity in terms of output by significantly greater volatility both in the direction of increase (divergence) and decrease (convergence;
Tab. 5 ). At the same time, the trends in variation of the two indicators of innovation activity on average across the regions in 2011–2023 were opposite. The variation in innovation activity in terms of costs decreased (there was convergence) in 2011– 2014 and 2015–2018, and increased (there was divergence) in 2019–2023. On the contrary, the variation in innovation activity in terms of output on average Russia’s regions increased slightly in 2011– 2014, and decreased in 2015–2018 and 2019–2023.
It turns out that our conclusions about the convergence (divergence) of innovative development and about the factors causing convergence (divergence) of economic development may be directly opposite, depending on the choice of the indicator of innovation activity. In this regard, the last hypothesis can be formulated: the results of key mainstream studies on the identification of regional technology clubs (Fagerberg, 1987; Castellacci, 2007; Verspagen, 2010; Stollinger, 2013) are virtually irreproducible when using a different set of statistical indicators of science, technology, innovation and education.
This problem is especially evident if we analyze the dynamics of the coefficient of variation of innovation activity in certain groups of regions. In 2011–2014, the average annual negative increase in innovation activity in terms of costs in Group I1 was very significant: -18.4%, while the convergence of innovation activity in terms of output was no
Table 5. Average annual growth rate of the coefficient of variation of innovation activity, %
|
Group of regions |
In terms of innovation costs |
In terms of innovative products output |
||||
|
2011–2014 |
2015–2018 |
2019–2023 |
2011–2014 |
2015–2018 |
2019–2023 |
|
|
I1 |
-18.4 |
21.1 |
12.4 |
-1.9 |
1.3 |
12.9 |
|
I2 |
-2.8 |
-8.4 |
5.6 |
12.6 |
-15.6 |
-5.5 |
|
I3 |
-21.7 |
13.0 |
3.3 |
-1.4 |
8.3 |
-7.7 |
|
I4 |
-12.6 |
0.2 |
-0.4 |
-3.2 |
-4.0 |
-8.5 |
|
I5 |
14.2 |
-4.3 |
22.9 |
-5.7 |
4.6 |
1.6 |
|
I6 |
43.6 |
-29.4 |
66.7 |
6.7 |
0.2 |
1.4 |
|
Russia, excluding the city of Moscow |
-7.8 |
-1.8 |
13.6 |
1.3 |
-2.3 |
-0.9 |
|
Source: own calculation. |
||||||
more than -2% per year. Similar contradictory conclusions can be drawn about the convergence of innovation activity in 2011–2014 in groups I3 and I4 and in 2015–2018 in Group I6. Similarly, the divergence of innovation activity in terms of costs was significantly higher than the divergence of innovation activity in terms of output in 2011– 2014 in Group I6, in 2015–2018 in groups I1 and I3, and in 2019–2023 in groups I5 and I6. In a number of spatio-temporal segments, the dynamics of the coefficient of variation of one indicator of innovation activity indicates convergence of innovative development, while the other indicates divergence. These are, for example, Group I2 in 2011–2014 and 2019–2023, Group I3 in 2019– 2023, Group I5 in 2011–2014 and 2015–2018, and Group I6 in 2015–2018.
The problems and contradictions identified in the course of our study, as well as the hypotheses formulated on their basis, determine the potential for further work in the field of economic analysis of the relationship between innovation and economic dynamics.
Conclusion
In the modern economy, innovation is the most important factor in economic dynamics, largely determining the comparative level of economic development of countries and regions. Therefore, a comparative analysis of the dynamics and differentiation of innovation activity in the regions of the country has considerable relevance, especially over long-time intervals. But here researchers often face statistical and methodological limitations.
The study proposes a methodology that helps to overcome statistical limitations associated with changes in industry coverage using Form 4-innovations, and to analyze the dynamics and differentiation of innovation activity in Russia’s regions in 2010–2023. The methodology boils down to a comparative analysis of alternative indicators of innovation activity (in terms of costs and output), as well as their coefficients of variation within historically significant time periods (2010–2014, 2015–2018, and 2019–2023) and a consistent grouping of regions based on the economic opportunities of each of them. The grouping of regions is based on the average annual values of indicators of innovation costs and the volume of innovative goods (city of Moscow is outside the grouping). Six (I1... I6) time-stable groups of regions have been identified, among which Group I1 comprises the most developed regions (with the highest average annual cost of innovation and the volume of innovative goods), and Group I6 contains the least developed ones (with the lowest average annual values of innovation indicators).
It has been established that only Moscow and the most developed regions (Group I1) are able to ensure a high and stable level of innovation activity over a long period of time. In other groups, innovation activity is sensitive to external shocks and changes in the industry coverage of statistical observations, which is reflected in a significant decrease in innovation activity in terms of costs and output in 2019–2023. Only the most developed regions (groups I1, I2, I3) could provide significant positive growth rates of innovation activity in the pre-sanctions period of 2010–2014. At the same time, during the periods associated with external shocks (2015–2018 and 2019–2023), a consistent and significant increase in innovation activity could be observed only in less developed regions (groups I4 and I6). The spatio-temporal segments were identified, within which innovation activity in terms of costs and innovation activity in terms of output changed in the opposite direction. Such segments are observed only in relatively less developed regions (groups I3, I4, I5, I6), whereas in the most developed regions (city of Moscow, groups I1 and I2) the dynamics of the two indicators of innovation activity is characterized by a positive correlation.
It has been found that the coefficient of variation of innovation activity in Russia’s regions, except for the most developed ones (Group I1), significantly exceeded 33% during the entire period 2010–2023, which indicates a high heterogeneity of innovative development of the territories. The variation of innovation activity in terms of output is usually higher than the variation of innovation activity in terms of costs; the trends of their change are multidirectional. The volatility of the coefficient of variation of innovation activity in terms of costs is noticeably higher than the volatility of the coefficient of variation of innovation activity in terms of output. The coefficient of variation of innovation activity is lower in the most developed regions and higher in the least developed ones.
Based on the established facts, hypotheses have been formulated that are subject to verification in future studies. In general, they postulate the fundamental incompatibility of the most developed (groups I1, I2, I3) and least developed (groups I4, I5, I6) regions in terms of structural characteristics and the mutual impact of economic and innovative development. It is assumed that only in the least developed regions innovation activity can be considered in relation to economic development, including as a factor causing its volatility. During periods of increasing sanctions pressure, less developed regions have the opportunity to increase their innovation potential, while consistent innovative development in the most developed regions was possible only in the pre-sanctions period. Innovation processes in the most developed regions are more uniform in terms of industry structure and implementation mechanisms than in the least developed regions. The role of innovation in differentiating the pace and level of economic development is higher in less developed regions than in more developed ones.
The scientific significance of the results obtained is related to the transfer of the discussion about the technology clubs of regions and the relationship between their innovative and economic development to the Russian context. The findings of the study open up wide opportunities for further research in this area in line with the mainstream analysis of regional innovative development. Here we can point to two general lines of such analysis: clarification and hierarchical analysis of the composition of technological regional clubs, and comparative analysis of their growth and development factors.
