Economic status and social well-being of north-west Russia regions’ population amid the economic crisis

Author: Gulin Konstantin Anatolevich, Dementyeva Irina Nikolaevna
Journal: Economic and Social Changes: Facts, Trends, Forecast @volnc-esc-en
Section: Development strategy
Article in issue: 4 (8) т.2, 2009.
Free access
The article under consideration observes the results of the integrated public opinion monitoring held by ITSED RAS at the territory of 10 North-West federal district subjects, since 2005. It contains information about socioeconomic status and political moods of NWFD regions' population amid the economic crisis. The article presents index analysis which enables to summarize the situation in NWFD and also to make comparative analysis of changes in public mood of NWFD population.
Monitoring, public opinion, indexes, crisis, social well-being, socioeconomic status of population
Short address: https://sciup.org/147223157
IDR: 147223157 | UDC: 332.143(470.2)
Text of the scientific article Economic status and social well-being of north-west Russia regions’ population amid the economic crisis
UDC 332.143(470.2)
Economic status and social well-being of North-West Russia regions’ population amid the economic crisis
The article under consideration observes the results of the integrated public opinion monitoring held by ITSED RAS at the territory of 10 North-West federal district subjects, since 2005.
It contains information about socioeconomic status and political moods of NWFD regions' population amid the economic crisis.
The article presents index analysis which enables to summarize the situation in NWFD and also to make comparative analysis of changes in public mood of NWFD population.
Monitoring, public opinion, indexes, crisis, social well-being, socioeconomic status of population.
Konstantin A.
GULIN
Ph.D. in History, Deputy director for Science,
Institute of Territories’ Socio-Economic Development of RAS
Irina N.
DEMENTYEVA
Research associate, social processes’ research laboratory,
Institute of Territories’ Socio-Economic Development of RAS
The high degree of Russia’s spatial heterogeneity is accompanied by differences in economic status and social well-being of the population. They are conditioned by such factors as regional socio-economic differentiation, the difference between their development “speed”, differences in social structure, standards and style of living, etc. However, inter-regional comparison of the territories’ social development levels today is actually limited to the analysis, based on official statistics.
Problems of economic situation and, moreover, social well-being of the population due to the lack of relevant information is poorly studied, there is a low level of scientific elaboration of the problem. In the practical sphere, this leads to the fact that this factor is poorly taken into account in formulating and implementing of the governmental socio-economic policies. As a result the effectiveness of social activities reduces. Thus, the need for a comprehensive study of regional features of the economic situation and population’s social well-being, especially in a period of instability associated with the effects of the Global financial crisis, is due to both scientific and practical tasks: the need to analyze and evaluate the effectiveness of social governance, expansion of long-range programs for regional development.
Since the mid 1990s Institute of Territories’ Socio-Economic Development of RAS has been monitoring public opinion on the territory of the Vologda region. Regularly once in every two months, 1500 people in cities of Vologda and Cherepovetz and the eight districts of the region are polled.
ITSED RAS monitoring studies in the Vologda region have been warmly welcomed by both academic and governmental structures. In this regard, the Economics Department Bureau of RAS number 9 (from 12.02.2002) and then the Division of Social Sciences RAS (from 18.06.2003) ITSED RAS starts spreading of established organization methods and conducting surveys in North-West federal district in general. In the period from 2005 to 2009 there were held 6 surveys for the 10 subjects of the North-West1.
Comparative analysis of monitoring data is of great scientific and practical significance. These polls can be used to analyze and evaluate the effectiveness of social control, as well as to better accommodate the interests of various groups in the formulation and implementation of the forward-looking regional development programs.
First, public opinion polls conducted in the territories of NWFD give an idea about such an important aspect of regional development, as the mood of people, their relationship to various spheres of personal and public life.
Secondly, the comparison of results of population surveys in different regions, allows to identify common socio-economic problems, as well as to determine the specificity of each administrative-territorial entity.
In order to systematize the data obtained in the course of a comprehensive monitoring conducted in the period 2005 – 2009, we used the index analysis. Similar methods of constructing indexes are used by all-Russian research centers (Levada Center, VCIOM), who carry out calculations of indexes of the Russian population’s social well-being based on the data from monthly surveys: social sentiment index (SSI), consumer sentiment index (CSI), national well-being index.
The system of general and specific indices allows to generalize the situation developing in the NWFD, as well as to provide a comparative analysis of changes in social sentiment of people living in regions of the North-West. It provides an opportunity to draw up a rating of regions depending on the ratio of residents to the subjects of federal and local executive authorities, as well as through the population's assessment of their material well-being and social attitudes. Calculation of integral indexes allows grouping the regions depending on the combination of different indicators (indexes) and tracing the dynamic changes of the situation in the region during 2005 – 2009.
Four partial indexes were calculated, each of which includes three questions in the ques-tionnaire2:
-
1. Regional authorities’ efficiency index. (How would you assess the socio-economic situation in your region? How would you assess the sociopolitical situation in the region? How do you assess the Governor’s current activity?)
-
2. Index of loyalty to the federal government’s policy. (How would you assess the socio-economic situation in Russia? How would you assess the sociopolitical situation in Russia? How do you assess the current activities of the President of Russia?)
-
3. The region’s population socio-political sentiments index. (How do you think, can mass demonstrations be held in your city (district)? What could you say about your mood in recent days? Which of the given statements match the current situation best in your opinion?)
-
4. Index of socio-economic status of the region’s population. (How would you assess your family’s financial position? Which of the estimates describes your cash income most accurately? Which category would you relate yourself to?)
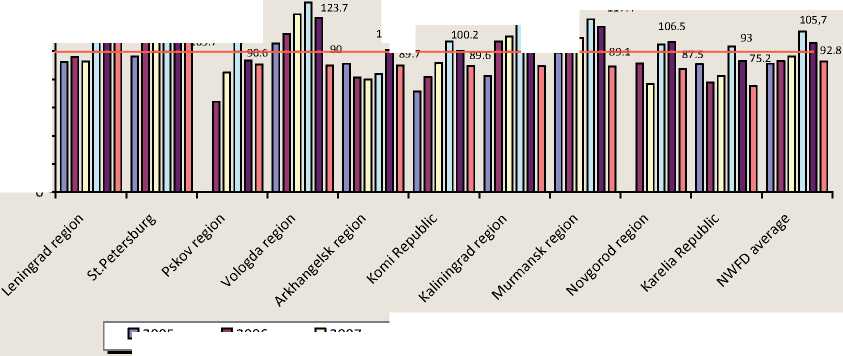
As shown by the calculations, in 2009 as a whole in the NWFD regional authorities’ efficiency index was 92.8 points (fig. 1). This is below the level in 2008 (at 12.9 points) and corresponds roughly to the average indicators of 2005 – 2007. The decrease of the index is due, primarily, to the deterioration of population’s attitude to the economic situation in the region (question: “How would you assess the economic situation in your region?”) and the political situation (question: “How would you assess the political situation in your region?”). Thus, in 2009 less than 10% of the NWFD considered socioeconomic situation of the region as “good” and “very good” (in 2008 – 12%, in 2005 – 8%). A relatively favorable situation was observed in the Leningrad region (19%), St. Petersburg (14%), the Republic of Karelia (11%). Significantly below average in the NWFD assessments of inhabitants of the Novgorod (3%), Pskov (3%), Kaliningrad (5%) regions.
The proportion of positive characteristics of the socio-political climate at the regional level in 2009 on the average in the NWFD was 49% (in 2008 – 56%; in 2005 – 45%). The highest share of positive assessments of the political situation in the region was the in Leningrad (59%) and Kaliningrad (55%) regions. Minimal values of these indexes compared with the average in the district were recorded in the Novgorod and Vologda regions, the Republic of Karelia.
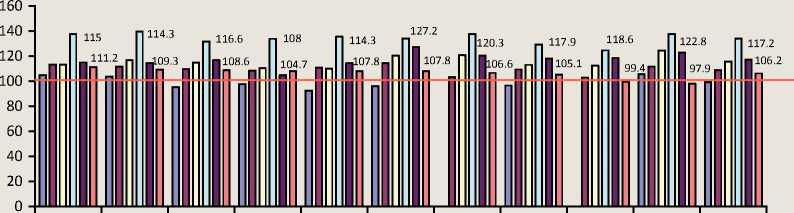
Index of loyalty to the federal government’s policy in 2009, on the average in the NWFD amounted to 106.2 points against 117.2 points in 2008 (fig. 2) . Reducing the index in the period of 2008 – 2009 is due to worsening of the district’s population relation to the socioeconomic situation in Russia (the question: “How would you assess the economic situation in Russia?”) .
According to the survey, in 2009 only 8% of the district’s population were appreciative of the current socio-economic situation in the country (in 2008 – 14%; in 2005 – 7%). The most favorable situation was observed in the Leningrad region (15%), St. Petersburg (11%), the Republic of Karelia (13%). Least representative proportion of positive ratings is in the Novgorod (4%), Pskov (5%), and Kaliningrad (4%) regions.
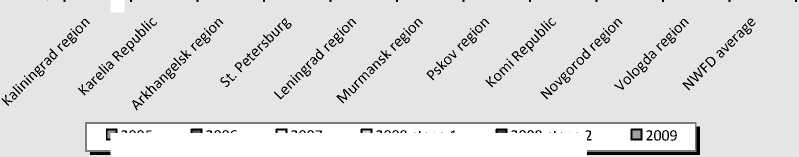
The NWFD population socio-political sentiments index settled down at 117 points (fig. 3) . Compared with 2008 this figure fell by 4.8 points. This was due to the pessimistic character of social sentiments (question: “What could you say about your mood during the last days?”) and reducing the supply of the district’s residents social patience (question: “Which of the given statements match the current situation best in your opinion?”) .
For example, in 2009 in the NWFD as a whole approximately every third person in the district (34%) had negative emotions (“stress, irritation, fear, anguish”; 30% in 2008; 39% in 2005). However in some regions
Figure 1. Regional authorities’ efficiency index (efficiency index)
112.1
117.4
100.7
113.3
89.4 _п
100.9
89.7
108.9
93.5
1 109.7 п
□ 2009
□ 2005
□ 2006
□ 2007
□ 2008 stage 1
□ 2008 stage 2
Figure 2. Index of loyalty to the federal government’s policy (loyalty index)
□ 2005 □ 2006 □ 2007 □ 2008 stage 1 □ 2008 stage 2
the proportion of negative characteristics of social mood considerably exceeded the average level. Such regions include the Novgorod (39%) and Kaliningrad (37%) regions, Komi Republic (36%), the Pskov (36%) and Vologda (36%) regions.
About 15% of the NWFD population has a low stock of social patience (14%in 2008; 23% in 2005). Residents of the Vologda (17%) and Leningrad regions (16%), of the Karelia Republic (16%) most frequently stated about “their impossibility to endure the miserable provisions”.
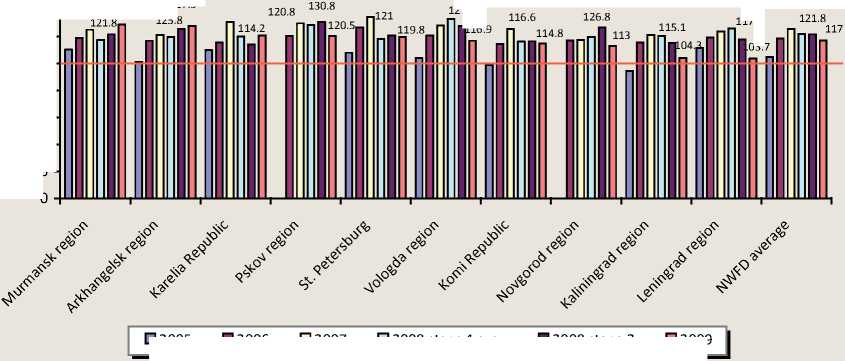
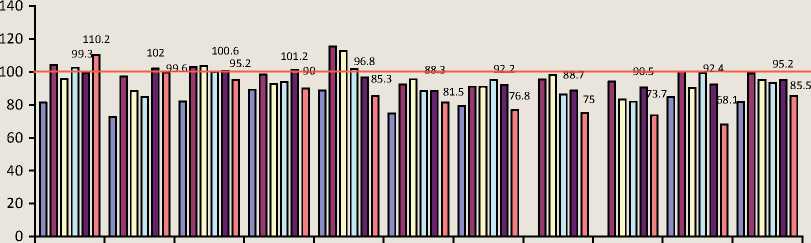
The index of socio-economic situation of the region’s inhabitants in 2009 on the average of NWFD decreased (from 95.2 to 85.5 points), representing an increase of specific weight of negative public opinions about the material conditions, income level and their own socioeconomic status (fig. 4) . Negative dynamics of well-being index is linked mainly to the deterioration of population’s purchasing power (question: “Which of the estimates describes your cash income most accurately?”) .
In general, more than 40% of the NWFD population have low income purchasing power
(“money is enough at best for food”, in 2008 this figure was 31%, in 2005 – 40%), while the representation of middle income categories (“money is enough to purchase necessary goods”) was at 46% (in 2008 – 53%, in 2005 – 47%). In the territorial aspect most unfavorable structure of the income purchasing power was observed in the Kaliningrad region (the proportion of those who “have enough money at best case for food” makes up 60%), Pskov (52%), Novgorod (49%) regions, Komi Republic (47%). The most favorable situa- tion was observed in the Leningrad (28%) and Arkhangelsk (28%) regions.
As can be seen from the above analysis, the first two indexes (regional authorities’ efficiency index and index of loyalty to the federal government’s policy) reflect the population’s estimates of the state’s managerial decisionmakers quality and effectiveness, while the latter two indexes (the regional population’s socio-political sentiments index and the index of socio-economic status of region’s population) reflect the level of social tension in society
Figure 3. The regional population’s socio-political sentiments index (stability index)
128.9
117.8
127.9
125.8
03 7
127.8
116.9
□ 2005 □ 2006 □ 2007 □ 2008 stage 1 этап □ 2008 stage 2 □ 2009
Figure 4. Index of socio-economic status of the region’s population (welfare index)
In this regard, according to the developed method the four mentioned indexes were grouped into two pairs:
– index of attitude to the authorities,
– index of social well-being as the average of the constituent indexes.
Index of attitude towards the authorities is the ratio of population’s attitude to the authorities of all levels, assessment of public authorities’ work quality.
The NWFD average rate of this index in 2009 was 99.5 points, which is 12 points lower compared with 2008 (fig. 5) . Negative dynamics is observed in all regions of NWFD (excluding St. Petersburg). The most significant deterioration in public attitudes to the authorities’ structures activities took place in the Vologda (29 points), Murmansk (24 points), and Novgorod (19 points) regions.
Residents of the Leningrad, Kaliningrad regions, and St. Petersburg assessed the authorities’ structures activities higher than the NWFD average. In other regions the indicators of the authorities’ approval is below than the NWFD average, the lowest are in the Republic of Karelia (92.3 points), the Novgorod (93.5 points), and Vologda (94 points) regions.
Second composite index – index of social well-being allows judging on personal and fam- ily well-being of the population, the nature of the region’s population identity regarding their financial situation and mental well-being. In essence, this index as a whole is representative of the life quality.
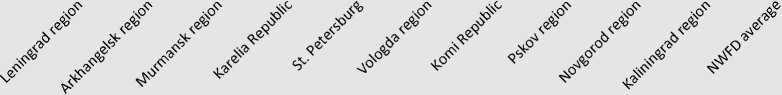
On the average in the NWFD index of the population’s social well-being has declined significantly in 2009 (from 108.5 to 101.3 points) and is close to 100 points which witnesses about the parity of positive and negative evaluations of social well-being.
The worsening of social well-being ratings in 2009 occurred in all the territories of the NWFD, with the exception of the Arkhangelsk and Murmansk regions, where the given of indicator has not changed and remained at the level of 2008.
Residents of the Arkhangelsk and Murmansk regions, Republic of Karelia, St. Petersburg and the Leningrad region assess their social wellbeing in 2009 higher than the NWFD average. In other regions the social well-being is evaluated less favorably than the average figures for the District.
The combination of the index of attitude to the authorities and the index of the population’s social well-being allows realizing the typology of the regions with the allocated four model groups.
In the first, “most prestigious” group ( А ) is composed of regions with a positive evaluation

Figure 6. Index of the population’s social well-being
□ 2005 □ 2006 □ 2007 □ 2008, stage 1 □ 2008, stage 2 □ 2009
of the authorities and social well-being. The second group ( ВI ) is composed of territories with a positive assessment of the authorities and the negative assessment of social wellbeing. The third group ( ВII ) is represented by the regions which have a negative assessment of the authorities and the positive assessment of personal well-being. The fourth, “the least prestigious” group ( С ) is constituted by the regions with the negative assessment of the authorities and negative assessment of personal well-being.
With the change in the indexes for 2005 – 2009, the regions changed their positions, moving in more or less “prestigious” group.
As it is seen from the table 1, the overall trend in the period of 2005 – 2008 is to gradually move the regions from “less prestigious” to “more prestigious” groups. If in 2005 in most NWFD regions the population’s negative evaluations of the authorities and personal well-being dominated, in 2008 all subjects of the Northwest have moved into a group with a predominance of positive opinions on the two indicators. This was aided by the political and economic activity of state at the stage of the parliamentary and presidential elections. In 2009, during the decay of the parties-and-po-litical activity and the development of financial and economic crisis the situation has changed in the direction of deteriorating position in most regions.
Only the Leningrad region and St. Petersburg remained with a positive assessment of the authorities and personal well-being in Group А in 2009. In group ВI there is the Kaliningrad region with a positive assessment of the authorities and the negative assessment of personal well-being, and in group ВII there are the Arkhangelsk, Murmansk region, Republic of Karelia with negative assessment of the authorities and the positive assessment of personal well-being. Four regions – the Pskov, Novgorod, Vologda regions and Republic of Komi shifted from group А to the lowest group С with a predominance of negative ratings on all indicators (see tabl. 1).
For further generalizations and constructing the final ranking of the NWFD regions two composite indexes (index of attitude to the authorities and index of social well-being) are combined in one integral index – Index of public sentiment in the region (IPSR).
Index of public sentiment in the region is the most common indicator of mass sentiment of society. It allows, on the one hand, assessing the dynamics of society and, on the other hand monitoring the impact of mass consciousness on the development of the region indirectly.
Table 1. Typological distribution of the NWFD regions
|
2005 |
2008 |
2009 |
||
|
А |
Positive evaluation of the authorities and personal well-being |
---------- |
Vologda region Murmansk region Leningrad region Novgorod region Komi Republic Arkhangelsk region Kaliningrad region Pskov region St. Petersburg Republic of Karelia |
Leningrad region St. Petersburg |
|
BI |
Positive evaluation of the authorities and negative evaluation of well-being |
Vologda region |
------------- |
Kaliningrad region |
|
BII |
Negative evaluation of the authorities and positive evaluation of well-being |
----------- |
------------- |
Arkhangelsk region Murmansk region Republic of Karelia |
|
С |
Negative evaluation of the authorities and of well-being |
Murmansk region Republic of Karelia St. Petersburg Kaliningrad region Arkhangelsk region Leningrad region Komi Republic |
------------- |
Pskov region Komi Republic Vologda region Novgorod region |
According to the results of the study the index of public sentiment on average in the NWFD in 2009 compared with stages 2 in 2008 fell by 10 points and established on a mark of 100.4 points, indicating a balance of positive and negative evaluations (fig. 7). The negative dynamics of the integral index is characteristic of all areas of the NWFD. The most significant decrease in this indicator happened in the Vologda (19 points), Novgorod (17 points), Kaliningrad (13 points), Murmansk (12 points), and Pskov (10 points) regions.
Above the average values in the NWFD are indexes in the Arkhangelsk (106,5 points), Leningrad (106.3 points) regions, St. Petersburg (106 points), the Murmansk region
Figure 7. Index of public sentiment in the region (IPSR)
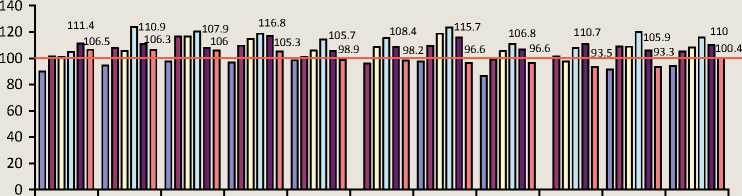
□ 2005 □ 2006 □ 2007 □ 2008, stage 1 □ 2008, stage 2 □ 2009
Table 2. Ranking of NWFD regions by the Index public sentiment in the region (IPSR)
|
Region |
2005 |
2006 |
2007 |
2008 (Stage 1) |
2008 (Stage 2) |
2009 |
|
Arkhangelsk region |
7 |
7 |
9 |
10 |
3 |
1 |
|
Leningrad region |
5 |
5 |
7 |
1 |
4 |
2 |
|
St. Petersburg |
2 |
1 |
2 |
3 |
7 |
3 |
|
Murmansk region |
4 |
2 |
3 |
5 |
1 |
4 |
|
Republic of Karelia |
1 |
8 |
6 |
7 |
10 |
5 |
|
Pskov region |
- |
10 |
5 |
6 |
6 |
6 |
|
Vologda region. |
3 |
3 |
1 |
2 |
2 |
7 |
|
Republic of Komi |
8 |
9 |
8 |
8 |
8 |
8 |
|
Novgorod region |
- |
6 |
10 |
9 |
5 |
9 |
|
Kaliningrad region |
6 |
4 |
4 |
4 |
9 |
10 |
Table 3. Some key indicators of NWFD socio-economic regional development in the 1st half of 2009
|
Region |
Industrial production Index |
Actual cash incomes |
Retail turnover |
Unemployment rate |
||||
|
As % to 1 half of 2008 |
Place |
As % to 1 half of 2008 |
Place |
As % to 1 half of 2008 |
Place |
In %* |
Place |
|
|
Republic of Karelia |
85.9 |
5 |
98.6 |
2 |
97.6 |
7 |
11.6 |
9/10 |
|
Komi Republic |
97.0 |
2 |
93.0 |
7 |
87.5 |
9 |
10.9 |
7 |
|
Arkhangelsk region |
105.2 |
1 |
101.1 |
1 |
99.1 |
2 |
6.2 |
3 |
|
Vologda region |
75.0 |
9 |
84.4 |
10 |
82.7 |
10 |
7.5 |
6 |
|
Kaliningrad |
84.1 |
7 |
95.4 |
6 |
98.4 |
4 |
11.6 |
9/10 |
|
Leningrad |
91.1 |
3 |
95.6 |
5 |
99.0 |
3 |
7.1 |
5 |
|
Murmansk region |
91.0 |
4 |
97.5 |
4 |
98.3 |
5 |
6.5 |
4 |
|
Novgorod |
71.5 |
10 |
92.3 |
9 |
104.3 |
1 |
5.6 |
2 |
|
Pskov |
84.9 |
6 |
97.7 |
3 |
98.0 |
6 |
11.2 |
8 |
|
St. Petersburg |
78.3 |
8 |
92.6 |
8 |
93.4 |
8 |
4.2 |
1 |
|
North-West federal district |
85.1 |
- |
94.2 |
- |
94.6 |
- |
6.9 |
- |
|
Russian Federation |
85.2 |
- |
100.2 |
- |
97.0 |
- |
8.5 |
- |
* The unemployment rate in % to economically active population. Source:
(105.3 points). Close to the average estimate are Republic of Karelia (98.9 points), the Pskov (98.2 points), Vologda (96.6 points) region, Komi Republic (96.6 points). In the Novgorod and Kaliningrad regions the indexes of public sentiment are significantly lower than the average for the North-West (93.5 and 93.3 points).
On the basis of the integral index the final rating of the region relative to other subjects of the North-West federal district is determined (tabl. 2) .
In 2009 by a combined index of public sentiment the Arkhangelsk region which was third at the end of 2008, took the first place .
The second was the Leningrad region (in October – November 2008 – fourth place), and the third position went to St. Petersburg located in autumn 2008 in the seventh place. Compared with the previous measurements the Murmansk, Vologda, Novgorod and Kaliningrad regions worsened their positions. The situation in the Republic of Karelia became more favorable, in the Pskov region, and the Komi Republic it has not changed significantly.
The results obtained in the survey, found confirmation in the data of the Federal state statistics service, reflecting the dynamics of socio-economic situation in the regions of
North-West (tabl. 3) . Thus, the highest rate in the first half of 2009 showed the Arkhangelsk region, which was on the leading position in terms of the index of public sentiment. The situation in the Leningrad and Murmansk regions was also relatively favorable. As for St. Petersburg, despite negative dynamics of economic indicators, there was recorded relatively low unemployment rate – significantly lower than in other NWFD regions and Russia in general.
An example of the opposite dynamic is the Vologda region, which recorded the most negative changes in industrial production and in terms of real incomes of the population. Therefore, the region’s reduction rate on the index of public sentiment from position 2 to 7 looks quite reasonable.
Thus, monitoring of public opinion is one of the most important indicators of socioeconomic development of the macro-regions. Regular sociological measurements made by ITSED RAS in the North-West federal district, as well as analysis of their results allow us to create a picture of wealth and social well-being of the population, to trace the dynamic changes in the socio-economic status of people in different areas of the North-West. The study can be used for analysis and evaluation of social administration’s effectiveness, as well as for the development of future regional development programs.
