Edge Detection of Medical Images Using Modified Ant Colony Optimization Algorithm based on Weighted Heuristics

Author: Puneet Rai
Journal: International Journal of Image, Graphics and Signal Processing(IJIGSP) @ijigsp
Article in issue: 3 vol.6, 2014.
Free access
Ant Colony Optimization (ACO) is nature inspired algorithm based on foraging behavior of ants. The algorithm is based on the fact how ants deposit pheromone while searching for food. ACO generates a pheromone matrix which gives the edge information present at each pixel position of image, formed by ants dispatched on image. The movement of ants depends on local variance of image's intensity value. This paper proposes an improved method based on heuristic which assigns weight to the neighborhood. Thus by assigning the weights or priority to the neighboring pixels, the ant decides in which direction it can move. The method is applied on Medical images and experimental results are provided to support the superior performance of the proposed approach and the existing method.
Ant Colony Optimization, Weighted Heuristics, Edge Detection, Pheromone
Short address: https://sciup.org/15013267
IDR: 15013267
Text of the scientific article Edge Detection of Medical Images Using Modified Ant Colony Optimization Algorithm based on Weighted Heuristics
Published Online February 2014 in MECS
Detection of edges in an image is a very important step for the image understanding. Indeed, high-level processing tasks such as image segmentation and object recognition, etc. directly depend on the quality of the edges detected.
It is a pre-processing step in applications of image segmentation and computer vision particularly in the areas of feature detection and feature extraction. Edges represent important contour features in the corresponding image as they refers to the process of detecting points in a digital image at which the image brightness changes sharply, or more formally has discontinuities [1].
Recently natural swarm inspired algorithms like Particle Swarm Optimization (PSO) [2][3], Ant Colony Optimization (ACO) have found their way into this domain.
Proposed by Italian Scholar M.Dorigo et al [4] [5], Ant Colony Optimization is inspired by natural behavior of ants that they deposit pheromone to give signal to other ants so that they follow some preferable path to reach the source of food. The pheromone trails evaporate with time. On a longer path pheromone has more time to evaporate, thus shorter paths are favored as they acts as compensation for pheromone evaporation. Ants follow shorter paths because the density of pheromone is higher on shorter paths. Many ACO algorithms have been developed [6], to name a few max-min ant system [7], ant colony system [8], etc.
In this paper, we propose ACO algorithm which works on weighted heuristics. The proposed approach exploits a number of ants, which moves on the image based on local variation of intensities of neighbouring pixels assigned with weight.
The paper is organized as follows. In section II fundamental concepts of ACO are provided. Then an ACO based approach with weighted heuristic is proposed in section III. Experimental results are presented in section IV. Finally section V concludes the paper.
-
II. ANT COLONY OPTIMIZATION
ACO is a probabilistic method that aims to find the optimized solution of target problem through a guided search over the solution space by constructing the pheromone information.
In an ACO algorithm, ants move through a search space, the graph, which consists of nodes and edges. The movement of the ants is probabilistically dictated by the transition probabilities, which reflects the likelihood that an ant will move from a given node to another.
This value is influenced by the heuristic information and the pheromone information of the node to which ant wants to move.
The heuristic information is solely dependent on the instance of the problem. Pheromone values are used and updated during the search. The algorithm consists of three main steps. The first is the initialization process. The second is the iterative construction-and-update process, where the goal is to construct the final pheromone matrix, each element of which corresponds to a pixel of image and the values of this matrix give the edge information of a particular pixel. The construction-and-update process is performed several times, once per iteration. The final step is the decision process, where the edges are identified based on the final pheromone values, it is calculated using threshold values.
According to the ant system [4], suppose K ants are used to find the optimal solution in a problem space of M1 × M2 Nodes. Then the three steps will be applied as discussed in section 3.
improves the results in significant way as it covers a greater area to calculate the transition probability. By this, ants can view the transition in intensity at a large area, and thus ant can decide in which direction it should move, as it covers a larger area so the results are improved significantly It is given by
-
III. PROPOSED ACO ALGORITHM
We propose two modifications to the existing ACO technique. First the heuristic information which is used to determine the probability using which ants move from one pixel to another [9][10][11].
In the proposed method we have assigned weights to the pixels for calculating the heuristic value. As the ant moves farther the weight is reduced. This gives additional information about the neighbourhood by
vc ( h , j )=2×|^i-1 ,7-1 - A+i,7 + 1|+|A-2,7—2 - ^i+2 ,7+2 | +2×| h-1 , i - ^+i , i |+| h-2 , i - h+2 , i |
+2 ×| k-i ,7 + 1 - h+i , j-i |+ | k-2 , j+2 - k+2 , j~2 | +2×| h , - h ,7 + 1|+| h , j-2 - h , i*2 | (2)
Нпах is the maximum intensity variation in the whole image and serves as normalization factor.
increasing the farsightedness, to calculate transition probability.
Second we have assigned the initial pheromone matrix by the value 1⁄ ․ Till now no standard method has been explained to initialize the pheromone matrix. This will allow the ants to explore other pixels that may be considered as edge pixels.A m × n 2-D image can be represented as 2-D matrix with the image pixels as its elements (Fig. 1).
A. Initialization Process
Artificial ants are distributed over the image, they
i-2,j-2
•
i-1,j-2
i,j-2
i+1, j-2
i+2, j-2
•
i-2,j-1
i-1, j-1
i, j-1
i+1, j-1
i+2,j-1
i-2,j
i-1, j
i, j
i+1, j
i+2,j
i-2,j+1
i- , j+1
i, j+1
1 1x
i+1, j+1
i+2,j+1
i-2,j+2
i-1,j+2
i,j+2
•
i+1,j+2
i+2,j+2
move from one pixel to another using the transition probability which depends on local intensity variation.
The initial value of each element in the pheromone
matrix is set to a constant
M1 × M2 is the size of image.
given by 1⁄ (M . M2 )
where
f(0,0)
f(1,0)
f(2,0)
f(m-1,0)
f(0,1)
f(1,1)
f(2,1)
f(m-1,1)
f(0,2)
f(1,2)
f(2,2)
f(m-1,2)
.
.
.
.
.
.
.
.
.
.
.
.
f(0,n-1)
f(1,n-1)
f(2,n-1)
f(m-1,n-1)
Figure 1. Matrix representation of digital image
The heuristic value at pixel (i, j) is determined by local statistics at that pixel:
ki , =
Vc ( к , 1 ) ^max
Where , the intensity value at pixel is ( i , j ), and Vc ( , ) is a function that operates on the local group of pixels around the pixel ( i , j ) . The proposed method assigns weight to the pixels in neighborhood of the pixel(i, j ) , to calculate the value of Vc ( , ) , this
B. Iterative construction and update Process
At the n-th construction step, the k-th ant moves from node i to node j with transition probability
(n ) = ( ( , 12 )) ( , i ) , ∈ Ω i (3) ( , ),( , ) ∑ ( , ; ) ∈ n( , , ) ( ( , Г )) ( m , "j ) , ∈ Ω (3)
Where, T ( ) is the pheromone value for the pixel ( i , j ) , Ω ( , ) is the neighborhood pixels of pixel( Lq , jo ), , is the heuristic information at the pixel (i, j ). The constants a and p control the influence of the pheromone and the heuristic information, respectively.
Now as the ants move from one node to another node, the pheromone value at each pixel is updated both locally and globally. The goal of the pheromone update is to increase the pheromone values associated with good solutions and decrease those associated with bad ones. This is normally done by decreasing all the pheromone values (evaporation) and increasing the pheromone values associated with the good solutions (deposit). Pheromone evaporation implements a form of forgetting, which prevents premature convergence to sub-optimal solutions and favors the exploration of new areas in the image.
Each time an ant uses an edge to move from one node to another, it removes some pheromone from that edge to increase the exploration of other areas. The process of removing pheromones from edges as they are crossed is called local pheromone update. The local update
counterbalances the effect of the greedy decision rule, which favors the exploitation of the pheromone information.
The amount of pheromone on the node (i, j) on the nth iteration, τ( ■ ) , is updated locally according to following equation.
(, " ) = (1 - ф )․ т (, г1 )+ ф ․ ^init (4)
Where φ ∈ (0,1] is the pheromone decay coefficient; τ init is the initial pheromone value.
After all the ants finish the construction process, global pheromone update is performed on pixels that have been visited by at least one ant:
-
1 (, ;) = (1 - р )․ Т ( , г )+ р ․∑ к=1 ∆Т ( , ;) (5)
Where Δτ( ■ ) is the amount of pheromone deposited by the kth ant on pixel (i, j), ρ ∈ (0,1] is the pheromone evaporation constant. The deposited amount of pheromone Δτ( ■ ) is equal to the average of the heuristic information associated with the pixels that belong to the tour of the kth ant if pixel (i, j) was visited by the kth ant in its current tour; 0 otherwise.
-
C. Decision Process
Pheromone matrix is used for decision making that which pixel is to be considered as edge pixel by using Ostu method of thresholding [12].
The initial threshold T(0) is selected as the mean value of the pheromone matrix. Next, the entries of the pheromone matrix is classified into two categories according to the criterion that its value is lower than T(0) or larger than T(0). Then the new threshold is computed as the average of two mean values of each of above two categories. The above process is repeated until the threshold value does not change any more (in terms of a user-defined tolerance ϵ).
-
IV. EXPERIMENTAL RESULTS
Experiments are conducted based on some test images. The size of images is 256 × 256. The results are compared with existing ACO method. Parameters used for experiments are summarized in following table.
TABLE 1. PARAMETERS USED IN EXPERIMENT
Parameter
: Initial pheromone value
N: No. of Iterations
-
L: No. of construction steps
K: No. of Ants
α: Controls influence of pheromone trail β:controls influence of heuristic information
φ:Pheromone decay coefficient
ρ:Pheromone evaporation coefficient
TABLE 2. VALUES USED IN EXPERIMENT
|
Parameter |
Value |
|
^init |
1⁄( MYM2 ) |
|
N |
1-10 (Variable) |
|
L |
40 |
|
K |
512 |
|
α |
1 |
|
β |
1 |
|
φ |
0.05 |
|
ρ |
0.1 |
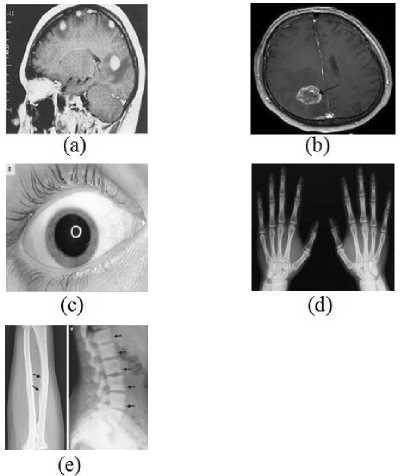
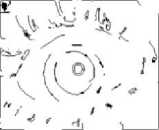
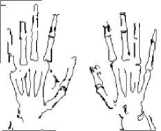
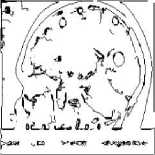
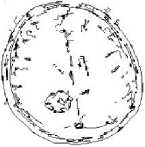
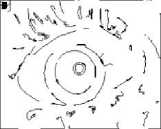
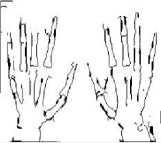
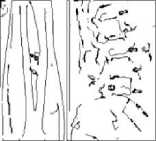
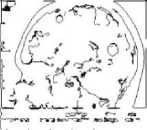
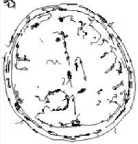
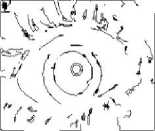
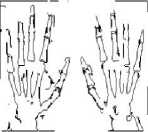
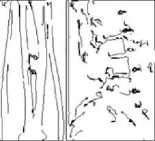
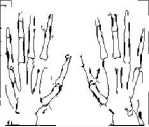
Figure 2. Test images used in this paper (a) Brain (b) Tumor (c) Eye (d) Hand (e) Bone
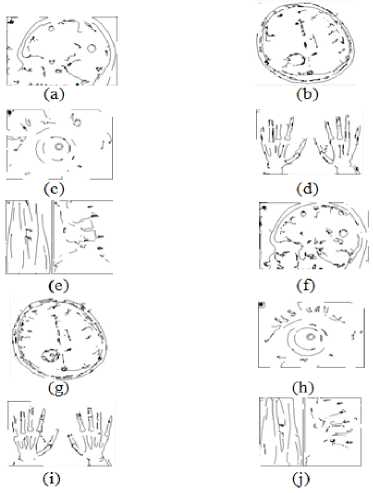
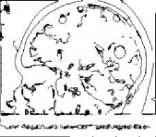
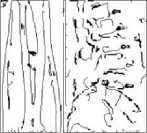
Figure 3. (a)-(e) Results of Existing ACO, (f)-(j) Results of Proposed Method at 0.035 threshold value
(a)
(b)
(d)
(c)
(f)
(e)
(g)
(i)
(h)
(j)
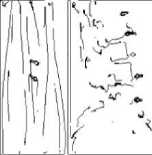
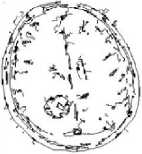
Figure 4. (a)-(e) Results of Existing ACO, (f)-(j) Results of Proposed Method at 0.025 threshold value
-
V. CONCLUSIONS
This paper presents a modified and improved ACO based method. We have defined the heuristic function that is calculated by assigning weights and priorities based on edginess of pixels. A neighbourhood of 25 pixels have been taken so as to increase the farsightedness of the ants to support better decision making. By this and can take decision in which direction it should move, if intensity in its local neighbourhood of 8 pixels is not changing then it will see beyond those 8 neighbours, if intensity changes then ant will move to that particular direction. The priority of close neighbours is high and those of far is low.
The experimental results show that the proposed technique gives better performance as compared to existing ACO algorithms. Fig 3 to Fig 5 shows the results of existing and proposed ACO method.
(a)
(c)
(b)
(d)
(e)
(f)
(g)
(i)
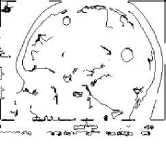
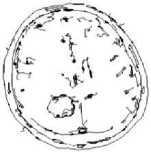
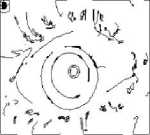
Figure 5. (a)-(e) Results of Existing ACO, (f)-(j) Results of Proposed Method at 0.015 threshold value
(h)
(j)
Table 3 and Table 4 show the comparative analysis of the proposed method with existing ACO method at different threshold values. Further the results in [9][10] and [11] gives edges which are thick, non-continuous and with less clear image content. But the proposed method gives thin and clear edges.
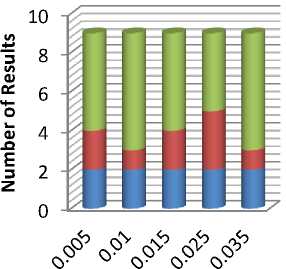
Fig 6 shows the comparison of existing and proposed method on the basis of number of results, Fig 7 to Fig 9 shows the comparison of existing and proposed method on the basis of Accuracy, Sensitivity and Specificity.
Because the quality of edge varies with the values and parameters used for extracting the heuristic values so this research can be further extended on a strategy for calculating more effective heuristic information
TABLE 3. RESULTS OF PROPOSED METHOD IN COMPARISON TO STANDARD METHOD
|
Threshold Value |
better |
% |
Same |
% |
Poor |
% |
|
0.005 |
05 |
56 |
02 |
22 |
02 |
22 |
|
0.01 |
06 |
67 |
01 |
11 |
02 |
22 |
|
0.015 |
05 |
56 |
02 |
22 |
02 |
22 |
|
0.025 |
04 |
44 |
03 |
33 |
02 |
22 |
|
0.035 |
06 |
67 |
01 |
11 |
02 |
22 |
|
Overall |
26 |
58 |
09 |
20 |
10 |
22 |
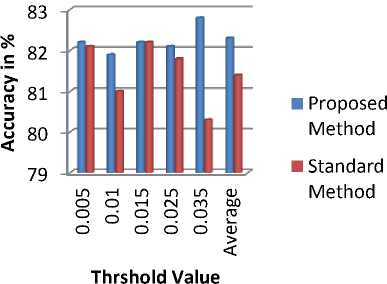
Figure 7. Comparison of Accuracy of Proposed and Standard Method
TABLE 4. COMPARISON OF PROPOSED METHOD AND STANDARD METHOD ON THE BASIS OF ACCURACY, SENSITIVITY AND SPECIFICITY
|
Thres hold Value |
For Proposed Method |
For standard Method |
||||
|
Avg Accur acy (%) |
Avg sensiti vity (%) |
Avg specifi city (%) |
Avg Accur acy (%) |
Avg sens itivi ty (%) |
Avg specifi city (%) |
|
|
0.005 |
82.2 |
38.2 |
87.6 |
82.1 |
37.1 |
87.1 |
|
0.01 |
81.9 |
37.3 |
87.2 |
81.0 |
38.8 |
86.5 |
|
0.015 |
82.2 |
43 |
87.4 |
82.2 |
34.5 |
87.2 |
|
0.025 |
82.1 |
45.1 |
87.5 |
81.8 |
42.7 |
86.6 |
|
0.035 |
82.8 |
45.4 |
87.7 |
80.3 |
32.7 |
85.6 |
|
Avera ge |
82.3 |
41.8 |
87.5 |
81.4 |
37.1 |
86.6 |
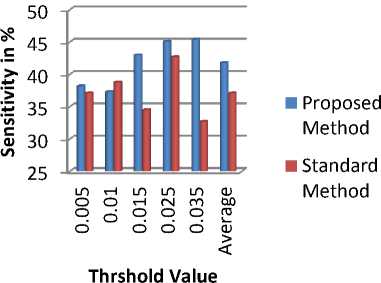
Figure 8. Comparison of Sensitivity of Proposed and Standard Method
-
■ Better
-
■ Same
-
■ Poor
Threshold Value
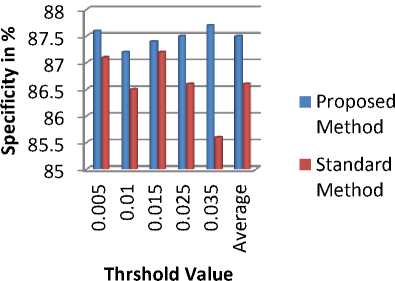
Figure 9. Comparison of Specificity of Proposed and Standard Method
Figure 6. Results of Proposed method in comparison to Standard Method
References Edge Detection of Medical Images Using Modified Ant Colony Optimization Algorithm based on Weighted Heuristics
- S.Nagabhushana, "Computer vision and image processing", New Age International, pp 86-90, 2006.
- R. C. Eberhart and J. Kennedy, "A new optimizer using particle swarm theory", Proceedings of International conference on Micro Machine and Human science, Japan, pp. 39-43, 1995.
- J. Kennedy and R. C. Eberhart, "Particle swarm optimization", Proceedings of IEEE International Conference on Neural Networks, Piscataway, NJ, pp.1942-1948, 1995.
- M. Dorigo, V. Maniezzo, and A. Colorni, "Ant System: Optimization by a Colony of Cooperating Agents," IEEE Transactions on Systems, Man and Cybernetics, Part B, vol. 26, pp. 29-41, 1996.
- M. Dorigo and T. Stützle, Ant Colony Optimization, Cambridge: MIT Press, 2004.
- M. Dorigo, M. Birattari, and T. Stutzle, "Ant colony optimization,"IEEE Computational Intelligence Magazine, vol. 1, pp. 28–39, Nov.2006.
- T. Stutzle and H. Holger H, "Max-Min ant system," Future Generation Computer Systems, vol. 16, pp. 889–914,Jun. 2000.
- M. Dorigo and L. M. Gambardella, "Ant colony system: A cooperative learning approach to the traveling salesman problem," IEEE Trans. On Evolutionary Computation, vol. 1, pp. 53–66, Apr. 1997.
- R. Rajeshwari et.al., "A Modified Ant Colony Optimization Based Approach for Image Edge Detection.",Proceedings of International Conference on Image Information Processing (ICIIP 2011.).
- Peng Xiao, Jun Li and Jian-Ping Li, "An improved Ant colony Optimization Algorithm for Image Extracting", International Conference on Apperceiving Computing and Intelligence Analysis (ICACIA), 2010.
- Jing Tian, Weiyu Yu, and Shengli Xie, "An Ant Colony Optimization Algorithm For Image Edge Detection",IEEE Congress on Evolutionary Computation, 2008. CEC 2008. (IEEE World Congress on Computational Intelligence).
- N. Otsu, A Threshold Selection Method from Gray-level Histograms, IEEE Transactions on Systems, Man and Cybernetics, vol. 9, no. 1, pp. 62-66, 1979.
