Edge Detection Operators: Peak Signal to Noise Ratio Based Comparison

Автор: D. Poobathy, R. Manicka Chezian
Журнал: International Journal of Image, Graphics and Signal Processing(IJIGSP) @ijigsp
Статья в выпуске: 10 vol.6, 2014 года.
Бесплатный доступ
Edge detection is the vital task in digital image processing. It makes the image segmentation and pattern recognition more comfort. It also helps for object detection. There are many edge detectors available for pre-processing in computer vision. But, Canny, Sobel, Laplacian of Gaussian (LoG), Robert’s and Prewitt are most applied algorithms. This paper compares each of these operators by the manner of checking Peak signal to Noise Ratio (PSNR) and Mean Squared Error (MSE) of resultant image. It evaluates the performance of each algorithm with Matlab and Java. The set of four universally standardized test images are used for the experimentation. The PSNR and MSE results are numeric values, based on that, performance of algorithms identified. The time required for each algorithm to detect edges is also documented. After the Experimentation, Canny operator found as the best among others in edge detection accuracy.
Canny operator, Edge Detectors, Laplacian of Gaussian, MSE, PSNR, Sobel operator
Короткий адрес: https://sciup.org/15013440
IDR: 15013440
Текст научной статьи Edge Detection Operators: Peak Signal to Noise Ratio Based Comparison
Edge is the property of high intensity pixel and its immediate neighborhood in the images. So, the shape of the image object is decided by its edges. Edges are used in image analysis for discovering region boundaries. Brightness of image is the major property to compute its edges. In some cases, Image gradient function also applied to calculate. The edge detector eliminates discontinued or independent pixels. Beginning of identical intensity valued pixels was marked for results. If a finder has capable of detect edges without discontinuity, then it succeeds.
A line may be viewed as an edge segment, in which the intensity of the background on either side of the line is either much higher or much lower than the intensity of the line pixels. The duty of edge detectors is to determine and effectively acquire the line which is in the exact location of the image edge. An edge detection algorithm consists of sequence of steps to get a digital image, calculate intensity, highlight border of regions [1]. Moreover, each algorithm having its own specified approach to detection, so results may vary when plotting the lines. The notable edge detectors are Sobel, Canny, Laplacian of Gaussian, Prewitt, and Roberts. These edge detection operators are unique in the manner of derivatives, localization, and magnitude. Comparing these said operators on the basis of accuracy in results, edge continuity, noise level, edge relevancy, processing time etc. In noise level, two metric standards are universally followed, Mean Squared Error (MSE), and Peak Signal to Noise Ratio (PSNR).
Normally, The Mean Square Error (MSE) and the Peak Signal to Noise Ratio (PSNR) are used in Image Compression. But, here it is used to compare image edge detection quality. The MSE represents the cumulative squared error between the edge detected and the original image, and PSNR represents a measure of the peak error [2]. Compare edge detection operators with common image, if an operator gives resultant image with less PSNR and high MSE, then come to the conclusion that, operator has high edge detection capability. This paper experiments edge detection of images with the Peak Signal to Noise Ratio.
This paper proposes an effective comparison of eminent edge detection operators based on the PSNR and MSE. The approach results ranks of analyzed operators by capability of producing accurate edges to determine object boundaries.
-
II. Edge Detectors
Edge detection is the significant process in computer vision and image processing, so it is essential to consider the edge detection operators [3], [4]. An edge is a rapid change in the pixel intensity of the image. It comprises the critical characteristics and important features of an image. Such rapid changes are detected by using first and second order derivatives. An edge is a boundary between the object and its background. The goal of every detector is to avoid false edges and detected edges should closest to true edges [5]. It plots continuous points on the edges of the virtual boundary between two objects. Segmentation done based on this operation, which makes separate identical boundaries.
The edge is established by the sequence of activities, they called in a combined form i.e. Edge Model. A method to justify edges of image content noted as edge detectors. The Fig. 1 exposes three stages of edge detection and transformation, first part shows the ideal edge image with two entirely different intensity valued regions. When we convert it into histogram, attain shown line (looks like digital wave), the successor stage modeled sloping surface between two regions, final stage modeled by the thickness and sharpness properties, it flows on the base pixel value [6].
||=√ +
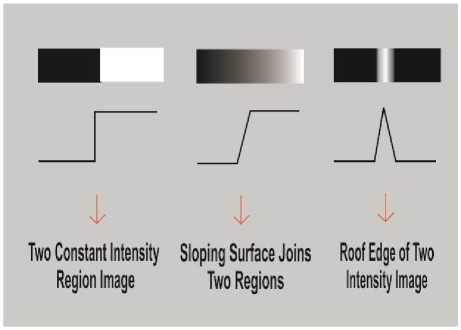
Fig. 1 Edge transforming Model
These basic model used in most of the well-known edge detection algorithms, but with some additional unique tasks. Even though each algorithm results on same image, they provided uncommon results. One effective way to compare these algorithms is as used in image compression techniques. This paper compares five famous edge detection operators based on the PSNR.
A. Sobel operator
This gradient based operator has two convolution 3X3 matrices (kernels), one estimate gradient x axis i.e. rows and another one evaluates y axis slop, which are columns [7]. This algorithm based on first derivative convolution, analyses derivatives and computes the gradient of the image intensity at every point, and then it gives the direction to increase the image intensity at each point from light to dark. It plots the edges at the points where the gradient is highest.
Where, |G| denotes gradient and G ,G are particular gradient magnitude of image.
-
B. Canny operator
The eminent algorithm uses four major processes to achieve virtual boundary of a digital image. Smoothing, derivation, maxima finding, and thresholding are those operations. First process makes the image smooth for performing successive second task derivative of Gaussian; third process is to get maxima after derivation. Final task of canny operator is hysteresis thresholding. The accomplishment of this Gaussian-based operator is why because of its low error rate and well localization of edge points. In addition to that, it provides solo edges. To attain the said feature, smoothing is done. Two level thresholding are followed in this approach, the weak edges are included in the edge map only if it is connected with strong edge lines.
-
C. Laplacian of Gaussian (LoG)
It looks for zero crossings in the second derivative after filtering f(x, y) with the Laplacian of Gaussian filter [8], [9]. The first process is convolving the image by LoG that involves two operations, smoothing and computes Laplacian (highlights rapid intensity changes), which gives two edge lines; from that first derivative, to find the zero crossings. The LoG is also known as Mexican hat operator.
G.
-1 0+1
= -2 0 +2=
-1 0+1
+1
+2
+1
)
-1
-2
-1
Fig. 2 Sobel Convolution Masks
The Fig. 2 shows two matrices and , where G is gradient, x and y are horizontal and vertical mask axis respectively. These and are combined to find the gradient at each point.
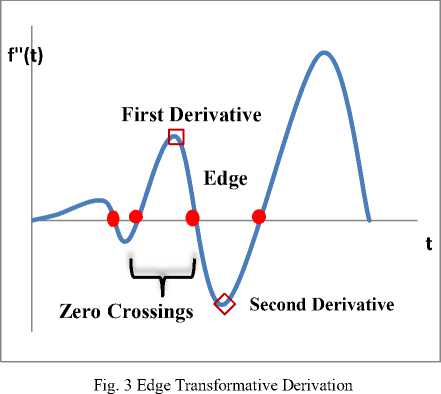
The Fig. 3 shows second derivative of image that has derived from the original image by the first derivative. The first derivative provides highest edge pixels, when transposing it to second derivative, all those extremes become zeros. It is much easier to find zeros than other highest values.
D. Prewitt operator
The Prewitt operator is like sobel, gradient based operator which estimates first derivative. It uses 3x3
masks for find the peak gradient magnitude. When the highest magnitude found, then it works on that direction. Edges are detected by the way of either horizontally or vertically or combining both angles.
MSE is to find fof the edge detected image with f input image.
^M^[Ii(m,n)-I2(m,n)]
MSE —-------—— ------
M,N
—(•
-1
-1
) t-(
-
)
Fig. 4 Prewitt Convolution Masks
The Fig. 4 shows the 3 x 3 kernels of Prewitt operator, it uses first derivative to find gradient.
E. Robert’s cross operator
The simple approximation to gradient magnitude based operator provides 2x2 neighborhood of the current pixel. Its convolution masks are,
-< -1) НД 0)
Fig. 5 Robert’s Convolution Masks
The Fig. 5 shows two matrices Gx and Gy, where G is gradient, x and y are horizontal and vertical mask axis.
-
III. Methodology
The performance evaluation of edge detections algorithms are accomplished by detection of true edges, processing time, error ratio, and noise level etc. here, the paper compares five famous edge detectors with the MSE and PSNR.
First, edge detection of test images is performed by applying all selected algorithms using Matlab software. The second stage is to calculate PSNR and MSE between each resultant edge detected image and ground truth image using java program.
-
A. Mean Squared Error
The MSE incorporates degradation function and statistical characteristics of noise in the edge detected image. It measures the average squared difference between the estimator and the parameter. MSE specifies the average difference of the pixels throughout the original ground truth image with edge detected image. The higher MSE indicates a greater difference between the original and processed image [10]. The objective of
Where, I1 is original image, I2 is edge detected image, m and n are height and width of the image respectively. The MSE should be less, when you processing with image restoration, reconstruction and compression. But, in terms of image edge detection, the Mean Squared Error could be higher to ensure it found more edge points on the image and also it capable of detect weak edge points.
B. Peak Signal to Noise Ratio
Peak signal-to-noise ratio, is ratio between the maximum possible power of a signal and the power of corrupting noise that affects the fidelity of its representation. The PSNR usually expressed in terms of the decibel (dB) scale. PSNR is a rough estimation to human perception of reconstruction quality [11]. Although a higher PSNR generally indicates that the reconstruction is of higher quality in image compression. But in some cases like edge detection PSNR should lesser to achieve proper results. The PSNR calculated based on the MSE by,
PSNR — 10 log,0 (-£-) (3)
R is the maximal variation in the input image data. If it has an 8-bit unsigned integer data type, R is 255.
IV. Experiment
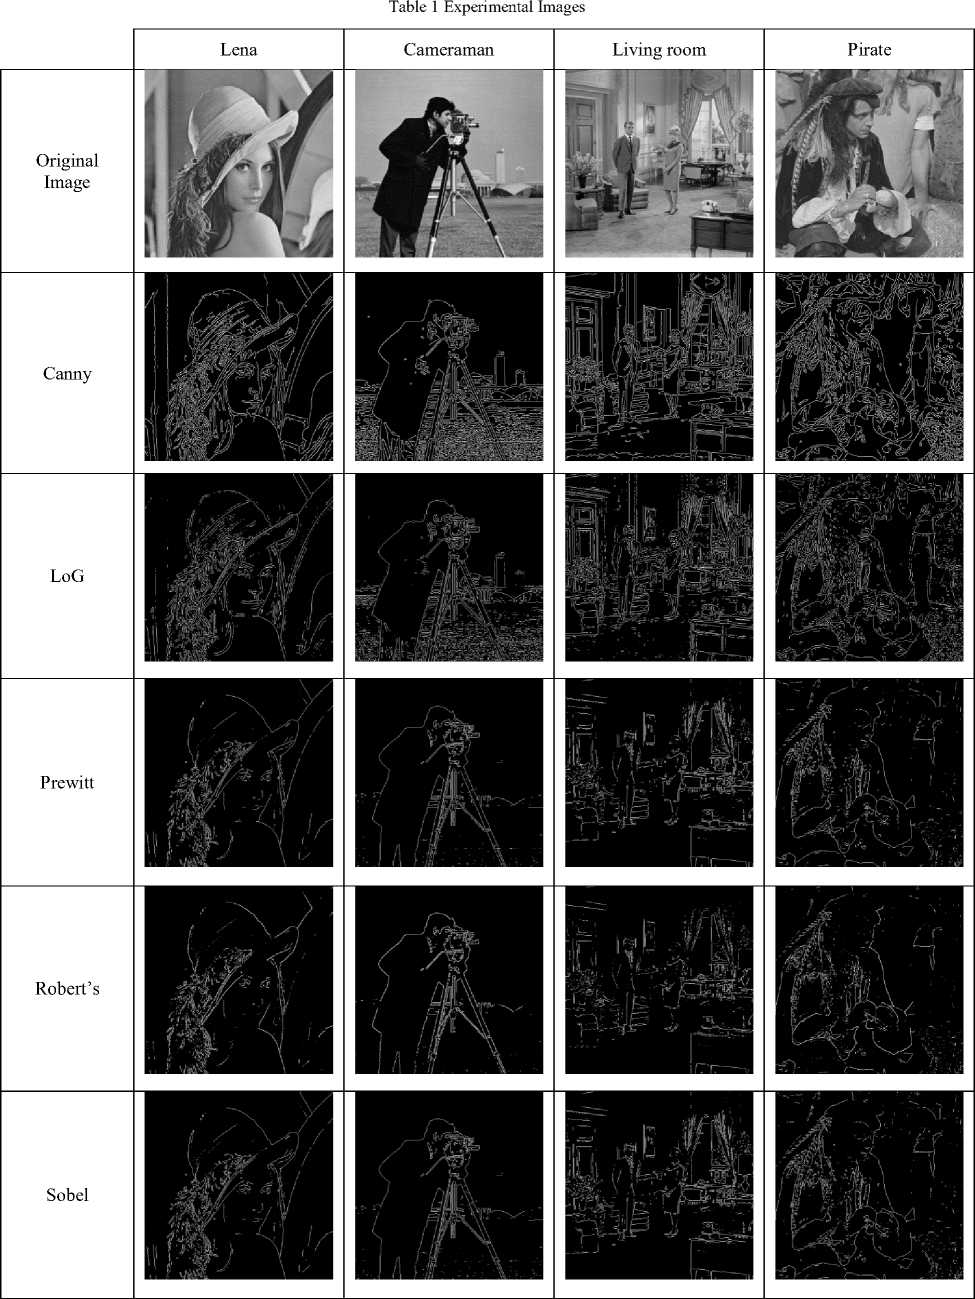
The experiment is done to compare five edge detection algorithms such as Sobel, Canny, Laplacian of Gaussian, Prewitt, and Robert’s. The test is based on the performance of operators with MSE and PSNR, to make comfortable, Signal to Noise Ratio (SNR) also computed. The test images taken for analysis are Lena, Cameraman, Living room, and Pirate. All images are TIFF format and similar resolution of 512 x 512. These benchmark images are globally accepted for the image processing.
The table 1 shows the gray scale images and corresponding experimental resultant edge detected images. All four types of images are included for each algorithm, and resultant images are added to the table. Matlab 8.1 is used for experiment. Matlab is a high-level language and interactive environment for numerical computations, visualization, and programming.
-
V. Results And Discussions
The numeric results shown in table 2 to table 5 are the outcomes from the java program which is specially developed to compute PSNR and MSE of ground truth and edge detected images. The MSE ranges from 19000 to 23000, SNR in negative value ranges -0.5 to -1.8 and PSNR range starts from 4.4 dB to 5.25 dB common for all four images.
The canny operator can bring its efficiency with high rate in MSE i.e. 21326. Robert’s algorithm provides least range of Mean Squared Error in the lena.tiff image of 19373. At the same time, cameraman.tiff contains various edge complexities that chances for false edges. When other operators avoid convoluted edges, canny detects those weak edges.
The PSNR should be low in decibel for effective edge detected image, so canny gives very less ratio of 4.850 dB in average of four test images. On the other hand, Robert’s operator gives highest noise of 4.897 dB. So canny reduces 0.990 dB noises compared to Robert’s.
When looking at processing time Prewitt operator give much better performance than others. But canny operator takes 1.22 times higher than Prewitt operator. So canny is more time consuming operator among other four operators.
|
Lena |
Canny |
LoG |
Prewitt |
Robert’s |
Sobel |
|
|
MSE |
19564.44293975 |
19538.92001342 |
19427.18265533 |
19373.81414794 |
19422.80800247 |
|
|
SNR |
-0.59106056 |
-0.58539124 |
-0.56048393 |
-0.54853699 |
-0.55950587 |
|
|
PSNR (dB) |
5.21612874 |
5.22179805 |
5.24670537 |
5.25865231 |
5.24768343 |
|
|
Processing Time |
3941154283 Nano sec. |
4072777650 Nano sec. |
3374125298 Nano sec. |
2965318990 Nano sec. |
2967196367 Nano sec. |
|
Cameraman |
Canny |
LoG |
Prewitt |
Robert’s |
Sobel |
|
|
MSE |
23262.57610321 |
23064.17021560 |
22603.89972305 |
22526.70971679 |
22613.86853790 |
|
|
SNR |
-1.26940229 |
-1.23220257 |
-1.14465794 |
-1.12980185 |
-1.14657285 |
|
|
PSNR (dB) |
4.46422553 |
4.50142526 |
4.58896988 |
4.60382598 |
4.58705497 |
|
|
Processing Time |
3260694955 Nano sec. |
2270853317 Nano sec. |
2252765069 Nano sec. |
2238890868 Nano sec. |
2236832595 Nano sec. |
|
Living room |
Canny |
LoG |
Prewitt |
Robert’s |
Sobel |
|
|
MSE |
20626.18825531 |
20519.42908859 |
20485.98234939 |
20392.03578567 |
20472.67977905 |
|
|
SNR |
-1.19427520 |
-1.17173816 |
-1.16465337 |
-1.14469127 |
-1.16183236 |
|
|
PSNR (dB) |
4.98661383 |
5.00915087 |
5.01623566 |
5.03619776 |
5.01905667 |
|
|
Processing Time |
3196653309 Nano sec. |
3015899116 Nano sec. |
2979721336 Nano sec. |
3099201623 Nano sec. |
2981460154 Nano sec. |
|
Pirate |
Canny |
LoG |
Prewitt |
Robert’s |
Sobel |
|
|
MSE |
21851.26329803 |
21928.85031509 |
22050.58388900 |
22073.71230316 |
22055.40818405 |
|
|
SNR |
-1.72185492 |
-1.73724805 |
-1.76129035 |
-1.76584319 |
-1.76224041 |
|
|
PSNR (dB) |
4.73603810 |
4.72064497 |
4.69660266 |
4.69204982 |
4.69565261 |
|
|
Processing Time |
3938181698 Nano sec. |
4008789887 Nano sec. |
3053842657 Nano sec. |
3949125651 Nano sec. |
3976200078 Nano sec. |
PSNR
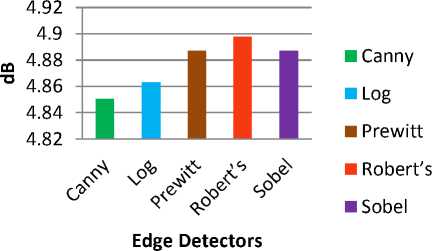
Fig. 6 Average PSNR of Edge detectors
MSE
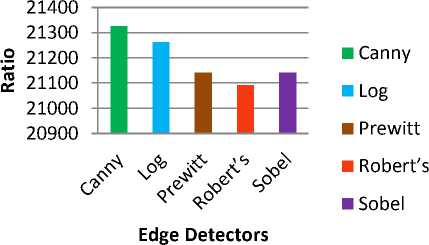
Fig. 7 Average MSE of Edge detectors
-
VI. Conclusion
This paper discussed prominent five edge detectors and its performance based on Mean Squared Error, Peak Signal to Noise Ratio, and Processing Time needed for each image to detect edges. The edge operators are Sobel, Canny, Laplacian of Gaussian, Prewitt, and Robert’s. There are four universally standard test images are used for experiment. Matlab used for edge detection, and Java used for PSNR, MSE calculation. After the experiments, come to the conclusion that canny edge detection algorithm provides good performance than others. In next stages, LoG, Prewitt, Sobel and Robert’s are ranked. At the same time, comparatively canny takes some more time for processing.
Список литературы Edge Detection Operators: Peak Signal to Noise Ratio Based Comparison
- Poobathy D and R. Manicka Chezian, “Recognizing and Mining Various Objects from Digital Images”, Proceedings of 2nd International Conference on Computer Applications and Information Technology (CAIT 2013), pp. 89-93, 2013.
- G.Padmavathi, P.Subashini, and P.K.Lavanya, “Performance evaluation of the various edge detectors and filters for the noisy IR images”, Sensors, Signals, Visualization, Imaging, Simulation and Materials, pp. 199 – 203.
- Jie Yanga, Ran Yanga, Shigao Lib, S.Shoujing Yina, and Qianqing Qina, “A Novel Edge Detection Based Segmentation Algorithm for Polarimetric Sar Images”, The International Archives of the Photogrammetry, Remote sensing and Spatial Information, Sciences. Vol. XXXVII, Part B7.Beijing, 2008.
- Pinaki Pratim Acharjya, Ritaban Das and Dibyendu Ghoshal, “Study and Comparison of Different Edge Detectors for Image Segmentation”, Global Journal of Computer Science and Technology Graphics & Vision, Volume 12 Issue 13, pp. 28-32, 2012.
- Pushpajit A. Khaire and Dr. N. V. Thakur, “A Fuzzy Set Approach for Edge Detection”, International Journal of Image Processing (IJIP), Volume 6 Issue 6, pp. 403-412, 2012.
- Gonzalez, Rafael C., Richard E. Woods, and S. L. Eddins, "Image segmentation." Digital Image Processing, pp. 700-703, 2011.
- Othman, Zolqernine, Habibollah Haron, Mohammed Rafiq Abdul Kadir, and Mohammed Rafiq. "Comparison of Canny and Sobel Edge Detection in MRI Images.", pp. 133-136, 2009.
- Raman Maini and Dr. Himanshu Aggarwal, “Study and Comparison of Various Image Edge Detection Techniques”, International Journal of Image Processing (IJIP), Volume (3): Issue (1), pp. 1 – 12, 2000.
- G.T. Shrivakshan and Dr.C. Chandrasekar, “A Comparison of various Edge Detection Techniques used in Image Processing”, IJCSI International Journal of Computer Science Issues, Vol. 9, Issue 5, No 1, pp. 269 – 276, 2012.
- P. Vidya, S. Veni and K.A. Narayanankutty, “Performance Analysis of Edge Detection Methods on Hexagonal Sampling Grid”, International Journal of Electronic Engineering Research, Volume 1, pp. 313–328, Number 4 2009.
- Peter Kellman and Elliot R. McVeigh, “Image Reconstruction in SNR Units: A General Method for SNR Measurement”, Magn Reson Med. Author manuscript, Magn Reson Med. Volume 54(6) pp. 1439–1447, December 2005.
