Education as a driver of demographic transition for urban and rural populations in post-Soviet Russia

Author: Domnich Ye.L.
Journal: Economic and Social Changes: Facts, Trends, Forecast @volnc-esc-en
Section: Social and economic development
Article in issue: 1 т.19, 2026.
Free access
Education is one of the most important factors determining the demographic transition to an equilibrium state of low fertility. Demographic transition is expressed in the tendency for demographic indicators to converge globally. This is often realized as a sequence of local equilibria, when countries and regions form convergence clubs. The study used an ordered logistic model and materials from the 1989 and 2020 censuses to estimate the influence of the initial level of education and its growth rate on the formation of regional age-specific fertility convergence clubs of urban and rural populations of post-Soviet Russia. The study confirmed the significant role of education in the demographic transition for urban and rural populations in the age groups of 15–19 and 20–24 years. The influence of education indicators on the formation of regional age-specific fertility convergence clubs is more pronounced and stable than that of factors of matrimonial behavior, ethnic composition, and gender and age structure of the population. Marginal effects of education indicators on the likelihood of regions achieving a local equilibrium in terms of age-specific fertility were assessed. It is shown that the level of education in 1989 and the rate of its growth by 2020 had a significant impact on the formation of regional age-specific fertility convergence clubs of urban and rural populations in post-Soviet Russia. Due to this impact, regions exited high-fertility clubs and anchored in low-fertility clubs.
Fertility, education, marginal effects, age-specific fertility rate, urban population, rural population, convergence, ordered logistic model, convergence clubs, demographic transition, regions of Russia, post-Soviet period
Short address: https://sciup.org/147253453
IDR: 147253453 | UDC: 314.04+314.38+314.92 | DOI: 10.15838/esc.2026.1.103.15
Text of the scientific article Education as a driver of demographic transition for urban and rural populations in post-Soviet Russia
The ratio between the number of children and the human capital invested in each child is a key parameter of unified growth theory, which models the transition from Malthusian stagnation to sustained growth (Galor, 2011). This typically involves a fertility-education trade-off. The existence of such a trade-off has been demonstrated for diverse societies and historical periods (Ashraf, Galor, 2011; Becker et al., 2010; Qian, 2009; Rosenzweig, Wolpin, 1980). It is indisputably an inherent feature of the demographic transition, which began in developed capitalist countries in the second half of the 19th century and intensified in Russia in the context of post-Soviet socio-economic transformations (Vishnevsky, 2014; Domnich, 2024c).
Another important pattern of the modern demographic transition is the convergence of demographic indicators as different countries and regions reach a shared long-term equilibrium (O’Connell, 1981; Gabrielli et al., 2021; Stadnik, 2023; Domnich, 2024b). This is a long-term, non-linear process involving the overcoming of numerous constraints, often implicit and hard to measure: social, economic, institutional, cultural (Papagni, 2023). Often, demographic convergence, such as fertility levels moving closer, first occurs within small “clubs” – groups of countries (regions) that are similar in some respect and thus capable of reaching local equilibrium relatively quickly (O’Connell, 1981; Dorius, 2008; Strulik, Vollmer, 2013; Nakagaki, 2019). Research on age-specific fertility across the Russian regions has proven that such clubs have also formed in post-Soviet Russia, separately for urban and rural populations (Domnich, 2025).
The link between the formation (or dissolution) of such clubs and education has not been studied previously, which defines the relevance of this research. The study aims to estimate the marginal effects of education as a factor in the formation and dissolution of regional age-specific fertility convergence clubs in the regions of post-Soviet Russia. The objectives are to synthesize global experience in assessing the demographic effects of education, to justify a relevant methodology for evaluating the link between changes in education levels and the formation (dissolution) of regional fertility convergence clubs, and to apply it to the case of regional age-specific fertility convergence clubs among urban and rural populations in postSoviet Russia.
The subject of the research is the marginal effects of the level of education on the formation and dissolution of regional age-specific fertility convergence clubs among urban and rural populations. The object of the research is the 79 constituent entities of the Russian Federation from 1990 to 20231.
Theoretical framework
For half a century, education has maintained a significant negative correlation with fertility in all world regions, except for the most developed countries where the demographic transition was generally completed by the mid-20th century2 ( Tab. 1 ). Often, the effect of education is even more important than the influence of economic factors, such as per capita income growth. During the demographic transition, households are forced to make a trade-off choice, first, between consumption and child-rearing expenditures, and second, within child-rearing expenditures, between the costs of upbringing and education of each child (Rosenzweig, Wolpin, 1980; Martin, 1995;
Table 1. Pearson correlation coefficients between total fertility rate and relevant indicators, 1960–2020
|
World region |
Log of per capita GDP |
Expected years of schooling for women |
Human Development Index |
|
World |
-0.66*** |
-0.82*** |
-0.88*** |
|
Western Europe and related countries |
-0.22*** |
0.11** |
0.10*** |
|
Eastern Europe |
-0.42*** |
-0.35*** |
-0.38*** |
|
Latin America and the Caribbean |
-0.85*** |
-0.67*** |
-0.81*** |
|
Arab states |
-0.64*** |
-0.81*** |
-0.78*** |
|
Sub-Saharan Africa |
-0.73*** |
-0.81*** |
-0.84*** |
|
Asia |
-0.77*** |
-0.79*** |
-0.77*** |
|
*** – 1% significance level; ** – 5% significance level. Compiled based on: (Cheng et al., 2022, p. 6). |
|||
Galor, Moav, 2002; Monstad et al., 2008; Becker et al., 2010). The strengthening interconnection between the rate of technological progress and population size as well as its composition accelerated technological progress, laying the foundation for sustained growth. Thus, growth in human capital (education level) can suppress fertility both directly at the household level and indirectly, as a factor increasing per capita gross domestic product (GDP).
In contemporary Russia (2010–2015), women with higher education status have, on average, fewer children than women with lower education. More educated women also, on average, have a higher age at first birth and longer interbirth intervals. Among women completing their reproductive years (real cohorts), the average number of children born is 1.5 for women with higher or incomplete higher education and 1.8 for women with secondary vocational or lower education level (Arkhangelskiy et al., 2019). Thus, Russia currently converges with developing countries in Asia, Africa, and Latin America and replicates the experience of developed nations in terms of the role of education in the demographic transition of Russian society, which intensified during systemic post-Soviet transformations.
However, quantitative convergence in childbearing intensity across different groups and populations of women is not always the case.
Dynamics of fertility can be divergent or proceed at different speeds, hindering the achievement of global (national) equilibrium (Domnich, 2024a). Education also appears to play an important role here. For example, a regional cohort study across 15 European countries showed that the negative effect of education on fertility is lower in magnitude in the most economically developed regions and among the most educated women (Nisen et al., 2021). Regional and national differences in fertility conditions give rise to numerous local equilibria (convergence clubs), which, up to a certain point, hinder the achievement of a common equilibrium (global or nationwide convergence). The existence of such clubs has been proven using data on total fertility in 190 countries for 1950–2018 (Papagni, 2023), as well as in the regions of post-Soviet Russia for 1990–2023 – using data on age-specific fertility for urban and rural populations (Domnich, 2025). Hence, the demographic transition itself can be understood as a process of sequential formation and dissolution of local clubs of demographic indicators convergence, meaning a transition from one equilibrium state to another (O’Connell, 1981; Gabrielli et al., 2021; Stadnik, 2023).
Therefore, scientific interest lies, first, in identifying the most influential factors securing countries and regions to demographic convergence clubs, and second, in estimating the marginal effects of such factors that either facilitate or hinder a territory’s exit from a specific club. Factors of the demographic transition on a global scale could include the absolute latitude of a country’s capital, the percentage of arable land, the mean distance to the nearest waterway, mean annual temperature, mean precipitation, mean elevation, interpersonal genetic diversity of the population, geodesic distance from East Africa (as the presumed cradle of humanity), geodesic distance to the USA, the difference between 2000 CE and the estimated year of the transition from hunting and gathering to a sedentary agricultural economy at a country level, ethnic and religious fractionalization, the Malaria Ecology Index, index of the quality of political institutions, and the Rule of Law Index (Papagni, 2023, pp. 463–465)3.
As for the realities of the post-Soviet demographic transition, the role of education, both female and male, is hard to overestimate. As experts note, the process of systemic transformation in Russia was accompanied by a simultaneous devaluation of human capital accumulated in the previous era (Kapeliushnikov, 2005). Naturally, this was reflected in a noticeable increase in the significance and share of education, both as a direction for investing effort and resources and as a lifestyle in general4. It is logical to assume that due to unequal and uneven access to educational services across the vast country, the rate of human capital accumulation varied significantly among regions throughout the post-Soviet period, which is also reflected in regional and urban-rural differentiation in fertility levels. Therefore, it is appropriate to examine the regional fertility convergence clubs that formed in post-Soviet Russia in relation to changes in the educational level of the population.
Regional age-specific fertility convergence clubs among urban and rural populations in post-Soviet Russia (1990–2023) were identified using the Phillips-Sul methodology (Phillips, Sul, 2007), which corresponds to the contemporary mainstream approach to identifying such regional groups (Alexiadis et al., 2021; Zhang et al., 2019; Bartkowska, Riedl, 2009; Barrios et al., 2019; Jimenez-Moro et al., 2023; Matysiak, Olszewski, 2019). This involves clustering time series of agespecific fertility so that regions included in a particular club demonstrate a statistically significant tendency toward a common asymptote, which is determined endogenously. It is established that the number of such clubs increases with decreasing age of mothers, and decreases with increasing age of mothers ( Tab. 2 ). The type of settlement also matters: the number of convergence clubs is higher in rural areas and lower in urban areas. For younger age groups (15–19 and 20–24), as well as for the rural population aged 25–29, divergent regions were identified that do not belong to any convergence club (which is mathematically justified within the method). A single club can include as few as 2 or as many as 79 regions, consistent with the experience of identifying such clubs among world countries (Papagni, 2023); the composition of clubs differs for age groups and for urban and rural populations5.
Regional convergence clubs are numbered ( C1 ,..., CN ) in descending order of the club’s average age-specific fertility rate in 2023. While the number of clubs depends on the age group, their composition is largely determined by the type of settlement: convergence of age-specific fertility is more active in urban areas. Thus, in the younger age groups (15–19 and 20–24), regional clubs with the highest average fertility are formed
Table 2. Regional age-specific fertility convergence clubs among urban and rural populations in post-Soviet Russia (1990–2023, 79 regions)
|
Age of mothers, years |
Urban population |
Rural population |
||
|
Number of regional clubs |
Number of divergent regions |
Number of regional clubs |
Number of divergent regions |
|
|
15–19 |
7 |
2 |
6 |
2 |
|
20–24 |
5 |
2 |
6 |
2 |
|
25–29 |
2 |
0 |
5 |
2 |
|
30–34 |
1 |
0 |
2 |
0 |
|
35–39 |
1 |
0 |
1 |
0 |
|
40–44 |
1 |
0 |
1 |
0 |
|
Compiled based on: (Domnich, 2025). |
||||
fundamentally differently in cities and villages. In rural areas, they are represented by regions with initially (1990) high fertility, which converge only with each other. In urban settlements, such clubs unite regions whose initial fertility levels range from very high to extremely low. So, fertility among urban youth in traditionally high-fertility regions declined faster during the post-Soviet period than in regions with medium and low fertility, leading to their convergence.
In the 25–29 age group for the urban population, two large regional convergence clubs were identified, uniting 28 and 51 regions, respectively. For the rural population in this age group, 5 convergence clubs were identified. The composition of club C1 , which in younger rural age groups consisted only of regions with high fertility, is half diluted with regions of medium fertility. Thus, the configuration of clubs in the rural 25–29 group is in an intermediate state between the configurations in the younger rural and urban age groups.
In the 30–34 age group for the urban population, one common convergence club was identified, indicating the achievement of a common (countrywide) equilibrium. For the rural population in this age group, two large regional convergence clubs were identified, uniting 34 and 45 regions, respectively. In older age groups (35–39 and 40–44), age-specific fertility reached equilibrium at the country level regardless of settlement type, making these groups less interesting in the context of this study6.
The assessment of the education level of urban and rural populations in the regions of Soviet and post-Soviet Russia can be based on the share of the population with higher, incomplete higher, and secondary vocational education, calculated based on the 19897 and 20208 population censuses. The following patterns are noteworthy ( Figure ). The initial (1989) education level was, with rare exceptions, higher for the urban population, indicating unequal opportunities for Soviet citizens to develop human capital depending on place of residence. At the same time, the growth rate of the indicator for 2020 relative to 1989 was, on average, higher in rural areas; the slope of the
Share of population aged 15 and over with higher, incomplete higher, and secondary vocational education in 1989 (X-axis) and its growth rate to 2020 (Y-axis) in 79 Russian regions, %
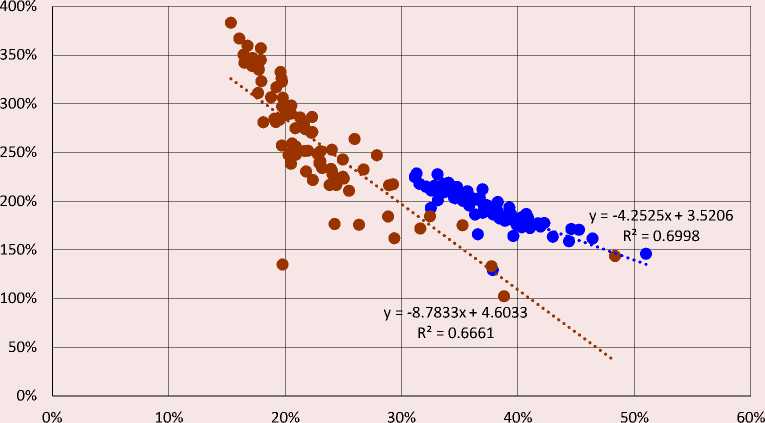
urban population rural population
Source: own compilation.
corresponding linear trend is twice as steep for the rural population compared to the urban one. During the post-Soviet period, the population of Russian regions was bridging the gaps in education both between regions and between rural and urban populations. Data for rural areas show significantly greater dispersion and differentiation than in cities. Russian villages demonstrate substantially greater diversity in education levels compared to Russian cities.
Research methodology and hypotheses
The formation of regional age-specific fertility convergence clubs can be interpreted as the result of the differential impact of various constraints to economic development and demographic transition. Regions belonging to clubs with the highest average fertility (C1) face the greatest difficulties in embarking on a path of significant fertility decline, i.e., exiting this club and joining clubs C2,...,CN (Papagni, 2023, p. 443). As the average fertility in clubs C2,...,CN decreases, the constraints for regions to enter and exit these clubs also diminish.
In line with the mainstream approach to modeling constraints for regions to entry and exit convergence clubs (Zhang et al., 2019; Bartkowska, Riedl, 2009; Barrios et al., 2019; Jimenez-Moro et al., 2023; Matysiak, Olszewski, 2019; Papagni, 2023), the ordinal numbers of regional convergence clubs C1,...,CN within each age group are treated as ordinal nominal variables to be modeled using an ordered logistic model. The model assumes the existence of a continuous latent variable y f for each region i , which depends linearly on a vector of independent variables Xi :
У*! = ^iP + £i.
The variable у * can be interpreted as a certain equilibrium level of fertility determining a region’s gravitation toward one of the convergence clubs. When у * falls within the range of specific threshold values т , the equilibrium fertility level in region i determines its membership in convergence club j :
yt = j , if Tj-1 < yf < Tj, j = 1,., TV.
Threshold values T 1 ,..., TN-1 are to be estimated, while To = —^ , and lN = ^ . When the variable у * exceeds threshold Т у , region i joins club j +1.
The ordered logistic model is defined as the probabilistic model:
ln (гйи) = ' i -xj..... N- 1
Probabilities of belonging to a specific club are estimated at the mean values of variables X and are defined as follows:
PT1-^^
Pr(y = 1|X) = 1—^ for j = 1
^-x? ^j-i-w
Pr(y = Ж) = 1+e^ - . .. < for j = 2-- N-
PTN—1~XP
Pr(y = Ж) = 1 - 1+p tn_i-XP for J = N
Significant positive values of coefficients β in this model mean that a region with a larger value of Xi is, on average, located in a club with a higher ordinal number j (i.e., with lower average fertility). If a significant coefficient has a negative sign, an increase in Xi statistically significantly reduces j and the region enters a club with higher average fertility.
To assess how much certain variables determine regional membership in a specific club, the marginal values of predicted probabilities (marginal effects) are also evaluated. Marginal effects estimate how the probability of club membership changes when an independent variable changes by one unit, while all other variables are fixed at their sample mean values. Thus, positive marginal effects help a region
“consolidate” in a particular club, while negative effects allow a region to leave it. In accordance with the research objectives, we are primarily interested in the marginal effects of variables measuring education levels.
The vector of independent variables Xi for modeling convergence clubs is typically formed to reflect both initial conditions and the direction (rate) of development of vector yi (Zhang et al., 2019; Bartkowska, Riedl, 2009; Matysiak, Olszewski, 2019). Therefore, the education factor is represented by two variables in our model: the share of the population aged 15 and over with higher, incomplete higher, and secondary vocational education in 1989 ( obraz_89 ) and its growth rate to 2020 ( gr_obraz )9.
Demographers identify numerous social, economic, and demographic factors influencing fertility levels. The 1989 census reflects only a small part of them. Among these, changes in matrimonial behavior (Klupt, 2014; Zhuravleva, Gavrilova, 2017; Alekhin, 2023) and the ethnic 1; composition of the population (Trynov et al., 2020; Vakulenko et al., 2023) appear to be the most important for demographic development over three decades. Accordingly, changes in matrimonial behavior are considered using the share of persons aged 16 and over who have never been married in 1989 ( single_89 )10 and its growth rate to 2020 ( gr_single )11, while changes in the
-
9 All variables are calculated separately for urban and rural populations.
-
10 Calculated based on: Brief Socio-Demographic Characteristics of the Population of the RSFSR (according to the 1989 All-Union Population Census). Part 1. Population, gender, age, nationalities, marital status, education level. Moscow: Republican Information and Publishing Center of the State Statistics Committee of the RSFSR, 1991, 210 p. Available at: https://www.statmuseum.ru/ru/results/1989/ ?section=1989&PAGEN_1=1 (accessed: 07.07.2025).
-
11 Calculated based on: The Results of the 2020 AllRussian Population Census. Volume 2. Gender and age composition and marital status. Available at: https://rosstat.gov.ru/ vpn/2020/Tom2_Vozrastno_polovoj_sostav_i_sostoyanie_v_ brake (accessed: 07.07.2025).
ethnic composition are evaluated using the share of Eastern Slavs (Russians, Ukrainians, Belarusians) in the total population in 1989 ( slav_89 )12 and its growth rate to 2020 ( gr_slav )13. Changes in the gender and age structure of the population are evaluated using the share of women in the corresponding age group in the total population in 1990 ( women_90 ) and its growth rate to 2020 ( gr_women )14.
Descriptive statistics for the variables used are presented in Table 3 . It can be concluded that the average level of all initial (1989) indicators is systematically higher for the urban population, but its growth rate is always higher for the population living in rural areas. Means and medians differ slightly with moderate standard deviation, indicating that the distribution of independent variables is close to normal.
Table 3. Descriptive statistics of independent variables, %
|
Variable |
Population |
Gender |
Age, years |
Mean |
Median |
Std. Dev. |
Min |
Max |
|
obraz_1989 |
urban |
both |
15+ |
37.4 |
37.1 |
3.8 |
31.1 |
51.0 |
|
gr_obraz |
urban |
both |
15+ |
193.0 |
193.2 |
19.1 |
129.4 |
228.4 |
|
obraz_1989 |
rural |
both |
15+ |
22.7 |
21.6 |
5.5 |
15.3 |
48.3 |
|
gr_obraz |
rural |
both |
15+ |
260.6 |
256.3 |
59.3 |
102.5 |
383.1 |
|
single_1989 |
urban |
both |
16+ |
16.9 |
16.3 |
2.1 |
12.4 |
23.5 |
|
gr_single |
urban |
both |
16+ |
111.3 |
108.8 |
13.4 |
85.2 |
173.7 |
|
single_1989 |
rural |
both |
16+ |
15.3 |
14.5 |
3.2 |
9.8 |
27.3 |
|
gr_single |
rural |
both |
16+ |
131.3 |
128.4 |
19.3 |
103.5 |
207.5 |
|
slav_1989 |
urban |
both |
0+ |
86.3 |
93.2 |
16.8 |
19.0 |
98.9 |
|
gr_slav |
urban |
both |
0+ |
94.2 |
99.0 |
14.9 |
26.7 |
113.1 |
|
slav_1989 |
rural |
both |
0+ |
74.9 |
87.1 |
27.3 |
2.5 |
99.3 |
|
gr_slav |
rural |
both |
0+ |
96.2 |
99.2 |
18.6 |
28.4 |
136.2 |
|
women_90 |
urban |
fem./both |
15–19 |
3.7 |
3.7 |
0.5 |
2.5 |
6.5 |
|
gr_women |
urban |
fem./both |
15–19 |
71.9 |
70.0 |
10.9 |
57.6 |
115.3 |
|
women_90 |
urban |
fem./both |
20–24 |
3.3 |
3.3 |
0.4 |
2.6 |
4.5 |
|
gr_women |
urban |
fem./both |
20–24 |
72.9 |
71.4 |
8.4 |
55.7 |
96.0 |
|
women_90 |
urban |
fem./both |
25–29 |
4.3 |
4.1 |
0.5 |
3.4 |
6.2 |
|
gr_women |
urban |
fem./both |
25–29 |
61.2 |
60.4 |
7.8 |
43.1 |
90.0 |
|
women_90 |
rural |
fem./both |
15–19 |
2.6 |
2.6 |
0.5 |
1.9 |
4.8 |
|
gr_women |
rural |
fem./both |
15–19 |
99.3 |
99.4 |
14.4 |
67.7 |
161.3 |
|
women_90 |
rural |
fem./both |
20–24 |
2.8 |
2.7 |
0.4 |
2.0 |
4.4 |
|
gr_women |
rural |
fem./both |
20–24 |
79.5 |
80.0 |
10.9 |
44.9 |
99.8 |
|
women_90 |
rural |
fem./both |
25–29 |
3.7 |
3.7 |
0.7 |
2.5 |
6.2 |
|
gr_women |
rural |
fem./both |
25–29 |
60.7 |
61.6 |
12.6 |
30.5 |
91.4 |
|
women_90 |
rural |
fem./both |
30–34 |
3.9 |
3.8 |
0.7 |
2.6 |
6.2 |
|
gr_women |
rural |
fem./both |
30–34 |
80.6 |
78.5 |
18.6 |
29.4 |
127.3 |
|
Source: own calculation. |
||||||||
12 Calculated based on: The National Composition of the RSFSR Population. According to the 1989 All-Union Population Census, Moscow: Republican Information and Publishing Center of the State Statistics Committee of the RSFSR, 1990, 747 p. Available at: (accessed: 07.07.2025).
13 Calculated based on: The Results of the 2020 All-Russian Population Census. Volume 5. Nationality and language. Available at: (accessed: 07.07.2025).
14 Calculated based on: Calculated based on: The number of resident female population by age as of January 1. Available at: (accessed: 01.07.2025).
The variance inflation factor (VIF) estimate, showing how much the variance of estimated coefficients increases due to independent variables multicollinearity, indicated that parameter values in all equations do not exceed 3–3.5, which is three-fold lower than the threshold level. Due to potential heteroskedasticity of residuals, robust variance estimates obtained using the Huber – White method (Huber, 1967; White, 1980) were used. Thus, the model coefficient estimates can be considered sufficiently reliable. The research strategy included estimating β coefficients for ordered logistic regression with education variables only (1) and with the full set of variables (2), as well as calculating marginal effects of education variables for the model with the full set.
The presented data on regional age-specific fertility convergence clubs and methodology characteristics allow formulating four working hypotheses.
H1 . Indicators of education level are significant and positive factors of the demographic transition in terms of moving regions from clubs with relatively high average fertility to clubs with relatively low average fertility.
H2 . Indicators of education level are more important for the demographic transition of women in younger age groups (15–19 and 20–24) than those in middle age groups (25–29 and 30–34).
H3 . For the demographic transition in urban areas, the initial (1989) level of education is more important than its growth rate to 2020, whereas in rural areas, the growth rate of education level to 2020 is more important than its initial level in 1989.
H4 . The marginal effects of education indicators are directed, on the one hand, at overcoming the constraints of regional convergence clubs with the highest values of age-specific fertility, and on the other, at consolidating membership in clubs with the lowest values of age-specific fertility.
Calculation results for the urban population are presented in Tables 4 and 5 , and for the rural population they are in Tables 6 and 7 .
The calculations confirmed a statistically significant positive relationship between education indicators for both urban and rural populations and the latent variable y * . The slightly differing estimates of β coefficients in specifications (1) and (2) indicate the robustness of education effects (Tables 4 and 6). Education indeed facilitates overcoming constraints or thresholds for transitioning from regional clubs with relatively high fertility to regional clubs with relatively low fertility, confirming hypothesis H1 . Notably, the study did not identify a single statistically significant negative coefficient for the influence of education indicators on the dependent variable.
The effects of education are most pronounced in the younger age groups (15–19 and 20–24), also confirming hypothesis H2. In the younger age groups of the urban population, education indicators are the key predictors of the demographic transition, while most control variables do not have a significant influence on the reproductive behavior of young urban women. Exceptions are the growth rate of the share of never-married persons and the growth rate of the Slavic population share, which have a significant negative (restraining) influence on the demographic transition of the urban population aged 15–19. In the 15–19 age group of the rural population, education indicators stimulating the demographic transition are opposed by almost all control variables, which have a statistically significant and negative influence on the demographic transition variable15. An increase in the initial (1989) level of the share of never-married persons, the share of the Slavic population, and the share of women aged 15–19 in the total two indicators, creates constraints in rural areas on population, as well as the growth rates of the latter regions transition to clubs with lower fertility.
Table 4. The impact of education on the intensity of demographic transition for the urban population of post-Soviet Russia
|
Age, years |
15–19 |
20–24 |
25–29 |
|||
|
Specifications |
(1) |
(2) |
(1) |
(2) |
(1) |
(2) |
|
obraz_89 |
51.914*** |
56.929*** |
28.011** |
37.524** |
-14.919 |
-11.581 |
|
gr_obraz |
15.559*** |
16.072*** |
10.179*** |
12.054*** |
-1.279 |
0.128 |
|
single_89 |
- |
-5.776 |
- |
7.030 |
- |
-7.462 |
|
gr_single |
- |
-8.301*** |
- |
0.035 |
- |
-0.280 |
|
slav_89 |
- |
0.700 |
- |
4.366 |
- |
0.017 |
|
gr_slav |
- |
-8.703** |
- |
1.566 |
- |
5.623** |
|
women_90 |
- |
-54.687 |
- |
162.347 |
- |
104.346 |
|
gr_women |
- |
-2.939 |
- |
0.866 |
- |
17.951*** |
|
τ 1 |
48.283*** |
28.937*** |
29.179*** |
48.848*** |
-8.667 |
14.319 |
|
τ 2 |
49.754*** |
30.634*** |
31.847*** |
51.631*** |
- |
- |
|
τ 3 |
50.278*** |
31.224*** |
33.080*** |
52.866*** |
- |
- |
|
τ 4 |
51.508*** |
32.565*** |
34.243*** |
54.041*** |
- |
- |
|
τ 5 |
53.040*** |
34.190*** |
- |
- |
- |
- |
|
τ 6 |
53.827*** |
35.008*** |
- |
- |
- |
- |
|
Number of observations |
77 |
77 |
77 |
77 |
79 |
79 |
|
Wald χ 2 |
20.59*** |
49.86*** |
19.67*** |
24.48*** |
2.03 |
15.38** |
|
Pseudo R 2 |
0.116 |
0.172 |
0.105 |
0.136 |
0.025 |
0.152 |
|
*** – 1% significance level; ** – 5% significance level; * – 10% significance level. Source: own calculation. |
||||||
Table 5. Marginal effects of education on the intensity of demographic transition for the urban population of post-Soviet Russia
|
Age, years |
15–19 |
20–24 |
25–29 |
|||
|
Club number |
obraz_89 |
gr_obraz |
obraz_89 |
gr_obraz |
obraz_89 |
gr_obraz |
|
1 |
-7.044*** |
-1.989*** |
-5.943** |
-1.909*** |
2.169 |
-0.024 |
|
2 |
-2.708** |
-0.764** |
0.751 |
0.241 |
-2.169 |
0.024 |
|
3 |
0.324 |
0.091 |
2.706** |
0.869*** |
- |
- |
|
4 |
2.986** |
0.843*** |
1.533 |
0.493* |
- |
- |
|
5 |
3.825*** |
1.080*** |
0.953 |
0.306 |
- |
- |
|
6 |
1.192 |
0.336 |
- |
- |
- |
- |
|
7 |
1.425 |
0.402 |
- |
- |
- |
- |
* – 10% significance level. Source: own calculation. |
||||||
The identified urban-rural differences in the set of significant regressors in the 15–19 group can be explained by different principles of formation of regional fertility convergence clubs in this age group in cities and villages. While the trajectory of descent of urban population fertility in the most fertile regions often converges with the fertility of much less fertile regions, in rural areas several territories with the highest fertility converge only with each other, forming small clubs with only a few regions. Convergence of age-specific fertility trajectories in urban areas between regions with initially high and low fertility is already achieved in club C1 , whereas in rural areas, mass regional convergence of age-specific fertility is observed only in clubs С3 , С4 , and С5 , which mainly consist of regions with initially medium and low fertility. Considering that regions with initially high fertility are mainly national republics, it is natural that factors related to matrimonial behavior, ethnic composition, and the gender and age structure are significant in a region’s transition from one club to another.
For both urban and rural populations in younger age groups, the effect of the initial education level (1989) exceeds the effect of its growth to 2020 several-fold; thus, hypothesis H3 was only partially confirmed.
In middle age groups (25–29 and 30–34), education as a factor of demographic transition has substantially less significance compared to control variables, as indicated by the low pseudo R 2 value in specification (1) for these age groups, as well as the general insignificance of equation (1) by the Wald criterion for the urban population in the 25–29 group and for the rural population in the 30–34 group. It can be concluded that education, on average, ceases to influence fertility after the age when young people typically complete higher education. This established fact is consistent with the result obtained from data on real cohorts of women, that more educated Russian women have a higher age at first birth (Arkhangelskiy et al., 2019). An important exception here is the influence of the initial (1989) education level on the demographic transition of the rural population in the 30– 34 group; not as large as in younger age groups, but statistically significant. It can be cautiously suggested that in this case we are dealing with an echo of unequal access to education in Soviet times, as well as rural-urban migration, where former rural women became mothers after moving to cities.
The different role of education in the demographic transition of urban and rural populations are most clearly manifested in the marginal effects of education indicators. Here, the contribution of the factor within each club can be traced. The estimated marginal effects of education showed that education indicators statistically significantly help regions leave the convergence club with the highest values of average age-specific fertility and consolidate membership in clubs with the lowest values of age-specific fertility (Tables 5 and 7). This confirms hypothesis H4 .
In the 15–19 urban age group, both the indicator of the initial (1989) education level and its growth rate to 2020 exert a statistically significant negative effect on the probability of regions membership in clubs С1 and С2 and a statistically significant positive effect on the probability of their membership in clubs С4 and С5 . For the rural population of the same group, education indicators statistically significantly “push” regions out of clubs С1 and С3 and “consolidate” them in clubs С5 and С6 .
In the 20–24 group, both the initial education level and its growth rate continue to influence the demographic transition of the urban population; they allow regions to leave club С1 and consolidate in club С3 . In rural areas, only the growth rate of the education level has a stable influence on the movement of regions between clubs. It helps leave clubs С2 and С3 and join club С5 .
Table 6. The impact of education on the intensity of demographic transition for the rural population of post-Soviet Russia
|
Age |
15–19 |
20–24 |
25–29 |
30–34 |
||||
|
Specifications |
(1) |
(2) |
(1) |
(2) |
(1) |
(2) |
(1) |
(2) |
|
obraz_89 |
22.339*** |
25.070*** |
11.800* |
15.328* |
0.741 |
2.421 |
3.385* |
2.431** |
|
gr_obraz |
3.656*** |
3.018*** |
2.891*** |
3.205*** |
1.230*** |
0.977 |
0.740 |
0.995 |
|
single_89 |
- |
-46.233** |
- |
-25.196* |
- |
-16.903 |
- |
-48.148 |
|
gr_single |
- |
-3.759 |
- |
-1.648 |
- |
0.084 |
- |
3.135* |
|
slav_89 |
- |
-5.807*** |
- |
1.056 |
- |
2.003 |
- |
-2.325 |
|
gr_slav |
- |
-7.146*** |
- |
-1.773 |
- |
1.000 |
- |
-6.920 |
|
women_90 |
- |
-372.450*** |
- |
30.710 |
- |
60.297 |
- |
-250.783** |
|
gr_women |
- |
-8.500*** |
- |
2.081 |
- |
12.085*** |
- |
4.972 |
|
τ 1 |
12.688*** |
-30.333*** |
5.717*** |
2.483 |
0.841 |
9.273 |
2.412 |
-8.605 |
|
τ 2 |
12.915*** |
-30.008*** |
7.322*** |
4.208 |
3.098 |
12.369 |
- |
- |
|
τ 3 |
14.299*** |
-28.196*** |
9.686*** |
6.833 |
4.250 |
13.985 |
- |
- |
|
τ 4 |
16.159*** |
-25.976*** |
10.769*** |
8.047 |
4.385 |
14.154 |
- |
- |
|
τ 5 |
18.899*** |
-22.795*** |
14.436*** |
12.024 |
- |
- |
- |
- |
|
Number of observations |
77 |
77 |
77 |
77 |
77 |
77 |
79 |
79 |
|
Wald χ 2 |
20.53*** |
34.21*** |
30.89*** |
27.67*** |
16.92*** |
39.11*** |
1.55 |
15.58** |
|
Pseudo R 2 |
0.128 |
0.241 |
0.131 |
0.183 |
0.054 |
0.221 |
0.016 |
0.461 |
|
*** – 1% significance level; ** – 5% significance level; * – 10% significance level. Source: own calculation. |
||||||||
Table 7. Marginal effects of education on the intensity of demographic transition for the rural population of post-Soviet Russia
|
Age |
15–19 |
20–24 |
25–29 |
30–34 |
||||
|
Club number |
obraz_89 |
gr_obraz |
obraz_89 |
gr_obraz |
obraz_89 |
gr_obraz |
obraz_89 |
gr_obraz |
|
1 |
-2.300*** |
-0.277*** |
-0.316 |
-0.066 |
-0.152 |
-0.061 |
-3.438** |
-0.116 |
|
2 |
-0.257 |
-0.031 |
-0.690* |
-0.144** |
-0.238 |
-0.096 |
3.438** |
0.116 |
|
3 |
-1.023** |
-0.123** |
-1.500 |
-0.314*** |
0.061 |
0.025 |
- |
- |
|
4 |
0.554 |
0.067 |
-0.001 |
0.000 |
0.013 |
0.005 |
- |
- |
|
5 |
2.403*** |
0.289*** |
2.120 |
0.443*** |
0.315 |
0.127 |
- |
- |
|
6 |
0.624* |
0.075* |
0.387 |
0.081 |
- |
- |
- |
- |
|
*** – 1% significance level; ** – 5% significance level; * – 10% significance level. Source: own calculation. |
||||||||
In the 25–29 age group, the used education indicators are not significant factors for the movement of regions between clubs for either urban or rural populations.
The peculiarity of the 30–34 rural age group is manifested, first, in the presence of two large regional age-specific fertility convergence clubs (see Tab. 2), and second, in the significant influence of the initial (1989) education level on regional membership in both the first and second club. An increase in the indicator statistically significantly forces a region to leave the first club (С1) and remain in the second (С2).
The trade-off between the quantity and quality of children is one of the most fundamental in nature (Becker et al., 2010, p. 180). Therefore, the education level of parents and their children is rightly considered one of the key determinants of fertility levels. This negative relationship for most countries defines the essence of the modern demographic transition. The demographic transition itself manifests in the spatial convergence of key demographic indicators. Global fertility convergence is realized in stages, through a sequence of local equilibria, also known as convergence clubs (regional and national). The study proposes a methodology and obtains quantitative estimates of the influence of the initial education level and its rate of change on the formation of regional agespecific fertility convergence clubs among urban and rural populations in post-Soviet Russia.
The proposed methodology has drawbacks. First, the time frame of the study (from the early 1990s to the 2020s) covers several periods of fertility increase and decline. This is due to the prior identification of regional age-specific fertility convergence clubs over the entire post-Soviet period (1990–2023, see Domnich, 2025), on which this study was based. For a better understanding of the relationship between education and demographic development, future research should split the time frame into shorter intervals.
The statistical data used are imperfect due to the need to ensure comparability of indicators obtained from the 1989 and 2020 censuses. As a result, the time frames of yi (1990–2023) and Xi (1989 and 2020) do not fully coincide, and the list of control variables is strongly bounded. Moreover, the 1989 census did not disaggregate population education data by gender and age, depriving us of the opportunity to assess the demographic effects specifically of female education. These shortcomings define the potential for future research.
The study confirmed the significant role of education in the demographic transition for urban and rural populations in the 15–19 and 20–24 age groups. The influence of education indicators on the formation of regional age-specific fertility convergence clubs is more pronounced and stable than that of factors related to matrimonial behavior, ethnic composition, and the gender and age structure. At the same time, the effect of the initial (1989) education level exceeds several-fold the influence of its growth rate to 2020, which generally underlines the decisive role of initial conditions for the demographic development of regions in postSoviet Russia.
In the youngest age group, 15–19, the initial education level and its growth rate to 2020 among both urban and rural populations facilitate the transition of regions from high-fertility clubs to low-fertility clubs. In the 20–24 group, both the initial education level and its growth rate continue to influence the demographic transition of the urban population. In rural areas, only the growth rate of education level has a stable influence on the movement of regions between clubs. In the 25–29 group, the used education indicators are not significant factors for the movement of regions between clubs for either urban or rural populations. In the 30–34 group, the initial education level of the rural population determines a region’s membership in one of the two convergence clubs.
The author’s contribution to the development of the topic lies in adapting econometric tools, obtaining consistent estimates of the influence of education indicators on the demographic transition for urban and rural populations in postSoviet Russia, and providing their substantive interpretation.
The findings provide many opportunities for further demographic and economic investigations in this area. Two general directions can be indicated: refining the age and space-time characteristics of mother categories serving as turning points in the nature of the relationship between education level and fertility, and identifying and assessing the influence of additional threshold factors for the entry and/or exit of regions from convergence clubs. The study contributes to the development of unified growth theory and the study of long-term trends in age-specific fertility change in post-Soviet Russia.
