Educational Data Mining: Classification Techniques for Recruitment Analysis

Автор: Siddu P. Algur, Prashant Bhat, Nitin Kulkarni
Журнал: International Journal of Modern Education and Computer Science (IJMECS) @ijmecs
Статья в выпуске: 2 vol.8, 2016 года.
Бесплатный доступ
Data Mining is a dominant tool for academic and educational field. Mining data in education atmosphere is called Educational Data Mining. Educational Data Mining is concerned with developing new methods to discover knowledge from educational/academic database and can be used for decision making in educational/academic systems. This work demonstrates an effective mining of students performance data in accordance with placement/recruitment process. The mining result predicts weather a student will be recruited or not based on academic and other performance during the entire course. To mine the students' performance data, the data mining classification techniques such as – Decision tree- Random Tree and J48 classification models were built with 10 cross validation fold using WEKA. The constructed classification models are tested for predicting class label for new instances. The performance of the classification models used are tested and compared. Also the misclassification rates for the classification experiment are analyzed.
Educational Data Mining, Recruitment, Random Tree, J48, Classification
Короткий адрес: https://sciup.org/15014841
IDR: 15014841
Текст научной статьи Educational Data Mining: Classification Techniques for Recruitment Analysis
Published Online February 2016 in MECS DOI: 10.5815/ijmecs.2016.02.08
-
I. Introduction
Data Mining is a method of retrieving formerly unknown, suitable, potentional useful and unknown patterns from large data sets (Connolly, 1999). Nowadays the amount of data stored in educational/academic databases is increasing rapidly. In order to get required benefits from such large data and to find hidden relationships between variables using different data mining techniques developed and used (Han and Kamber, 2006). There are increasing research interests in using data mining in education. This new emerging field, called Educational Data Mining, concerns with developing methods that discover knowledge from data come from
educational environments [1].
The research interests on educational data mining are increasing rapidly [2]. Since, there is rapid increasing rate of establishment of academic/educational institutions nowadays, the educational data mining becoming an emerging trend. The student data can be academic or personal [2]. Also these data can be collected from various Colleges/Universities and websites also. The discovered knowledge (the result of Educational Data Mining) can be used to better understand students' behavior/activities, to assist instructors/professors/teachers, to improve teaching, to evaluate and improve e-learning systems, to improve campus recruitment, to improve curriculums and various other benefits [3] [1].
This research paper makes a novel attempt to predict whether a student will be recruited or not based on various performances such as- examination score, communication skill, and placement preparation hours, breaks taken during the course, extracurricular activities, cultural activities and the number of industrial visits. By considering such performances as attributes for recruitment prediction, Random tree and J48 classification models are used.
The rest of the paper is organized as follows. The section 2 represents some related works which exist to prior the proposed work. The section 3 provides the data account and proposed methodology. The section 4 predicts results using the classification models built with Random tree and J48 classification algorithms. Also the section 4 provides performance evaluation metrics and result analysis. The conclusion and future work are discussed in the final section.
-
II. Related Works
This section represents some related prior works on Educational Data Mining. The authors [2] Samrat Singh and Dr. Vikesh Kumar made an attempt analyze students’ academic data and enhanced the quality of technical educational system using data mining techniques. The authors [2] applied six classification techniques such as-BayesNet, Naïve Bayes, Multilayer Perceptron, IB1, Decision Table and PART on student academic data. Also the authors [2] observed that, according to experimental result IB1 Classifier is most suitable method for the student dataset which they have chosen. The educational organizations can use such classification model to measures or visualized the students’ performance according to the extracted knowledge.
The authors [4] Jai Ruby and Dr. K. David, proposed a data mining model which is mainly focused on analyzing the prediction accuracy of the academic performance of the students. The proposed model uses influencing factors by Multi Layer Perception algorithm. The proposed work [4] paper proved the attributes chosen from the original dataset are really high influence using Multi Layer Perception. This technique helps the educational institutions to know the academic status/condition of the students in advance and can concentrate on feeble students to improve their academic results [11].
The data mining techniques applied on the marks of the student retrieved from the database of the university so as to grade the students based on their up to date performances, by the author [5] Ritika Saxena. The clustering and decision trees techniques are used in order to mine the data as the huge amount of data is available in the university containing the students record so it is required to refine the data so that the results could be used for the future evaluation [12]. Initially evaluated the performance of the clustering algorithm and then secondly evaluated the performance of decision trees algorithm and then the judgment is made as to which algorithm performance is suitable. And after performing both the techniques, the author [5] concluded that decision tree using J48 algorithm is more efficient than clustering k-means technique.
The authors [6] M.I. López, J.M Luna, C. Romero and S. Ventura proposed a classification via clustering approach to predict the final marks in a university course. The objective of the proposed work had twofold: The first objective is to determine if student participation in the course forum can be a good predictor of the final marks for the course and the second objective is to examine whether the proposed classification via clustering approach can obtain similar accuracy to traditional classification algorithms [13] [15]. Experiments were made using real data from first-year University students. Different clustering algorithms using the proposed approach were compared with traditional classification algorithms in predicting whether students pass or fail the course on the basis of their Moodle forum usage data [14]. The results demonstrated that, the ExpectationMaximizations (EM) clustering algorithm yields results similar to those of the best classification algorithms, when using a group of selected attributes.
The authors [7] used students' data from the database of final year students’ for Information Technology UG course and applied data mining techniques ZeroR algorithm to discover knowledge. Also DBSCAN-clustering algorithm is applied on student dataset to make different groups.
-
III. Proposed Technique
This section represents the detailed method of the proposed work. The student dataset is collected from an Engineering College which contains overall academic and extracurricular performance of final year Engineering students. As a part of data preprocessing, the students’ performance data are discretized to get more accuracy in the classification process. The Fig. 1 represents typical structure of the student data records and the Table 1 represents details of attribute descriptions.
Table 1. Details of Attribute Descriptions
|
Sl.No |
Attribute |
Descriptions |
|
1 |
USSN.NO |
Unique ID of students |
|
2 |
Eng.Score |
Average aggregate score of all the semesters in CGPA. 3 ^ CGPA>= 8.0 2 ^ 6.0 >= CGPA<= 7.99 1 ^ 4.0>=CGPA<=5.99 |
|
3 |
Comm.Skill |
Communication Skill (Graded between 1 to 10 Points) 3 -> Points >= 8 (Good) 2 ^ 4 >= Points <= 7 (Average) 1 -> Points <=3 (Poor) |
|
4 |
PlacePrep Hours |
Placement Preparation Hours per Week 3 -> Hours >= 7 2 ^ 3 >= Hours <= 6 1 -> Hours <=2 |
|
5 |
Breaks |
Breaks between 12th and Engineering in Years 0 ^ No Breaks 1 ^ 1 Year 2 ^ 2 Years 3 ^ 3 Years |
|
6 |
ExtraCA |
Performance in Extra Curricular Activities 3 ^ Good/Excellent performance 2 ^ Medium/Average performance 1 ^ Poor performance |
|
7 |
Cult Act |
Performance in Cultural Activities 3 ^ Good/Excellent performance 2 ^ Medium/Average performance 1 -> Poor performance |
|
8 |
IndVisit |
Number of Industrial Visits during the course 3 ^ 10 or above 2 ^ 5 to 9 1 ^ 0 to 4 |
|
9 |
Total |
Total points of attribute no. 2 to 8 |
|
10 |
Placement |
1 ^ Placed/Recruited 2 ^ Not Placed/Recruited |
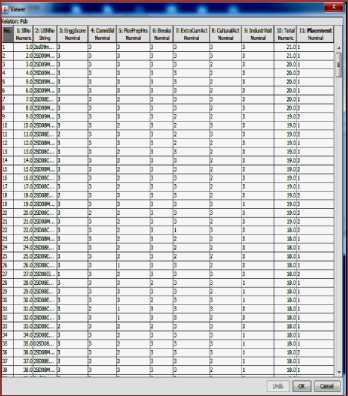
Fig.1. Typical Structure of the Student Performance Data
-
A) The USSN is unique ID which is given to each student in the college.
-
B) The Engineering score in terms of CGPA are fall between 1 to 10 points. The CGPA pints are graded in terms of 1, 2 and 3. The grade 1 represents the CGPA in the range of 4.0 to 5.99. The grade 2 represents CGPA in the range of 6.0 to 7.99. In the similar way, the grade 3 represents CGPA in the range of 8.0 to 10.0.
-
C) The attribute Comm. Skill represents the English verbal skill of each engineering student, and graded as 1, 2 and 3. The grade 3 represents the
communication skill is ‘Good’ (Communication skill points 8 or above, out of 10 points), grade 2 represents communication skill is ‘Average’ (Communication skill points between 4 and 7, out of 10 points), and grade 1 represents communication skill is ‘Poor’ (Communication skill points between 0 and 3, out of 10 points).
-
D) The attribute PlacePrepHours represents number of hours for the study/preparation of
placement/recruitment process. This study includes preparation for aptitudes test/written test and personal interview. The data of this attribute are discretized as 1, 2 and 3. The discrete value 1 represents in the range of 0-2 Hours per week. The discrete value 2 represents in the range of 3-6 Hours per week. Similarly, the discrete value 3 represents 7 hours or above per week.
-
E) The attribute Breaks indicates number of breaks in years between 12th standard and first year
Engineering. In the attribute Breaks , ‘0’ indicates-there are no breaks between 12th and Engineering, ‘1’ indicates – there is 1 year break between 12th and Engineering. Similarly ‘2’ and ‘3’ indicates there are 2 years and 3 years breaks between 12th and Engineering respectively.
-
F) The attribute ExtraCA represents performance of Extra-Curricular Activities of each students. The Extra-Curricular Activities includes any technical activities such as Paper Presentation, Workshops attended etc. The values of attribute are graded as
Excellent/Good, Average and Poor according to the performance of students.
-
G) The attribute CultAct represents performance of Cultural Activities of each student. The Cultural Activities includes any non- technical activities such as mime, songs, dance, quiz, sports etc. The values of attribute are graded as Excellent/Good, Average and Poor according to the performance of students.
-
H) The attribute IndVisit represents number of industrial visits made by the students. This includes-study tour, personal visits and internships. The values of this attribute are discretized as 1, 2 and 3. The discrete value ‘1’ represents- the number of industrial visits in the range of 0 to 4. The discrete value 2 represents- the number of industrial visits in the range of 5 to 9. Similarly, the discrete value 3 represents- the number of industrial visits are 10 or above.
-
I) The attribute Total represents the total from attribute no. 2 to 8.
-
J) The attribute Placement has two distinct values – Placed and Not Placed. The value ‘1’ represents the student has placed in one or more industry, and the value’2’ represents the student has not placed in any industry. Since, our objective is to predict whether a student will be placed or not, we take values of this attribute as class label for our experiment.
To build classification models using Random Tree and J48 algorithms, we need to undergo with - Attribute Selection Measures . The detailed procedures for attribute selection measure are discussed in our previous work [8]. Classification rules are extracted from the built classification models, and a part of the classification rules are presented below.
Pruned J48 tree Rules
EnggScore = 1
| IndustrVisit = 0: 2 (37.0/6.0)
| IndustrVisit = 1: 2 (17.0/3.0)
| IndustrVisit = 2: 2 (0.0)
| IndustrVisit = 3
| | PlcePrepHrs = 1: 1 (1.0)
| | PlcePrepHrs = 2: 1 (8.0/2.0)
| | PlcePrepHrs = 3: 2 (2.0)
EnggScore = 2
| IndustrVisit = 0
| | PlcePrepHrs = 1
| | | ExtraCurrAct = 1: 2 (8.0/3.0)
| | | ExtraCurrAct = 2: 1 (1.0)
| | | ExtraCurrAct = 3: 1 (4.0)
| | PlcePrepHrs = 2: 2 (12.0/3.0)
| | PlcePrepHrs = 3: 1 (6.0/1.0)
| IndustrVisit = 1: 1 (31.0/11.0)
| IndustrVisit = 2: 1 (0.0)
| IndustrVisit = 3: 2 (7.0/2.0) EnggScore = 3
| CommSkil = 1: 2 (3.0)
| CommSkil = 2
| | ExtraCurrAct = 1: 2 (34.0/14.0)
| | ExtraCurrAct = 2: 1 (36.0/8.0)
| | ExtraCurrAct = 3: 1 (58.0/19.0)
| CommSkil = 3: 1 (198.0/40.0)
The detailed procedures for attribute selection measure are discussed in our previous work [8].
Rules part from Random Tree EnggScore = 1
| IndustrVisit = 0
| | CulturalAct = 0: 2 (12/0)
| | CulturalAct = 1: 1 (0/0)
| | CulturalAct = 2
| | | PlcePrepHrs = 1: 2 (6/0)
| | | PlcePrepHrs = 2
| | | | Total < 13.5
| | | | | Total < 10.5
| | | | | | Breaks = 1: 2(1/0)
| | | | | | Breaks = 2: 1(1/0)
| | | | | | Breaks = 3: 1(0/0)
| | | | | Total >= 10.5
| | | | | | Breaks = 1: 1(0/0)
| | | | | | Breaks = 2: 2 (3/1)
| | | | | | Breaks = 3
| | | | | | | CommSkil = 1: 1(0/0)
| | | | | | | CommSkil = 2: 2(2/0)
| | | | | | | CommSkil = 3: 1(2/1)
| | | | Total >= 13.5: 1 (1/0)
| | | PlcePrepHrs = 3
| | | | Total < 14.5: 2(3/0)
| | | | Total >= 14.5: 1 (2/1)
| | CulturalAct = 3
| | | ExtraCurrAct = 1: 2(2/0)
| | | ExtraCurrAct = 2: 1(1/0)
| | | ExtraCurrAct = 3: 2(1/0)
| IndustrVisit = 1
| | PlcePrepHrs = 1
| | | ExtraCurrAct = 1: 2(3/1)
| | | ExtraCurrAct = 2: 1(0/0)
| | | ExtraCurrAct = 3: 2(1/0)
| | PlcePrepHrs = 2
| | | ExtraCurrAct = 1: 2(3/0)
| | | ExtraCurrAct =2
| | | | Total < 14.5: 2 (1/0)
| | | | Total >= 14.5: 1 (1/0)
| | | ExtraCurrAct =3
| | | | CommSkil = 1: 1(0/0)
| | | | CommSkil = 2: 1(2/1)
| | | | CommSkil = 3: 2(3/0)
| | PlcePrepHrs = 3: 2 (3/0)
| IndustrVisit = 2: 1 (0/0)
| IndustrVisit = 3
| | PlcePrepHrs = 1: 1 (1/0)
| | PlcePrepHrs = 2
| | | ExtraCurrAct = 1: 1(2/0)
| | | ExtraCurrAct = 2: 1(3/0)
| | | ExtraCurrAct =3
| | | | Total < 15.5: 2 (1/0)
| | | | Total >= 15.5
-
IV. Results and Discussions
The Random Tree and J48 classification models are built using 10 cross validation folds. To test the considered classification models for the experiment, 463 instances are taken as shown in Fig. 1. The Table 2 represents result obtained by the Random Tree and J48 classification models.
The results describes performance evaluation metrics such as- correctly classified instances, incorrectly classified instances, Precision (P), Recall (R), F-Score (F). Out of 463 test instances, 399 instances are correctly classified, and 64 instances are incorrectly classified by the Random tree classifier. The remaining performance evaluation metrics Precision, Recall and F-Score are considerably found good. Similarly, Out of 463 test instances, 351 instances are correctly classified and 112 instances are incorrectly classified by the J48 classifier. Also, the remaining performance evaluation metrics Precision, Recall and F-Score are found less accuracy as compared to Random Tree classifier and is represented in Fig. 2.
Table 2. Classification Results
|
Classifier Models |
Total Instances: 463 |
P |
R |
F |
|
|
Correctly Classified |
Incorrectly Classified |
||||
|
RT Classifier |
399 |
64 |
0.87 |
0.86 |
0.85 |
|
J48 Classifier |
351 |
112 |
0.76 |
0.75 |
0.74 |
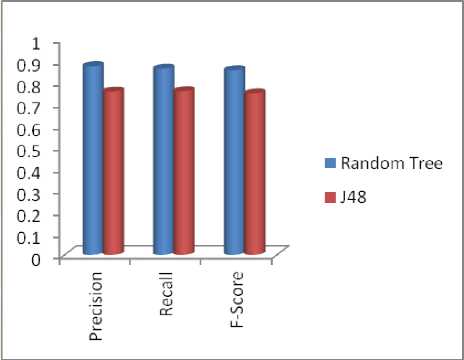
Fig.2. Classification Result Comparison of RT and J48 Models
The Table 3 represents confusion matrix obtained by the result of Random tree and J48 classification models. The presented confusion matrix has two class labels, namely ‘a’ and ‘b’. The class label ‘a’ corresponds to ‘Placed/Recruited’, and the class label ‘b’ corresponds to ‘Not Placed/Recruited’ in concerned with students’ recruitment context
Table 3. Confusion Matrix
|
Random Tree Classifier |
J48 Classifier |
|
|
== |
Confusion Matrix== |
== Confusion Matrix== |
|
a |
b ^ Classified as |
a b ^ Classified as |
|
286 |
7 | a=1 |
262 31 | a=1 |
|
57 |
113 | b=2 |
81 89 | b=2 |
The classification accuracy rate is comparatively high in the result of Random Tree classification. During the classification using Random Tree model, 286 test instances which are belongs to the class ‘Placed/Recruited’ were correctly classified, and 7 instances of the class ‘Placed/Recruited’ were incorrectly classified as ‘Not Placed/Recruited’. Also, 113 instances which are belong to the class ‘Not Placed/Recruited’ were correctly classified, and 57 instances were incorrectly classified as ‘Placed/Recruited’.
The classification accuracy rate is comparatively low in the result of J48 classification. During the classification using J48 model, 262 test instances which are belongs to the class ‘Placed/Recruited’ were correctly classified, and 31 instances of the class ‘Placed/Recruited’ were incorrectly classified as ‘Not Placed/Recruited’. Also, 89 instances which are belong to the class ‘Not Placed/Recruited’ were correctly classified, and 81 instances were incorrectly classified as
‘Placed/Recruited’. It is observed from the experimental result that, the both Random tree and J48 classification models has high misclassification rate on the classification of instances which are belongs to the class ‘Not Placed/Recruited’. The analysis of misclassification rate is described in the Table 4.
Table 4. Misclassification rate of classification models
|
Classification Model |
Misclassification Rate |
|
|
‘Placed/Recruited’ |
‘Not Placed/Recruited’ |
|
|
Random Tree |
2.3% |
33.5% |
|
J48 |
10.5% |
47.6% |
The Fig. 3 and Fig. 4 represents classification tree obtained by the Random tree classifier and J48 classifier respectively.
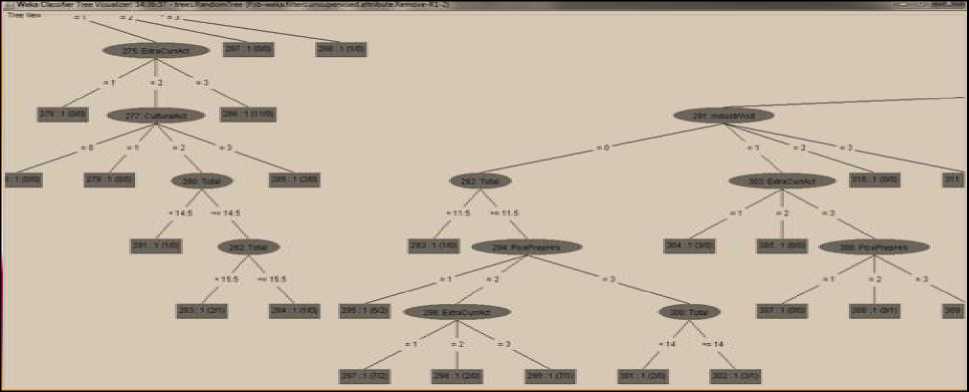
Fig.3. Classification Tree Obtained By the Random Tree Classifier
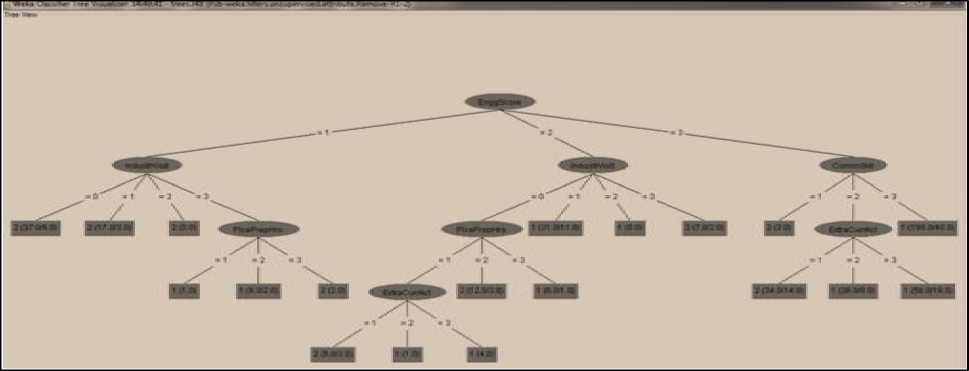
Fig.4. Classification Tree Obtained By the J48 Classifier
The size of the classification tree obtained by the Random tree classifier is 377. According to the procedure for attribute selection measure, the attribute Eng. Score has the highest information gain among all the considered attributes, and hence became the root node of the tree for the both classifiers.
Similarly, the size of the tree obtained by the J48 classifier is 27. The size of the J48 classification tree is too small as compared to Random Tree classifier tree.
-
V. Conclusion and Future Directions
Educational data mining is becoming an emerging trend nowadays. In this work, under the educational data mining theme we made an effective attempt to predict recruitment of students based on their academic and other performances. This helps students as well as educational institutions to know about students, those be recruited by the industry before starting of the campus recruitment process. And those students who will not be recruited by the industries, there will be some chances to improve their performance significantly.
In this experiment, we have used two algorithms-Random Tree and J48 to build classification models using Decision Tree concept. Among these two classification models, the Random Tree classification model is found good as compared to J48 classification model. The accuracy of Random Tree classification model if found 85% and the accuracy of J48 classification model is found 74%. The future direction is to improve the prediction/classification accuracy by using some other data mining techniques such as K-Nearest Neighbor classification technique, Navie Bayesian classification techniques etc.
Список литературы Educational Data Mining: Classification Techniques for Recruitment Analysis
- Romero, C.Ventura, S. and Garcia, "Data mining in course management systems: Model case study and Tutorial". Computers & Education,Vol. 51, No. 1. pp.368- 384. 2008.
- Samrat Singh and Dr. Vikesh Kumar, "Performance analysis of Engineering Students for Recruitment Using Classification Techniques", IJCSET February 2013 Vol 3, Issue 2, 31-37.
- Romero,C. and Ventura, S. ,"Educational data Mining: A Survey from 1995 to 2005".Expert Systems with Applications (33) 135-146. 2007.
- Jai Ruby and Dr. K. David, "Analysis of Influencing Factors in Predicting Students Performance Using MLP –AComparative Study", 10.15680/ijircce.2015.0302070.
- Ritika Saxena, "Educational data Mining: Performance Evaluation of Decision Tree and Clustering Techniques using WEKA Platform", International Journal of Computer Science and Business Informatics, MARCH 2015.
- M.I. López, J.M Luna, C. Romero and S. Ventura, "Classification via clustering for predicting final marks based on student participation in forums" Regional Government of Andalusia and the Spanish Ministry of Science and Technology projects.
- Sunita B Aher and Mr. LOBO L.M.R.J, "Data Mining in Educational System using WEKA", International Conference on Emerging Technology Trends (ICETT) 2011.
- Siddu p. Algur and Prashant Bhat, "Metadata Based Classification and Analysis of Large Scale Web Videos", Interanational Journal of Emerging Trends and Technologies, May-June, 2015.
- Srecko Natek and Moti Zwilling, "Data Mining for Small Student Data Set – Knowledge Management System for Higher Education Teachers", Knowledge Management and Innovation, International Conference, 2013.
- Dorina Kabakchieva, "Predicting Student Performance by Using Data Mining Methods for Classification", Cybernetics And Information Technologies, Volume 13, No 1, 2013.
- Ryan S.J.d. Baker, "Data Mining for Education". International Encyclopedia of Education (3rd edition). Oxford, UK: Elsevier 2010.
- Bhise R.B., Thorat S.S., and Supekar A.K, "Importance of Data Mining in Higher Education System", IOSR Journal Of Humanities And Social Science (IOSR-JHSS), Jan-Feb, 2013.
- Ogunde A. O and Ajibade D. A. ," A Data Mining System for Predicting University Students' Graduation Grades Using ID3 Decision Tree Algorithm ". Journal of Computer Science and Information Technology
- Sonali Agarwal, G. N. Pandey, and M. D. Tiwari, "Data Mining in Education: Data Classification and Decision Tree Approach", International Journal of e-Education, e-Business, e-Management and e-Learning, Vol. 2, No. 2, April 2012.
- Brijesh Kumar Baradwaj and Saurabh Pal, "Mining Educational Data to Analyze Students Performance", International Journal of Advanced Computer Science and Applications, 2011.
