Educational Data Mining: RT and RF Classification Models for Higher Education Professional Courses

Автор: Siddu P. Algur, Prashant Bhat, Narasimha H Ayachit
Журнал: International Journal of Information Engineering and Electronic Business(IJIEEB) @ijieeb
Статья в выпуске: 2 vol.8, 2016 года.
Бесплатный доступ
Computer applications and business administrations have gained significant importance in higher education. The type of education, students get in these areas depend on the geo-economical and the social demography. The choice of a institution in these area of higher education dependent on several factors like economic condition of students, geographical area of the institution, quality of educational organizations etc. To have a strategic approach for the development of importing knowledge in this area requires understanding the behavior aspect of these parameters. The scientific understanding of these can be had from obtaining patterns or recognizing the attribute behavior from previous academic years. Further, applying data mining tool to the previous data on the attributes identified will throw better light on the behavioral aspects of the identified patterns. In this paper, an attempt has been made to use of some techniques of education data mining on the dataset of MBA and MCA admission for the academic year 2014-15. The paper discusses the result obtained by applying RF and RT techniques. The results are analyzed for the knowledge discovery and are presented.
Data Mining, Educational Data Mining, Random Tree Classification, Random Forest Classification
Короткий адрес: https://sciup.org/15013411
IDR: 15013411
Текст научной статьи Educational Data Mining: RT and RF Classification Models for Higher Education Professional Courses
Published Online March 2016 in MECS
In the recent years, Data Mining is being used for extraction of implicit, previously unknown and useful from large scale unstructured complex data. Data mining techniques are applicable whenever a system is dealing with large scale data sets [1]. In the educational system, students and employees records such as – admission/enrollment details, course structures and eligibility criteria, course interest and students/teachers academic performances are important consideration to analyze various trends, since all the such data are now computerized information system so that, the data availability, modification and updation are a common process nowadays [2].
There are escalating research interests in using data mining in education field. This new promising field, called Educational Data Mining, which concerns with developing methods that discover knowledge from data originating from educational atmospheres [3]. Educational Data Mining uses many techniques such as classification algorithms, clustering algorithms, outlier detection methods etc.
One of the major challenges that the higher education faces today is predicting the performance of students and predicting the number of admissions for a specific course. Educational organizations would like to know, which students will enroll in particular course programs, and which students will need assistance in order to complete a specific course/degree [4].
In this work, we made an effective experimental attempt to classify large scale PGCET students’ data using data mining techniques. The structure and description of the PGCET students’ dataset is presented in section 2. To classify the dataset chosen, we used Decision Tree – Random Tree (RT) and Random Forest (RF) classification models which are built using WEKA. The PGCET students’ data are classified effectively, and the performance evaluation of each classification model (RT and RF) is analyzed.
The rest of the paper is organized as follows. The section 2 represents some related works which exist to prior the proposed work. The section 3 provides the structure of data account and proposed methodology. The section 4 predicts results using the classification models built with Random Tree and Random Forest classification algorithms. Also the section 4 provides performance evaluation metrics and result analysis. The conclusion and future work are discussed in the final section.
-
II. Related Works
As we know huge quantity of data is stored in educational database, so in order to get required data and to find the hidden relationship, different data mining approaches are implemented and being used. There are number of popular data mining task in associated with the educational data mining such as- handling missing data, classification, clustering, outlier detection, association rule, prediction, regression etc. The Educational data mining provides a set of techniques, which can help the educational system to overcome various academic issues. This section represents some related works which are implemented based on educational data mining theme.
The authors, Bhise R.B., Thorat S.S., and Supekar A.K. [2] have studied and introduced educational data mining by recitation step by step process using K-means clustering method technique. The different kinds of student evaluation factors like mid-term and final exam assignment are considered for their experiment. The proposed study of [2] is helpful for the teacher to reduced drop-out ratio to a considerable level and will improve the performance of students.
The authors Ogunde A. O and Ajibade D. A [3] proposed a new system model which predicts students’ graduation grades based on entry results data using the Iterative Dichotomiser 3 (ID3) decision tree concept. ID3 decision tree concept was used to train the data of the graduated students’ records. The knowledge represented in form of IF-THEN rules by extracting data from built decision trees. The trained students’ records were then used to construct a model for prediction of students’ graduation grades. The constructed system is useful in predicting students’ final graduation grades even at the time of admission into the university courses. This will help authority of educational organizations, staff, and academic planners to properly guidance students in order to improve their overall performance.
The authors Sonali Agarwal, G. N. Pandey, and M. D. Tiwari [4] have taken a student data from a community college database and different classification techniques have been carried out and comparative analyses of classification results have been made. In research work of authors [4] Support Vector Machines (SVM) are constructed with minimum root mean square error (RMSE) and better accuracy. The study of [4] also had a comparative analysis of all Support Vector Machine and Radial Basis Kernel type was found as a better selection for Support Vector Machine. A Decision tree approach was proposed which may be considered as an essential basis of selection of student throughout any course program. The work of [4] was intended to build up an assurance on Data Mining techniques so that the current education and business system may implement this as a strategic management tool.
The authors Brijesh Kumar Baradwaj and Saurabh Pal [5] used decision tree classification concept to evaluate student’s performance. By using this concept, the authors [5] have extracted knowledge that depicts students’ performance in the final semester examination. It helps in advance to identify the failures and students who need special consideration and allow the teacher to provide appropriate guidance and counseling.
The authors Sunita B Aher and Lobo [7] have done a survey on application of data mining in educational system and also analyzed results using WEKA tool. The authors [7] studied and worked how each of data mining techniques can be applied to education system effectively. The authors [7] analyzed the performance of final year UG Information Technology course students and presented the result using WEKA tool.
-
III. Proposed Technique
This section represents novel methodology of the proposed work. The large scale PGCET (Post Graduate Common Entrance Test) for professional courses MBA (master of Business Administration) and MCA (Master of Computer Application)-2014 dataset is collected from Rani Channamma University Belagavi, Karnataka-India, which had consortium for conduct PGCET in the year 2014. The structure of the dataset is described as follows: The size/weight of the dataset chosen is 14500. The dataset has 13 different attributes which are listed in Table 1
Table 1. Details of Attribute Descriptions
|
S.No |
Attribute |
Type |
Descriptions |
|
1 |
Exam Center |
Nominal |
11 distinct exam centers |
|
2 |
Course |
Nominal |
2 distinct courses |
|
3 |
Gender |
Nominal |
3 genders |
|
4 |
Category |
Nominal |
8 distinct categories |
|
5 |
NSS |
Nominal |
Eligibility for NSS quota |
|
6 |
Sports |
Nominal |
Eligibility for sports quota |
|
7 |
371J |
Nominal |
Eligibility for 371J quota |
|
8 |
Disabled |
Nominal |
Eligibility for Disabled quota |
|
9 |
Rural |
Nominal |
Eligibility for Rural quota |
|
10 |
KanMedium |
Nominal |
Eligibility for Kannada Medium quota |
|
11 |
Phy.Hand |
Nominal |
Eligibility for Disabled quota |
|
12 |
Rank |
Numeric |
Rank obtained in PGCET |
|
13 |
AdmitCat |
Nominal |
Admitted category for MBA/MCA course |
-
A) The attribute ‘Exam Center’ has 11 distinct exam centers, and each exam center’s weights represents, the number of students wrote PGCET in that particular exam center. The class labels and weights of the attribute ‘Exam Center’ is listed in Table 2.
Table 2. Weights of ‘Exam Center’ Class Labels
|
S.No |
Class Labels |
Weights |
|
1 |
Bangaluru |
4760 |
|
2 |
Belagavi |
883 |
|
3 |
Bellary |
476 |
|
4 |
Bijapur |
475 |
|
5 |
Davanagere |
891 |
|
6 |
Dharwad |
1307 |
|
7 |
Gulbarga |
1584 |
|
8 |
Mangalore |
866 |
|
9 |
Mysore |
1966 |
|
10 |
Shimoga |
926 |
|
11 |
Tumkur |
366 |
-
B) The attribute ‘ Course ’ has two distinct class labels ie. - MBA and MCA. The weight of MBA is 10096 and weight of MCA is 4404.
-
C) The attribute ‘Gender’ has three class labels – ‘Male’, ‘Female’ and ‘Transgender’. The weight of ‘Male’ is 9107, the weight of ‘Female’ is 5392 and weight of transgender is found 1.
-
D) The attribute ‘Category’ represents the various categories of the students based on Government of India/Karnataka norms. There are 8 prescribed categories which are listed in Table 3.
Table 3. Class Labels and Weights of ‘Category’
|
S.No |
Class Labels |
Weights |
|
1 |
GM |
4747 |
|
2 |
SC |
1597 |
|
3 |
ST |
2281 |
|
4 |
Category-1 |
2076 |
|
5 |
2-A |
993 |
|
6 |
2-B |
1756 |
|
7 |
3-A |
663 |
|
8 |
3-B |
417 |
-
E) The attributes, NSS, 371J, Sports, Disabled, Rural, KanMedium and Phy.Hand have only two class labels- ‘Yes’ and ‘No’. The weights of these class labels are represented in Table 4. These attributes represents special reservation given by the government for the admission of MBA/MCA courses.
Table 4. Weights of Different Attributes
|
Attributes |
Weights of Class Labels |
|
|
‘Yes’ |
‘Yes’ |
|
|
NSS |
859 |
13641 |
|
Sports |
290 |
14210 |
|
371J |
1395 |
13105 |
|
Disabled |
51 |
14449 |
|
Rural |
2692 |
11808 |
|
KanMedium |
3804 |
10696 |
|
Phy.Hand |
33 |
14467 |
-
F) The attribute rank represents, ranking obtained by the each student in the examination of PGCET for the admission of MBA/MCA courses.
-
G) Finally, the attribute ‘ AdmitCat ’ represents the number of admissions taken in 18 distinct admission categories which are prescribed by the Government of India/Karnataka. The details of the attribute AdmitCat is represented in Table 5.
-
3.1. Random Tree Classification Model
Table 5. Details of the Attribute ‘Admitcat’
|
S.No |
Category Class Labels |
Admitted students |
|
1 |
GM-G |
5102 |
|
2 |
GM-H |
227 |
|
3 |
SC-G |
491 |
|
4 |
SC-H |
19 |
|
5 |
ST-G |
99 |
|
6 |
ST-H |
2 |
|
7 |
C1-G |
164 |
|
8 |
C1-H |
9 |
|
9 |
2A-G |
609 |
|
10 |
2A-H |
17 |
|
11 |
2B-G |
162 |
|
12 |
2B-H |
6 |
|
13 |
3A-G |
185 |
|
14 |
3A-H |
2 |
|
15 |
3B-G |
259 |
|
16 |
3B-H |
16 |
|
17 |
SS-G |
748 |
|
18 |
PH-G |
14 |
The Random Decision Tree algorithm builds several decision trees randomly. When constructing each tree, the algorithm picks a "remaining" feature randomly at each node expansion without any purity function check such as- gini index, information gain etc. A categorical feature such as ‘ Course ’ is considered "remaining" if the same categorical feature of ‘ Course ’ has not been chosen before in a specific decision path starting from the root of tree to the present node. Once a categorical feature such as ‘ Course ’ is taken, it is useless to choose it once more on the same decision path because every pattern in the same path will have the same value (either MBA or MCA). On the other hand, a continuous feature such as ‘ Rank ’ can be selected more than once in the same decision path. Each moment the continuous feature is selected, a random threshold is chosen.
A tree stops growing any deeper if one of the following conditions is met:
-
a) There are no more examples to split in the current node or a node becomes empty
-
b) The depth of tree goes beyond some limitations.
Each node belongs to a random tree records class distribution. In accordance with our PGCET dataset, assume that the root node of a random tree has a total of 14500 instances from the training data. Among these 14500 instances, 10096 of them are ‘MBA’ and 4404 of them are ‘MCA’.
Then the class probability distribution for ‘MBA’ is
P (MBA | x) = 10096/14500 = 0.696
And the class probability distribution for MCA is
P (MCA | x) = 4404/14500 = 0.304
The algorithm does not prune the randomly built decision tree in the conventional sense such as -J48 pruning and cost-based pruning, and etc. But, it will remove "redundant/unnecessary" nodes. A node expansion is considered redundant/unnecessary, if none of its descendents have significantly dissimilar class distribution from this node. In such cases, the random tree classification model removes the growth from that specific node and will make the node as a leaf node. In this experiment, the random tree is built recursively and "necessity check" is carried out when the recursion returns.
The classification process is always done at the leaf node level. Each tree outputs a class probability distribution. The class distribution outputs from several trees are averaged as the final class distribution output. For illustration, assume that, there are two trees:
The tree 1 outputs:
P (MBA | x) = 10096/14500 = 0.696 and
P (MCA | x) = 4404/14500 = 0.304
And tree 2 outputs:
P (MBA | x) = 10000/14500 = 0.689 and
P (MCA | x) = 4500/14500 = 0.310.
The averaged probability output will be:
P (MBA | x) = (0.696+ 0.689)/2 = 0.692, and P (MCA | x) = (0.304+ 0.310)/2 = 0.307.
In some cases, a leaf node may be unfilled or empty. In such situations, the Random Tree classification model will output 0 as the class probability distribution.
In order to predict final class distribution (class label), a loss function is necessary. For example, in this experiment, we predict class label MBA if and only if P (MBA | x) >= 0.5 . That is, in order to predict final class distribution, the threshold point is taken as 0.5.
-
3.2. Random Forest Classification Model
Random Forest classification model constructs many classification trees. For the classification of a new instance from an input vector space (dataset), put the input vector down each of the trees in the forest. Each tree will gives a classification (votes). The forest chooses the classification having the majority votes among over all the trees generated the forest.
Each tree will be constructed as follows:
-
a) If the total number of cases in the training set is X, then sample the X cases in random path - but with substitution/replacement , from the original data set. This sample is considered as the training set for growing the tree.
-
b) If there exists Y input variables, then y<
-
c) Each tree is grown to the biggest possible level. There is no pruning possible in this approach.
The Random Forest Classification error rate depends on the following two facts:
-
i. The correlation coefficient between any two trees in the forest. Increasing in the correlation between any two trees in the forest will lead to the increase in the error rate of the classification result.
-
ii. The strength of each tree (individual) in the forest. A tree with a low error rate is a strong classifier in the forest. Increasing the strength of the individual trees will lead to decrease in the forest error rate.
Decreasing y reduces both the correlation and the strength. Increasing in y increases both. We can find somewhere in between is an "optimal" range of y -usually quite wide.
-
IV. Results and Discussions
The Random Tree and J48 classification models are built using 10 cross validation folds. To test the considered classification models for the experiment, 14500 instances are taken and preprocessed using WEKA tool. The Table 6 represents result obtained by the Random Tree and Random Forest classification models.
The results describes performance evaluation metrics such as- correctly classified instances, incorrectly classified instances, Precision (P), Recall (R), F-Score (F). Out of 14500 test instances, 14278 instances are correctly classified, and 222 instances are incorrectly classified by the Random Tree (RT) classifier. The remaining performance evaluation metrics Precision, Recall and F-Score are considerably found good. Similarly, Out of 14500 test instances, 14291 instances are correctly classified and 209 instances are incorrectly classified by the Random Forest (RF) classifier. Also, the remaining performance evaluation metrics such as Precision, Recall and F-Score are found good as compared to Random Tree classifier. The classifier errors of RT and RF classification models are represented in Fig.1 and Fig.2 respectively.
Table 6. Classification Results
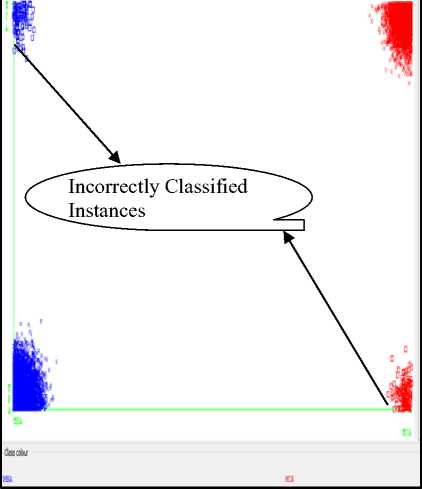
Fig.1. Classification Errors of RT Model
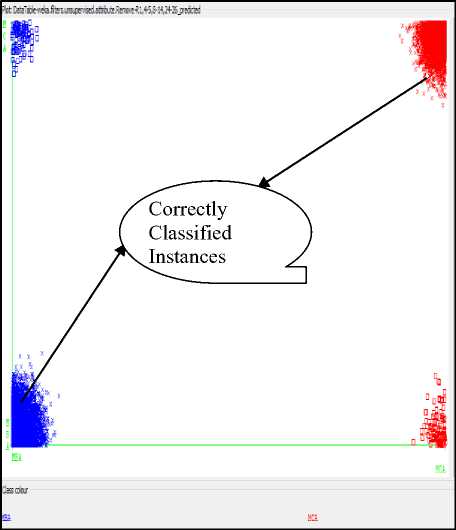
Fig.2. Classification Errors of RF Model
Table 7. Confusion Matrix
|
RT Classifier a b ^ Classified as 9998 98 | a=MBA 124 4280 | b=MCA |
RF Classifier a b ^ Classified as 9999 97 | a=MBA 112 4292 | b=MCA |
The Table 7 represents confusion matrix obtained by the result of Random Tree and Random Forest classification models. The presented confusion matrix has two class labels, namely ‘a’ and ‘b’. The class label ‘a’ corresponds to ‘MBA’, and the class label ‘b’ corresponds to ‘MCA’ in concerned with students’ admission context.
The classification accuracy rate is comparatively same in the result of Random Tree and Random Forest classification. During the classification using Random Tree model, 9998 test instances which are belongs to the class ‘MBA’ were correctly classified, and 98 instances of the class ‘MBA’ were incorrectly classified as ‘MCA’. Also, 4280 instances which are belong to the class ‘MCA’ were correctly classified, and 124 instances were incorrectly classified as ‘MBA’.
The classification accuracy rate is comparatively slightly high in the result of Random Forest classification. During the classification using Random Forest model, 9999 test instances which are belongs to the class ‘MBA’ were correctly classified, and 97 instances of the class ‘MBA’ were incorrectly classified as ‘MCA’. Also, 4292 instances which are belong to the class ‘MCA’ were correctly classified, and 112 instances were incorrectly classified as ‘MBA’. The analysis of misclassification rate is described in the Table 8.
Table 8. Misclassification Rate of RT and RF Classification Models
|
Classification Model |
Misclassification Rate |
|
|
‘MBA’ |
‘MCA’ |
|
|
Random Tree |
0.96 % |
0.96 % |
|
Random Forest |
2.8 % |
2.5 % |
The experimental results reflect some of the following inferences: In Table 7, the confusion matrix shows that, the class label ‘MBA’ is has low error rate which is approximately 0.9% as compared to the class label ‘MCA’ which has error rate between 2% to 3% as shown in the Table 8. This is because- the class label ‘MBA’ has larger in number as compared to the class label ‘MCA’, which will lead to reduce in the error rate. However, due to this fact, the error rate of the class label ‘MCA’ is comparatively negligible. Further, the MBA students are more determined than MCA students in the selection of geographical region and colleges. The both Random Tree and Random Forest classification models have comparatively high accuracy rate on the classification of instances which are belongs to both the class ‘MBA’ and ‘MCA’.
The Fig. 3 represents schematic part of classification tree obtained by the Random tree classifier. The misclassification rate of the class label ‘MCA’ is high as compared to misclassification rate of class label ‘MBA’.
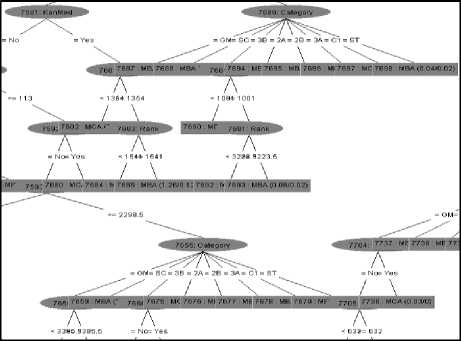
Fig.3. Classification Tree Obtained By the Random Tree Classifier.
-
V. Conclusion and Future Directions
Educational data mining is recognized as one of the emerging research trend nowadays. In this work, under the educational data mining theme we made an effective attempt to classify students admission towards professional courses such as MBA (Master of Business Administration) and MCA (master of Computer Application). The experimental results and analysis shows that, in Karnataka state (India) nowadays the MBA course attracting more number of students as compared to MCA course. Hence, those educational organizations who offers MBA course, should concentrate on increasing the infrastructure as well as course equipments. And those educational organizations who offers MCA course should increase their academic quality as well as should try to bring employment placements in technical industries.
In this experiment, we have used two algorithms-Random Tree and Random Forest to build classification models using Decision Tree concept. The accuracy of the considered classification models is considerably same. But, among these two classification models, the Random Forest classification model is found good as compared to Random Tree classification model.
Список литературы Educational Data Mining: RT and RF Classification Models for Higher Education Professional Courses
- Ryan S.J.d. Baker, "Data Mining for Education". International Encyclopedia of Education (3rd edition). Oxford, UK: Elsevier 2010.
- Bhise R.B., Thorat S.S., and Supekar A.K, "Importance of Data Mining in Higher Education System", IOSR Journal Of Humanities And Social Science (IOSR-JHSS), Jan-Feb, 2013.
- Ogunde A. O and Ajibade D. A. ," A Data Mining System for Predicting University Students' Graduation Grades Using ID3 Decision Tree Algorithm ". Journal of Computer Science and Information Technology
- Sonali Agarwal, G. N. Pandey, and M. D. Tiwari, "Data Mining in Education: Data Classification and Decision Tree Approach", International Journal of e-Education, e-Business, e-Management and e-Learning, Vol. 2, No. 2, April 2012.
- Brijesh Kumar Baradwaj and Saurabh Pal, "Mining Educational Data to Analyze Students Performance", International Journal of Advanced Computer Science and Applications, 2011.
- Jing Luan, "Data Mining Applications in Higher Eduacation", SPSS publications.
- Sunita B Aher and Lobo, "Data Mining in Educational System using WEKA", International Conference on Emerging Technology Trends (ICETT) 2011.
- Monika Goyal and Rajan Vohra, "Applications of Data Mining in Higher Education", International Journal of Computer Science Issues, Vol. 9, Issue 2, No 1, March 2012.
- M. Durairaj, C. Vijitha, "Educational Data mining for Prediction of Student Performance Using Clustering Algorithms", International Journal of Computer Science and Information Technologies, Vol. 5 (4) , 2014, 5987-5991
- Naeimeh DELAVARI, Somnuk PHON-AMNUAISUK, Mohammad Reza BEIKZADEH, "Data Mining Application in Higher Learning Institutions", Informatics in Education, 2008, Vol. 7, No. 1, 31–54
- Romero, C.Ventura, S. and Garcia, "Data mining in course management systems: Model case study and Tutorial". Computers & Education,Vol. 51, No. 1. pp.368- 384. 2008.
- Samrat Singh and Dr. Vikesh Kumar, "Performance analysis of Engineering Students for Recruitment Using Classification Techniques", IJCSET February 2013 Vol 3, Issue 2, 31-37.
- Romero,C. and Ventura, S. ,"Educational data Mining: A Survey from 1995 to 2005".Expert Systems with Applications (33) 135-146. 2007.
- Jai Ruby and Dr. K. David, "Analysis of Influencing Factors in Predicting Students Performance Using MLP –AComparative Study", 10.15680/ijircce.2015.0302070.
- Ritika Saxena, "Educational data Mining: Performance Evaluation of Decision Tree and Clustering Techniques using WEKA Platform", International Journal of Computer Science and Business Informatics, MARCH 2015.
- M.I. López, J.M Luna, C. Romero and S. Ventura, "Classification via clustering for predicting final marks based on student participation in forums" Regional Government of Andalusia and the Spanish Ministry of Science and Technology projects.
- Sunita B Aher and Mr. LOBO L.M.R.J, "Data Mining in Educational System using WEKA", International Conference on Emerging Technology Trends (ICETT) 2011.
- Siddu p. Algur and Prashant Bhat, "Metadata Based Classification and Analysis of Large Scale Web Videos", Interanational Journal of Emerging Trends and Technologies, May-June, 2015.
- Srecko Natek and Moti Zwilling, "Data Mining For Small Student Data Set – Knowledge Management System For Higher Education Teachers", Knowledge Management and Innovation, International Conference, 2013.
- Dorina Kabakchieva, "Predicting Student Performance by Using Data Mining Methods for Classification", Cybernetics And Information Technologies, Volume 13, No 1, 2013.
