Educational performance analytics of undergraduate business students

Author: Md Rifatul Islam Rifat, Abdullah Al Imran, A. S. M. Badrudduza
Journal: International Journal of Modern Education and Computer Science @ijmecs
Article in issue: 7 vol.11, 2019.
Free access
Educational data mining (EDM) is an emerging interdisciplinary research area concerned with analyzing and studying data from academic databases to better understand the students and the educational settings. In most of the Asian countries, it is a challenging task to perform EDM due to the diverse characteristics of the educational data. In this study, we have performed students’ educational performance prediction, pattern analysis and proposed a generalized framework to perform rigorous educational analytics. To validate our proposed framework, we have also conducted extensive experiments on a real-world dataset that has been prepared by the transcript data of the students from the Marketing department of a renowned university in Bangladesh. We have applied six state-of-the-art classification algorithms on our dataset for the prediction task where the Random Forest model outperforms the other models with accuracy 94.1%. For pattern analysis, a tree diagram has been generated from the Decision Tree model.
Educational Data Mining, Classification, Knowledge Extraction, Random Forest
Short address: https://sciup.org/15016865
IDR: 15016865 | DOI: 10.5815/ijmecs.2019.07.05
Text of the scientific article Educational performance analytics of undergraduate business students
Published Online July 2019 in MECS DOI: 10.5815/ijmecs.2019.07.05
Education is the pilot of a nation and so the institutes that are providing higher education have the challenge to improve the performance of the students. Over the last two decades, many prominent researchers are exploring the educational data and trying to improve the quality of the education, performance of the students and trying to build up an ideal educational system [1].
To extract the pattern of students’ performance, nowadays, the extensively employed process is data mining and analytics. Data mining uses computational approaches to mine a large dataset to discover patterns and establish relationships to solve a particular problem. More specifically, it is an information extraction activity to identify the concealed facts contained in dataset involving methods at the intersection of machine learning, statistics, and artificial intelligence [2].
The increasing emphasis on data mining in the educational sector has developed a novel emerging research field called Educational Data Mining (EDM). It is concerned with the analysis of the educational data that are originated from the educational environments [3]. There exist several data mining approaches that are usually used in EDM such as Classification, Regression, Time Series Analysis, Clustering, Association Rule Mining, and Neural Networks.
The purpose of this paper is to analyze the educational data originated from students’ transcript and predict their performance so that they can take proper steps at right time to fulfil their expectation. Here, we have made the use of educational dataset that is prepared from the students’ transcript data of business students of a renowned university in Bangladesh. However, the prediction of students’ performance exclusively cannot elevate the quality of the teaching process and also not improve the performance of the students. So, we have also performed some analysis to find patterns and relationships in the data such as find out the most impactful courses for the final outcome. To make the whole analytical process sustainable, we have proposed a generalized framework by which the educational advisors will be susceptible to achieve the knowledge of how to improve students in academics and how to design the course’s content in an organized manner.
In accordance with the proposed framework, firstly, we have applied several classification techniques to predict the final output level of the students based on their grades in the academic courses included in the first four semesters. Classification is one of the most frequently used supervised machine learning technique that is used to predict categorical class labels for each case in data [4]. We have applied six extensively used classification algorithms namely Gradient Boosted Tree, Random Forest, Tree Ensemble, Decision Tree, SVM and KNN on our dataset all of which are yield higher accuracy and the Random Forest model outperforms the other models with the highest accuracy (=94.1%). Secondly, we have generated a tree diagram by applying the decision tree algorithm to reclaim the significant hidden patterns in the data.
-
II. Related Work
Over the past two decades, numerous studies have been conducted in the discipline of education. However, in recent years, most research in this discipline has emphasized the use of data mining techniques and some authors applied several types of machine learning methods to predict the performance of the students, select the optimized features for prediction, and discover the concealed pattern in the educational data. In this phase, we are going to briefly discuss some of the latest and relevant studies.
The authors Al-Barrak et al. [5] used Decision Trees to predict student’s final GPA using only the grades of the previous courses. They collected the dataset included students’ final GPA and grades in all courses from the students’ transcript but their focus was only on the mandatory courses. They discretized the numerical value of the student’s grade into categorical and grouped that indicated a high level of grade inflation. To discover the classification rules, they applied the J48 decision tree algorithm. They have also found out some relation between the course and GPA that has an impact on the final outcome. Sumitha et al. [6] have proposed a framework for predicting students' outcome in which the K-mean Clustering algorithm is used to analyze and classify students’ details based on academic records. Among the 24 attributes, the most appropriate attributes selected by the ranking analysis were CGPA, Arrears, Attendance, 12 marks, Engineering Cut-off, Medium of Education, and Type of Board. In their study, they predicted the students’ performance by comparative analysis of efficient classification algorithms namely Naive Bayes, Multilayer perceptron, SMO, J48, REP tree and obtained a high influence using J48 with accuracy 97%.
If anything goes wrong with the sample then it is reflected in the final result at first-hand. Mueen et al. [7] applied the sampling technique SMOTE as their collected data were imbalanced. To select the appropriate attributes that have a greater impact on the output variable they applied the ranking algorithm. Three classifiers namely Naive Bayes, Multilayer perceptron, and C4.5 (J48) were tested on 38 attributes to predict and analyze students' academic performance and they used 10-fold crossvalidation to train up the model. The performance of the classifier was evaluated and compared by using the evaluation metrics: accuracy, precision, recall, and specificity and Naive Bayes outperforms the other two with the highest accuracy (= 86%).
An empirical study on attribute selection has been conducted and the authors proposed a small attribute set, namely student data feature set (SDFS) by using both filter and wrapper methods [8]. The proposed SDFS consist of ‘internal grades’, ‘previous failure’, ‘internet usage hours’, ‘health condition’, ‘attendance percentage’, and ‘family relation quality’ and it is found that only these six features of student data are sufficient to make accurate predictions of student grades. As aforementioned authors Mueen et al. [7], they also applied the sampling technique SMOTE for handling the class imbalance problem to improve the performance of the classification model. To examine their proposed minimal feature set they applied three classification algorithms namely Naive Bayes, RBF, and SVM and found higher accuracy.
As the aforecited paper [6], an identical study had been conducted where the prominent authors proposed an integrated system framework which is also multidimensional and focused on the comprehensive approach for the better prediction efficiency of the students’ academic performance [10]. They mentioned six variable domains (psychological, cognitive, Economical, personality, demographic and institutional domains) in their framework that has a great influence on student performance. Their architectural framework composed of three layers: the user interface layer, the database system layer, and the execution or expert system layer.
A comparative analysis between two neural network models (Multilayer Perceptron and Generalized Regression Neural Network) was performed to identify which model is best for predicting students’ academic performance based only on the academic result [11, 12]. The authors split the dataset into three portions (60:20:20), 60% as the training dataset, 20% as validation dataset, and 20% as the testing dataset. In this paper, authors used performance metrics; Mean square error (MSE), Receiver operating characteristic (ROC) and Accuracy to evaluate the performance and compare the models to identify the most appropriate ones for predicting students’ academic performance. They used six networks of different spread parameters such as 0.35,
0.45, 0.55, 0.65, 0.75, and 0.85 for attaining desired estimation accuracy and the best GRNN network was achieved with spread parameter 0.45. However, the GRNN model was found as a better model than MP with an accuracy of 95%.
Using a few labelled and many unlabeled data the semi-supervised algorithms can improve the classification accuracy [13]. The authors of this study examined the effectiveness of two wrapper-based semi-supervised approaches namely self-training and yet another Two Stage Idea (YATSI) for predicting students’ performance in the final examination. They evaluated the performance of the supervised classification techniques naive Bayes, Sequential Minimal Optimization (SMO), C4.5, multilayer perceptron (MLP), RIPPER algorithm and corresponding Self-trained learning and YATSI counterparts. They found that the performance with selftraining of NB, SMO, and C4.5 was improved by 4.1% to 5.2% with respect to supervised learning while for MLP and JRip, the classification performance is significantly improved up to 9.4% to 9.7%.
The ensemble learning is a machine learning paradigm that combines the multiple base models to solve a particular computational intelligence problem [14]. The researchers Kostopoulos et al., [15] proposed an ensemble of classification and regression algorithms for predicting students’ performance in a distance web-based course and showed that their proposed model performed better than the base models even if the conventional ensemble methods. They combined the REPTree classification algorithm and the M5’ rules regression algorithm and the tentative results pointed out that the students at risk could be identified before the middle of the academic year with an accuracy of 82.25%.
But there exists no study that have conducted to predict the outcome of the business students. That is why, we have aimed to propose a generalized model that performs well on the business students’ data.
-
III. Problem Statements
In most of the Asian countries like Bangladesh, there exist three different cases in the performance of a student during their undergraduate period such as:
-
• Some students perform better in the commencing period but worse in the ending period.
-
• Some perform worse in the commencing period but better at the ending period.
-
• A few students who always perform better or worse.
Thus, it makes difficulties for teachers, course-advisers or instructors to identify the students who are at risk and to guide them properly. The prediction of the final academic outcome of students can help teachers, courseadvisers or instructors to identify the students at risk and guide them properly. Another non-trivial problem is that at the middle point of the graduation period some of the students become frustrated by thinking that if they eventually not be able to obtain their expected outcome and thus a possibility of fall out is created. The prediction of the final outcome will carry away their frustration and reinforce their mind to achieve their expected outcome. Again, not only the prediction of the final outcome but also the pattern identification is required in order to solve this problem. The identification of the most impactful courses, that have a major impact on the final outcome, will be very helpful for the administration to allow them to focus more on those particular courses in order to help students pass it with the best grades and later graduate with a high CGPA.
Students’ transcript data are available to every educational institution, but because of the rapid vicissitudes and nonlinearities in their educational performance, it is difficult to predict the final CGPA and identify the hidden facts. Thus, to handle the aforementioned problems, we have proposed a generalized framework.
-
IV. Solution Steps
To solve the problems mentioned in the previous section, we have proposed a framework where we partitioned the whole experiment into three sequential segments. At the first step, the raw data is collected and then passes through the preprocessing section that includes missing value handling, labelling the instances, transformation, and feature engineering. At the second step, the classifiers namely Gradient Boosted Tree, Decision Tree, Random Forest, Tree ensemble, SVM, and KNN are applied on the preprocessed dataset to train up the model and also generate a tree diagram by a decision tree learner. Finally, at the third step, the prediction is performed and patterns are identified from the tree diagram to make an efficient report. Fig. 1 shows the proposed framework.
-
V. Dataset Preparation And Description
-
A. Data collection
In this study, we have worked with a real-world dataset that is prepared by the students’ transcript data of business students collected from the Marketing department of a renowned university in Bangladesh. We have collected the transcript data of the students who have already completed their graduation in 2013, 2014, 2015, and 2016 and the total number of instances was 398. The collected data have been manually processed and organized in a Google spreadsheet.
-
B. Description of the attributes
Our prepared dataset contains the attributes regarding each of the students are Student name, Student ID, Gender, All the courses including course’ grade, Semester GPA, State of the students based on semester GPA, and final CGPA. The course codes are 101(c), 102(c), 103(c), 104(c), 105(c), 111(c),112(c), 113(c), 114(c), 115, 201, 202(c), 203(c), 204(c), 205, 211(c), 212, 213, 214, 215, 301(c), 302, 303(c), 304, 305, 311, 312,
-
313, 314, 315, 401, 402, 403, 404, 405, 411, 412, 413, 414, 415. The detail about the courses can be found at [16]. For the modelling purpose, we have ignored the irrelevant attributes such as Student name and Student ID.
-
C. Data preprocessing
During this phase, according to our proposed framework, we have applied the following preprocessing tasks on the raw dataset to prepare it suitable for our experiment.
-
• Missing value handling: Real world data often contains some missing values that are usually cleaned in the data pre-processing phase of the experiment. And, we have eliminated the missing instances by filtering and the total number of remaining instances is 372.

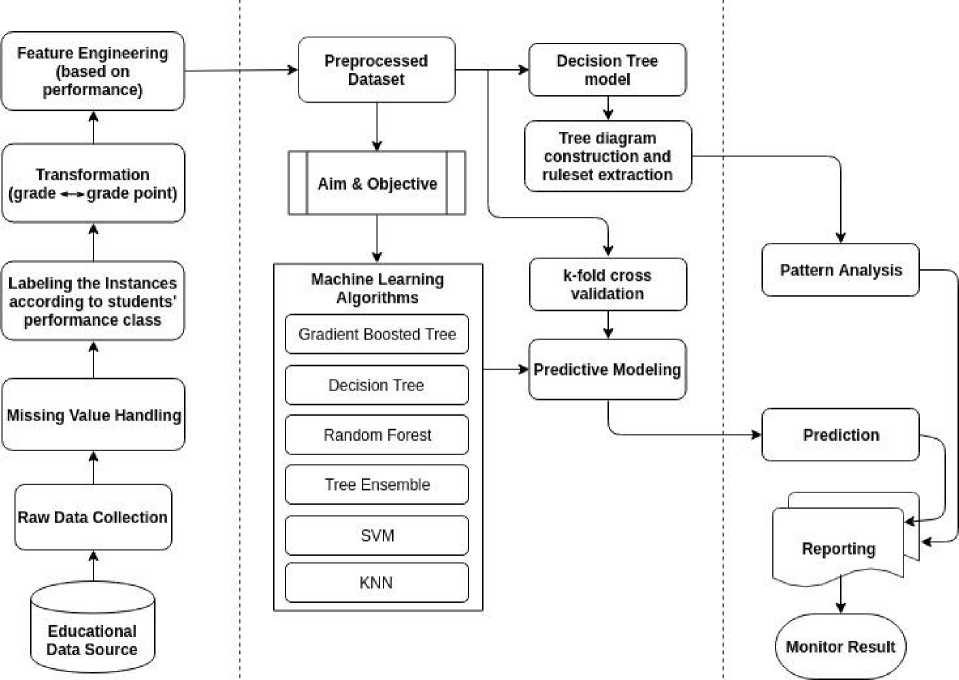
Fig.1. Proposed Framework.
-
• Labelling the instances as output column: To classify the students’ performance, we have created a target column by labelling each of the students according to their performance classes such as Honors, First class, and Second class based on the final CGPA of the students. Among the 372 instances in our dataset, only 10 are attained honors, 27 are attained first class, and 335 are attained second class. Table 1 shows the labels with the corresponding CGPA predefined by the university.
Table 1. Performance Classes with Minimum CGPA
|
Class |
Minimum CGPA |
|
Honors |
3.75 |
|
First Class |
3.00 |
|
Second Class |
2.20 |
-
• Versioning and transforming the dataset: We have prepared two versions of the dataset: one is a dataset with courses in grade and another is a dataset with courses in grade point. In order to identify the patterns, we have applied the first version of the dataset, named “courses in grade” and to predict the class of the students, we have applied the second version of the dataset, named “courses in grade point”. As our collected data contains the grades, we have converted all the grades with its corresponding grade point to create the second version of the existing dataset. Table 2 shows the grades with its corresponding grade point.
Table 2. Grades with the Corresponding Grade Point
Grade
Grade Point
Grade
Grade Point
A+
4.00
B-
2.75
A
3.75
C+
2.50
A-
3.50
C
2.25
B+
3.25
D
2.00
B
3.00
F
0.00
Table 3. GPA Range for Every Defined State
GPA
Terminology
3.5 or above
Excellent
3.00 to less than 3.50
Very Good
2.50 to less than 3.00
Good
Less than 2.5
At Risk
-
• Feature Engineering: Feature Engineering is the process of developing a new feature subset by using the existing features [17]. We have expanded the total number of attributes that were present in our raw data using feature engineering process. By this process, we have created a new feature set that indicates the state of a student after completing each of the semesters on the basis of their GPA of that semester. However, to imply the state of the students, we have used four terminologies: “excellent”, “very good”, “good” and “at risk” in accordance with Table 3.
-
VI. Methodology
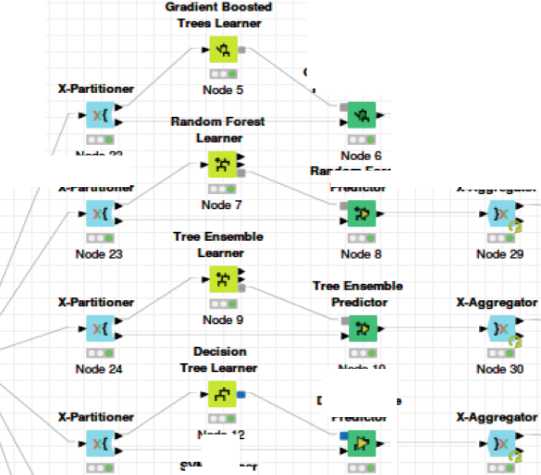
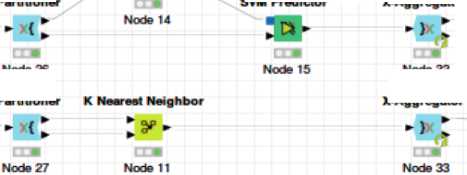
Many open source tools are available to implement the data mining algorithms such as the KNIME, WEKA, and Orange. In this study, to conduct our experiment, we have used the data mining tool named KNIME, the Konstanz Information Miner. We have chosen this tool as it is a free and open-source data analytics platform and the teachers or educational instructors can use it more easily. Fig. 2 shows the visual workflow that we have implemented on KNIME.
X-Aggregator
}
Node 28
X-Aggregator
Gradient Boosted Trees Predictor
Rule-baaed File Reader Row Filter Column filter
Q, „ . -* „ „ ф „
Node 1 Node 2 Node 3
Node 12
SVM Learner
Node 25
Node 13
Node 31
^
Node 22
X-Partitioner
Random Forest
Predictor
Node 10
Decision Tree Predictor
X-Partitioner
SVM Predictor
X-Aggregator
Node 26
Node 32
X-Partitioner
X-Aggregator
Scorer
d»*
Node 16
Scorer
H^e
Node 17
Scorer
d^e
Node 18
d»*
Node 19
d»*
Node 20
d»*
Node 21
Fig.2. Workflow of the classification implemented on KNIME.
-
A. Data Partitioning
Data partitioning is the process of partitioning data into segments in order to properly access the whole dataset. In this study, we have used 10-fold cross-validation technique to evaluate the predictive model where the actual dataset is randomly partitioned into 10 subsets. Of the 10 subsets, a single is retained as the test set and the remaining nine subsets are used as training set. The process is then repeated for 10 times, with each of the 10 subsets used exactly once as the test set, and finally, the ten results are averaged to produce a single estimation. Fig. 3 represents the entire process of 10-fold crossvalidation.
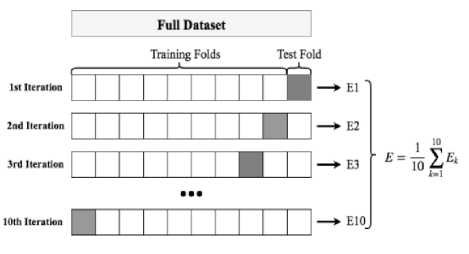
Fig.3. 10-fold cross-validation.
we have used the Gain Ratio as the split criteria and no pruning method have been used. If training dataset S split into к partitions and S j be the subset where j be the possible values of attribute A then,
SplitEntropy(S, A) = E j=i |^ log ^ (3)
and the Gain Ratio is defined as
GavnRatio =
Gain(S,A) SplitEntropy(S,A)
-
B. Classification Algorithms
Data partitioning is the process of partitioning data into segments in order to properly access the whole dataset. In this study, we have used 10-fold cross-validation.
-
• Gradient Boosted Tree: Gradient Boosted Tree [18] is a powerful machine learning technique for classification and regression problems. It uses a boosting algorithm, named gradient boosting, as a base learner with decision tree especially CART trees which produces a prediction model in the form of an ensemble of weak prediction models. Basically, boosting algorithm is a technique in which the subsequent predictors learn from the mistakes of the previous predictors to convert weak learners into strong learners. And, it takes fewer iterations to reach close to the actual predictions. The loss function can be calculated by the following equation given by
^,уР) = 1(У 1- у Г )2 (1)
Where, y ^ = Ith target value, yp = Ith prediction, and L(yl,yP') is the loss function. By applying the gradient descent algorithm and updating the predictions based on a learning rate it minimizes the loss function .
У^у Р + ^бЕ^Р2 (2)
Which becomes, yp = yp — а * 2 * E^ — y ? ) . Where, a is learning rate and (y i — yP) is the sum of residuals.
-
• Decision Tree (DT): Decision Tree [19] is one of the most popular machine learning algorithms
belongs to the family of supervised learning algorithms. Surprisingly, it works for both categorical and continuous dependent variables but mostly used for classification problems. The decision tree is a structure that includes a root node, branches, and leaf nodes. In this algorithm, the population or sample is split into two or more groups based on the most significant features so that the observations in the same group are homogeneous and the different groups are heterogeneous. To achieve this, the decision tree uses various techniques namely Gini Index, Gain Ratio, Chi-Square, entropy. In our study,
This algorithm can be run in multiple threads, and thus exploit multiple processors or cores and can be trained very fast as well.
-
• Random Forest (RF): Random Forest [20] is a very popular supervised ensemble learning method that is used for both classification and regression tasks. Basically, this algorithm is built as an ensemble of Decision Trees and is trained via the bagging method that is why it introduces more randomness and diversity as well as lower variance. During the training stage, it randomly takes multiple samples of the predictor space and each of the sampled subsets is used to construct a decision tree. To split the feature nodes, like the Decision Tree, it uses several techniques such as Gini Index, Information Gain as the splitting criterion. Then, in the test stage, each of the trees individually performs the prediction and finally, it chooses the classification having the most votes that means the most frequent class that is predicted by the individual trees. Due to the use of multiple decision trees the bias remains the same as that of a single decision tree and in contrast it decreases the variance as well as decreases the chance of overfitting. Moreover, it is also very useful for determining the feature importance.
-
• Tree Ensemble: Tree Ensemble [21] is a learning algorithm that strategically generated a set of classifiers whose individual decisions are combined to solve a computational intelligence problem. For splitting operation, it uses the Gini Index as the splitting criterion. It predicts the patterns in accordance with an aggregation of the predictions of the individual trees just like a random forest model.
-
• Support Vector Machine (SVM): Support Vector Machine [22] is a supervised machine learning method that is developed to solve the binary classification problems. In this algorithm, at the beginning of the training phase, each data item of the training dataset is plotted as a point in n-dimensional space, where n is the number of features and then transformed into a higher dimensional feature space by using a technique called the kernel trick. In this technique, SVM uses a set of mathematical functions that are defined by the kernel and the most common kernels used in SVM are: linear, nonlinear, polynomial, radial basis function (RBF), and sigmoid.
The generalized form of the kernel can be written as
К(Х1.Х , ) = ф(Х1).ф(Х!) (5)
In our study, we have applied the polynomial kernel which is defined, in mathematically, by
Where d is the degree of the polynomial. Then, based on the transformation, it searches for an optimal separating hyperplane that is farthest from the nearest support vectors to separate the different classes in high dimensional feature space. In the test phase, unknown samples are classified based on the position with respect to the hyperplane. A separating hyperplane can be written as
ТУ.Х + Ь = 0 (7)
-
• K-Nearest Neighbors (KNN): KNN [23] is one of the most popular supervised learning approaches used for both classification and regression problems but more extensively used for classification problems. It is a non-parametric method that stores all available cases of the training dataset and classifies new cases by a majority vote of its k neighbours. In the test phase, a new case is assigned to the class that is the most common amongst its K nearest neighbours and measured by a distance function. The distance functions that are used in KNN are Euclidean, Manhattan, Minkowski, and Hamming distance where the first three are used for continuous variables and the fourth one for categorical variables. And thus, in this study, the Hamming distance has been used as a metric that can be defined by
D(x,y) ^^Jx-yd ( 8)
Where, x is the data point from the dataset and у is a new data point that needs to predict.
-
C. Discovering patterns
For the convenience of pattern analysis, we have applied the decision tree algorithm to construct a tree diagram as it gives a graphical view of the complex processing logic that leading the final output and also generates a rule set.
-
VII. Evaluation
To evaluate the performance of our predictive models, we have applied 6 different evaluation metrics, as follow:
TP
Precision =
TP+FP
Sensitivity (recall) =
TP
TP+FN
Specificity =
TN
TN+FP
(recallxprecision)
Fmeasure = 2 x--------——
(recall + precision)
л _ TP+TN
Accuracy =----------
J TP+FP+TN+FN
Cohen's Kappa = P o P e
1-P e
Where, p 0 is the relative observed agreement among accuracy, and pe is the hypothetical probability of chance agreement and TP, FP, TN, FN are obtained from the confusion matrix.
In our case, the only accuracy would not be a good measure because our dataset is not symmetric. So, we have also considered precision, sensitivity (recall), specificity, and F-measure for evaluating the performances for each of the single classes. Sensitivity (recall), and F-measure is considered as a good metric for the case of imbalanced data. However, for evaluating the overall performance of the models, we have considered Accuracy and Cohen's Kappa score.
-
VIII. Result and Analysis
-
A. Classification Algorithms
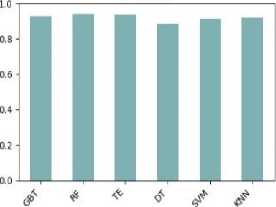
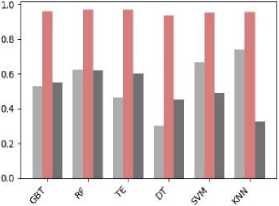
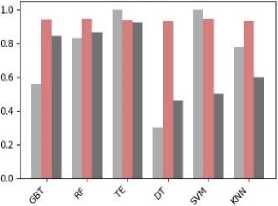
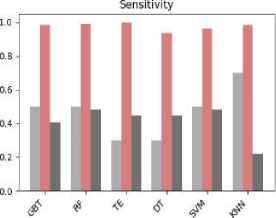
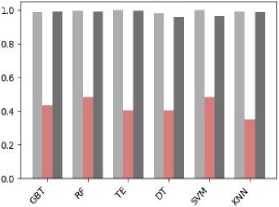
In this study, the dataset has been tested, compared, and analyzed with six different classification algorithms namely Gradient Boosted Tree (GBT), Random Forest (RF), Tree Ensemble (TE), Decision Tree (DT), SVM, KNN. These classification algorithms are tested on the second version of the dataset in order to predict the performance class of the students. Table 4 shows the classification performance of the models with different evaluation metrics.
From Table 4 it is apparent that all of the six models perform the classification with high accuracy. To compare the classification performance of the models more expressly, we have visualized the results in Fig. 4.
From Fig. 4, it can be observed that the random forest outperforms the other models with the highest accuracy (=94.1%). Moreover, the Random Forest also outperforms the other models with the best F-measure and sensitivity.
Table 4. Classification Performance of the Different Models
|
Precision |
Sensitivity |
Specificity |
F-measure |
Accuracy |
Cohen's Kappa |
||
|
Gradient Boosted Tree |
Honors |
0.556 |
0.500 |
0.989 |
0.526 |
0.927 |
0.515 |
|
First Class |
0.940 |
0.982 |
0.432 |
0.961 |
|||
|
Second Class |
0.846 |
0.407 |
0.994 |
0.550 |
|||
|
Random Forest |
Honors |
0.833 |
0.500 |
0.997 |
0.625 |
0.941 |
0.598 |
|
First Class |
0.946 |
0.991 |
0.486 |
0.968 |
|||
|
Second Class |
0.867 |
0.481 |
0.994 |
0.619 |
|||
|
Tree Ensemble |
Honors |
1.000 |
0.300 |
1.000 |
0.462 |
0.938 |
0.544 |
|
First Class |
0.938 |
0.997 |
0.405 |
0.967 |
|||
|
Second Class |
0.923 |
0.444 |
0.997 |
0.600 |
|||
|
Decision Tree |
Honors |
0.300 |
0.300 |
0.981 |
0.300 |
0.884 |
0.361 |
|
First Class |
0.935 |
0.937 |
0.405 |
0.936 |
|||
|
Second Class |
0.462 |
0.444 |
0.959 |
0.453 |
|||
|
SVM |
Honors |
1.000 |
0.500 |
1.000 |
0.667 |
0.914 |
0.491 |
|
First Class |
0.944 |
0.961 |
0.486 |
0.953 |
|||
|
Second Class |
0.500 |
0.481 |
0.962 |
0.491 |
|||
|
KNN |
Honors |
0.778 |
0.700 |
0.994 |
0.737 |
0.919 |
0.435 |
|
First Class |
0.932 |
0.982 |
0.351 |
0.956 |
|||
|
Second Class |
0.600 |
0.222 |
0.988 |
0.324 |
Accuracy
F-measure
Precision
Specificity
■ Honors ^B First Class ■! Second Class
Cohens Kappa
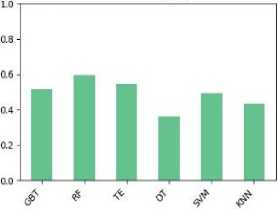
Fig.4. Performance plot of different classifiers for different evaluation metric.
-
B. Pattern Analysis
To find out the concealed patterns, we have constructed a tree diagram and also have generated a ruleset by using the decision tree model and our observations are:
-
• Among the 372 instances in our dataset, there exist only 10 instances who have obtained Honors as the final outcome. From the tree diagram and the ruleset, we have observed that among the 10 students there are 7 students obtained ‘A+’ in course ‘203(c)’ with 5 students received ‘A+’ in course ‘304’ as well.
-
• There are 335 students in our dataset who have obtained First class as the final outcome. Interestingly, among those students, 153 students have attained ‘A’ in course ‘203(c)’ among whom 63 students attained ‘A-’ in course ‘115’. Moreover, there exist more 90 students with First class who received ‘A-’ in ‘203’.
Therefore, we can conclude that course ‘203’ that means ‘Computer in Business’ is the most impactful course and most closely related to the final output.
-
C. Descriptive Analysis
We have constructed a feature set using four terminologies: ‘Excellent’, ‘Very Good’, ‘Good’, and ‘At Risk’, that already mentioned in above, to imply the state of the performance of the students based on their semester GPA. Here, we have analyzed the trend that how the number of students of each state changes with the semester. Fig. 5 shows the trend analysis between the states and the semesters for marketing department students.
From Fig. 5, it can be observed that the number of students who are attained ‘Excellent’ gradually increased with the number of the semester has been completed. In contrast, the number of students who attained other three states consistently declined but among these three states trend line of ‘Good’ declined more promptly than other two.
So, with the above circumstances, we can conclude that among the Bangladeshi business students the majority of students perform poor result in the commencing period.
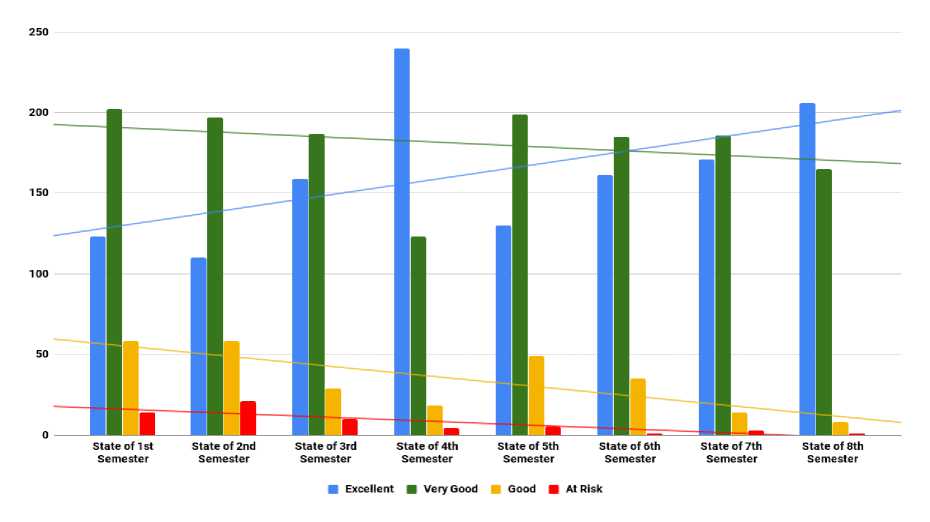
Fig.5. A trend analysis between states and semesters.
-
IX. Conclusion and Future work
The present study was designed to improve the performance of the undergraduate business students by prediction and pattern identification. In our study, we have proposed a framework that indisputably can help teachers, course-advisers or instructors to identify the students at risk and guide them properly. According to our proposed framework, we have also conducted an experiment for the business students in Bangladesh where we have applied six classification algorithms namely Gradient Boosted Tree, Random Forest, Tree Ensemble, Decision Tree, SVM, and KNN to predict the final outcome. Among these models, Random Forest outperforms the other models yielding the efficient output with an accuracy of 94.1%. This research has also identified that ‘Computer in Business’ is the most impactful course for the final outcome of business students and thus the teachers need to focus more on this particular course. Afterwards, we aim to extend this study by using the other data-mining technique such as clustering.
References Educational performance analytics of undergraduate business students
- Peña-Ayala, A., 2014. Educational data mining: A survey and a data mining-based analysis of recent works. Expert systems with applications, 41(4), pp.1432-1462.
- Hand, D.J., 2007. Principles of data mining. Drug safety, 30(7), pp.621-622.
- Sukhija, K., Jindal, M. and Aggarwal, N., 2016. Educational data mining towards knowledge engineering: a review state. International Journal of Management in Education, 10(1), pp.65-76.
- Phyu, T.N., 2009, March. Survey of classification techniques in data mining. In Proceedings of the International MultiConference of Engineers and Computer Scientists (Vol. 1, pp. 18-20).
- Al-Barrak, M.A. and Al-Razgan, M., 2016. Predicting students final GPA using decision trees: A case study. International Journal of Information and Education Technology, 6(7), p.528.
- Sumitha, R., Vinothkumar, E.S. and Scholar, P., 2016. Prediction of Students Outcome Using Data Mining Techniques. International Journal of Scientific Engineering and Applied Science (IJSEAS), 2(6), p.8.
- Mueen, A., Zafar, B. and Manzoor, U., 2016. Modeling and Predicting Students' Academic Performance Using Data Mining Techniques. International Journal of Modern Education and Computer Science, 8(11), p.36.
- Chaudhury, P. and Tripathy, H.K., 2017. An empirical study on attribute selection of student performance prediction model. International Journal of Learning Technology, 12(3), pp.241-252.
- Daud, A., Aljohani, N.R., Abbasi, R.A., Lytras, M.D., Abbas, F. and Alowibdi, J.S., 2017, April. Predicting student performance using advanced learning analytics. In Proceedings of the 26th International Conference on World Wide Web Companion (pp. 415-421). International World Wide Web Conferences Steering Committee.
- Adejo, O. and Connolly, T., 2017. AN INTEGRATED SYSTEM FRAMEWORK FOR PREDICTING STUDENTS’ ACADEMIC PERFORMANCE IN HIGHER EDUCATIONAL INSTITUTIONS. International Journal of Computer Science and Information Technology (IJCSIT), 9(3), pp.149-157.
- Iyanda, A.R., Ninan, O.D., Ajayi, A.O. and Anyabolu, O.G., 2018. Predicting Student Academic Performance in Computer Science Courses: A Comparison of Neural Network Models.
- R. Rifat, A. A. Imran, and Badrudduza, 2019. EduNet: A Deep Neural Network Approach for Predicting CGPA of Undergraduate Students.
- Livieris, I.E., Drakopoulou, K., Tampakas, V.T., Mikropoulos, T.A. and Pintelas, P., 2018. Predicting Secondary School Students' Performance Utilizing a Semi-supervised Learning Approach. Journal of Educational Computing Research, p.0735633117752614.
- Oza, N.C. and Russell, S., 2001. Online ensemble learning. University of California, Berkeley.
- Kostopoulos, G., Kotsiantis, S., Pierrakeas, C., Koutsonikos, G. and Gravvanis, G.A., 2018. Forecasting students' success in an open university. International Journal of Learning Technology, 13(1), pp.26-43.
- Department of Marketing [online] http://dept.ru.ac.bd/marketing/index.php/programs/bba (Accessed 05 February 2019).
- Turner, C.R., Fuggetta, A., Lavazza, L. and Wolf, A.L., 1999. A conceptual basis for feature engineering. Journal of Systems and Software, 49(1), pp.3-15.
- Ye, J., Chow, J.H., Chen, J. and Zheng, Z., 2009, November. Stochastic gradient boosted distributed decision trees. In Proceedings of the 18th ACM conference on Information and knowledge management (pp. 2061-2064). ACM.
- Quinlan, J.R., 1986. Induction of decision trees. Machine learning, 1(1), pp.81-106.
- Breiman, L., 2001. Random forests. Machine learning, 45(1), pp.5-32.
- Dietterich, T.G., 2000, June. Ensemble methods in machine learning. In International workshop on multiple classifier systems (pp. 1-15). Springer, Berlin, Heidelberg.
- Cristianini, N. and Shawe-Taylor, J., 2000. An introduction to support vector machines and other kernel-based learning methods. Cambridge university press.
- Cover, T. and Hart, P., 1967. Nearest neighbor pattern classification. IEEE transactions on information theory, 13(1), pp.21-27.
