EEG based Autism Diagnosis Using Regularized Fisher Linear Discriminant Analysis

Author: Mahmoud I. Kamel, Mohammed J. Alhaddad, Hussein M. Malibary, Khalid Thabit, Foud Dahlwi, Ebtehal A. Alsaggaf, Anas A. Hadi
Journal: International Journal of Image, Graphics and Signal Processing(IJIGSP) @ijigsp
Article in issue: 3 vol.4, 2012.
Free access
Diagnosis of autism is one of the difficult problems facing researchers. To reveal the discriminative pattern between autistic and normal children via electroencephalogram (EEG) analysis is a big challenge. The feature extraction is averaged Fast Fourier Transform (FFT) with the Regulated Fisher Linear Discriminant (RFLD) classifier. Gaussinaty condition for the optimality of Regulated Fisher Linear Discriminant (RFLD) has been achieved by a well-conditioned appropriate preprocessing of the data, as well as optimal shrinkage technique for the Lambda parameter. Winsorised Filtered Data gave the best result.
Electroencephalogram, Automated diagnosis, Autism, Regularized Fisher's linear discriminant analysis, Fast Fourier Transform
Short address: https://sciup.org/15012250
IDR: 15012250
Text of the scientific article EEG based Autism Diagnosis Using Regularized Fisher Linear Discriminant Analysis
Autism is a disorder rather than an organic disease and diagnosis of autism is one of the difficult problems facing researchers and those interested in the field of signal processing and medicine. Therefore, there is a lot of research going on around the world today trying to use neuroscience such as EEG study to identify individuals with autism. Hence, a need for automatic detection of EEG signals has been sought by many researchers to diagnose autistic people. Furthermore, they report different findings regarding to discriminat patterns between normal and autism disorders [1, 2].
Many cau s es of autis m have been p roposed, but understanding of the theory o f causation o f autism and the other autism spectrum dis o rders is incomplete [3]. In this case, the phenomeno l ogical mod e ls are most ap p ropriate to b e applied th a n the mecha n istic models. Mechanistic m odels typi c ally involv e physically interpretable p a rameters, all o w deeper insights into system perfor m ance and b e tter predicti o ns, but they require a priori information on the syst e m and often ne e d more time and resource s [4].
In recent years, there has been a n increasing interest in appl y ing machin e learning m e thods to the au t omated dete c tion of autis m EEG signa l s [5, 6]. EEG signals analysis based on ma c hine learnin g methods has three main step s : preprocess i ng, feature e x traction, and cl a ssification.
The major goal of th i s paper is t o utilize the Regularized F i sher’s Lin e ar Discriminat (RFLD)
analysis in detecting the autistic children based on EEG signal analysis. Thus, optimum preprocessing -which gives the highest classification accuracy- is studied. The artifacts of the recorded EEG signals were removed by visual inspection. Then, different preprocessing techniques were applied such as Re-referencing, Filtering, Winsorizing, Scaling, Single epoch extraction and Feature vector construction. After preprocessing, FFT was used as features. Dimensionality reduction using decimation factor 2 was applied. Finally, the extracted features were classified using RFLD.
This research is considered as part of the main BCI project in the King AbdulAziz University that is funded by (King AbdulAziz City for Science and Technology) KACST, 8-NAN106-3.
The layout of the paper is as follows. Section 2 focuses on the literature review, the experiments that were performed and the methods used for data preprocessing, feature extraction are described in section 3. Classification is given in section 4. Results are discussed in section 5.
-
II. Literature Review
One of the earliest Literatures that used the EEG and was tested with disabled subjects was described by Oberman, L.M., et al., .In their work, their results support the hypothesis of a dysfunctional mirror neuron system in high-functioning individuals with ASD [7]. Parallel to the work of Oberman, L.M., et al, neurofeedback (NFB) training were developed that used changes in mu brain-activity correlated to analysis the data by signal statistic. The results showed decreases in amplitude but increases in phase coherence in mu rhythms [8].
An analysis of EEG background activity in Autism was applied in work [9]. They used Fourier methods to extract EEG features and used k nearest neighbors (KNN) to classify the two groups. In addition their findings have 82.4% discriminate between normal and autistic subjects. They also applied their work at beta band and had the same accuracy classification 82.4% [9].
The significance of classification accuracy was measured by using different machine learning algorithms: the k-nearest neighbors (k-NN), SVM and naïve Bayesian classification (Bayes) algorithms with mMSE as a feature vector which described by William, B., T. Adrienne, and N. Charles [10]. They used Net Station software for acquisition data and Orange software for machine learning classification. Their accuracy classification is over 80% accuracy into control and high risk for autism HRA groups at age 9 months. Classification accuracy for boys was close to 100% at age 9 months and remains high (70% to 90%) at ages 12 and 18 months. For girls, classification accuracy was highest at age 6 months, but declines thereafter.
EEGLAB were used to extract evoked EEG features: raw EEG, CSD interpolated data, and back-projected IC features and also signal statistic was used to classify both groups. These data provide the first empirical demonstration of increased neural noise in those with ASD. Channel selection was based on an optimized electrode approach. Whereby the channel that showed the highest P1 amplitude [11]. However simple and robust RFLD was not used before in autism diagnosis [12]
-
III. Materials and methods
The whole process of methodologies used for automated diagnosis can be subdivided into a number of separated processing modules: Data Acquisition, preprocessing, feature extraction and classification.
-
A. Experiment and Data Acquisition
The model was conducted and tested with fifteen children from Saudi Arabia, Jeddah. It was done in the laboratory of King Abdulaziz University Hospital, where the EEG signals were recorded.
The procedure of experiment was follow:
-
• Subjects : The disorders consisted of eight children (5 boys and 3 girls, age 10–11 years). The control group consisted of four children (all of them are boys, age 10–11 years) without past or present neurological disorder.
Recordings : The recordings were made with the subjects in a relaxed state in order to obtain as many artifact-free EEG data as possible. The recording system consists of the following components: g.tec EEGcap, 16 Ag/AgCl electrodes, g.tec GAMMAbox, g.tec USBamp[13], and BCI2000 [14].
During the recording, the data were filtered using bandpass filter with frequency band (0.160) Hz and digitized at 256Hz. The notch filter was also used at 60Hz.
-
• Electrode selection : The ASD disorders have significantly values for discriminate between two subjects at electrodes FP1, F3, T5, F7, T3 and O1[2,9]. The electrodes which may give high accuracy were selected. The EEG were recorded using the international 10 – 20 system (channels FP1, FP2, F7, F3, Fz, F4, F8, T3, C4, Cz, C3, T5, Pz, O1, Oz and O2) with AFz as GND and right ear lobe as REF.
-
B. Data Preprocessing
-
1) Artifact Detection and removal : The artifacts of the recorded EEG signals were removed by visual inspection using BCI2000Viewer tool.
-
2) EEG Re-referencing : The selection of a suitable EEG reference can greatly influence the classification accuracy and sensitivity to artifacts. In this study we use common average referenced (CAR)[15].
-
3) Filters : A further software sixth order forward– backward Butterworth bandpass filter was used to filter the data with cut-off frequencies at 1.0 Hz and 30.0 Hz.
-
4) Winsorizing : Eye blinks, eye movement, muscle activity, or subject movement can cause large amplitude outliers in the EEG. To reduce the effects of such outliers, the data from each electrode were Winsorised.
-
5) Normalization : The samples from each
-
electrode were scaled to the interval [-1, 1].
-
6) Feature vector construction : The samples from the selected electrodes were concatenated into feature vectors. The dimensionality of the feature vectors was N c ×N s ×N e , where N c denotes the number of channels, N s denotes the number of temporal samples in one epoch and N e denotes the number of epochs. Due to the epoch duration of 1s and the 256Hz, N s always equals 256. Depending on the electrode configuration N c equals 16.
Table1. Shown the different combined preprocessing techniques of the EEG signal which were used.
TABLE 1. The different combined preprocessing techniques of the EEG signal
|
я s |
Е |
М я S я 5 |
я я |
|
|
Raw Data |
No |
No |
No |
No |
|
Ref Data |
Yes |
No |
No |
No |
|
Filtered Data |
No |
Yes |
No |
No |
|
Filtered Ref Data |
Yes |
Yes |
No |
No |
|
Norm Filtered Ref Data |
Yes |
Yes |
No |
Yes |
|
Norm Filtered Data |
No |
Yes |
No |
Yes |
|
Winsorised Filtered Data |
No |
Yes |
Yes |
No |
|
Norm Winsorised Data |
No |
No |
Yes |
Yes |
|
Winsorised Filtered Ref Data |
Yes |
Yes |
Yes |
No |
|
Norm Winsorised Filtered Ref Data |
Yes |
Yes |
Yes |
Yes |
-
C. feature extraction
FFT feature extraction technique was used.
-
• Data set : Artifact free data of 1276 sec. were selected from each normal and autistic children
groups. A big concatenated ma t rix is constru c ted with dimension N e ×N cs , where N e denotes the num b er of epochs of both No r mal and Au t ism whi c h equals 1276×2=2552, Ncs denotes the num b er of channels × the nu m ber of sam p les whi c h equals 16×256=4096.
-
• Ens e mble Averaging : Ensemble average is u sed
to t e st the effect of removin g white Gaus s ian noise on the accuracy.
-
• Fre q uency Features : the spect r al analysis i s an
imp o rtant method as the br a in is know n to generate task-dependent activity in relati v ely sma l l frequency bands. It is a b a sic mathema t ical tool based on the Fourier trans f orm allowin g the study of the signal frequenc y spectrum. We applied Fast Fourier Transfor m FFT metho d on each epoch.
The Fo u rier Transform is defined by the follo w ing equation:
X(f) = F {x(t)}= Г x(t)e^"dt (1)
- да
Where x (t) is the time domain s i gnal, X(f) is the FFT, and f is the frequency to analyze[16].
-
D. Feature selection
Due to the high dimension of ra w EEG data, the data were d o wnsampled from 256Hz to 128Hz. The downsampling were done for raw E E G data only. In FFT frequencies from 1~50Hz were selected.
-
IV. REGULARIZED FISHER LINEAR DISCRIMINAT ANALYSIS
For kn o wn Gaussian distributions with the s a me covariance m atrix for all classes, it c a n be shown that Linear Discriminant Analysis (LDA) is the opt i mal classifier in the sense that it mini m izes the ris k of misclassification for new samples dra w n from the s a me distributions [17].
Over the last decade several more sophisticated non-linear classification methods, like support vector Copyright © 2012 MECS machines and random forests, have been proposed, but it is wise to try linear ones first (of course using shrinkage estimation), Fisher’s method is still often used and performs well in many applications. Also, it is a linear combination of the measured variables, being easy to interpret [12]. The FLDA will choose w, which maximize:
T
J ( w ) = ' " (2) w Sw w
In FLDA, T he standard estimator fo r a covariance m a trix is the e mpirical cov a riance. This estimator is un b iased and ha s under usual conditions g o od properties. But for extreme cases of high - dimensional d ata with only a few data point s given- as o u r case - the e s timation may become imprec i se. This le ad s to a sys t ematic error: Large eigenvalues of the ori g inal covaria n ce matrix are estimated too la r ge, and smal l eigenvalues are estimated to o small; see F igure. 1. T h is error in t h e estimation degrades classif i cation perfo rm ance. Regu l arization is a common remed y for the syst e matic bias o f the estimated covariance matr i ces [18].
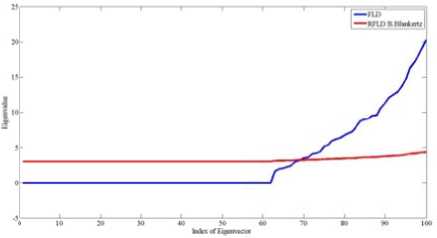
Fi g ure 1. Eigenva l ues of a given c o variance matrix using FLD (blue line) and RFL D (red line)
For the RFLD w e use:
Ё(у) := (1 — y)E 4- yvl
W h ere lambda w as calculated using B. Bla n kertz et al. [18] method:
, _ n Hl.j=\ ^k(zij(k))
(
-
V. RESULTS and Discussion
All the m o dels have been imple m ented using MATLAB soft w are with B C I2000 software tools and
results were compared from the classification accu r acy point. RFL D was applied without the use of ense m ble average and using the ensemble aver a ge from 2 t o30 ensembles using FFT feature extractio n technique. The estimate of P SD or FFT of one EEG epoch has a chisquare distri b ution. In order to reduc e the varianc e of FFT or PSD , its necessary to average it over a numb e r of segments[19 ] . 10-fold cross-validation was use d to estimate average classification accuracy of RFLD. The accuracy curves obtained using RFLD A plotted ag a inst the ensemble average for all the 1 0 data types are presented in Figure 2.
In figur e 3. the best accuracy sho w n by Winsor i sed filtered data when compared it with others.
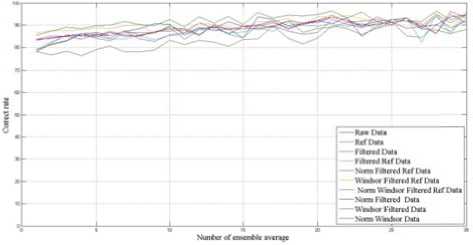
Figure 2. Correct rates vs. number of ensemble average obtaine d by cross-validation with FLD using FFT feature s for all data type s
Table 2. Shows the average of co r rect rate for F FT features. The stared values are the higest. We can see that Winsorised Filtered Data gives t h e best mean and the lower st a nderd deviation. The sec o nd and the t h ird best were W insorised Filtered Ref. D ata and Filt e red Data .
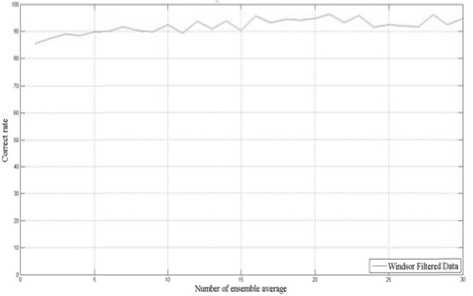
Figure 3. Correct rates vs. number of ensemble average obtaine d by cross-validation with FLD using FFT feature s for all data type s
TABLE 2. THE AVERAGE OF CO R RECT RATE W ITH RAW AND FFT FEA T URES
|
Method of preprocessing |
Average of Correct rate % (mean ± S.D) |
|
Raw Data |
88. 6 6±0.038 |
|
Ref. Data |
87. 2 5±0.033 |
|
F iltered Data |
89.14±0.039* |
|
Filtered Ref. Data |
87. 4 8±0.038 |
|
Norm F iltered Ref. Dat a |
87. 8 9±0.032 |
|
Winsoris e d Filtered Ref. D ata |
90. 4 ±0.025* |
|
Norm. Wins o rised Filtered Re f Data |
83. 5 4±0.047 |
|
Nor m . Filtered Data |
88. 8 7±0.032 |
|
Winsorised Filtered Da t a |
92.06±0.027* |
|
Norm. Winsorised Dat a |
88. 6 8±0.030 |
|
Mean |
88.14±0.0404 |
Overtly-from EEG sign al analysis vie w point - there ar e discriminati n g patterns b e tween norm a l and autistic children.
Improving the classific a tion accura c y which had been given in [9], was due to the multivari a te analysis of all the channels (i.e. via the c o ncatenated signals), rather th a n studying the diffe re nces betw e en of the corresponding c hannels of the normal and autistic children, as wel l as, the usin g of the Reg u larized Fisher Linear Discrimi n at Analysis.
In order t o give a c oncrete evidence of this discrimination, the small nu m ber of both t h e normal and autistic children (small datase t ) should be i n creased.
-
VI. CONCLUSION
In this pa p er, Electroe nc ephalogram (EEG) based A u tism diagno s is using R egularized F isher Linear Di s criminat (R F LD) Analy s is is presen t ed. Different preprocessing techniques, as w ell as, diffe r ent ensemble averages are studied. The av e rage correct r ate is (92%). FFT features ar e used. Wi n sorised Filtered Data gave th e best mean a n d the lower s tandard deviation for FFT fe a tures.
Acknowledgment
Many thanks go to all the subjects who volunteered to participate in the experiments described in this paper. We should not forget here to thank Dr. Ulrich Hoffmann et al [20]. His code helped us in developing many preprocessing algorithms. Finally, we would like to thank our team for their efforts in the BCI project.
References EEG based Autism Diagnosis Using Regularized Fisher Linear Discriminant Analysis
- T. Fabricius, "The Savant Hypothesis: Is autism a signal-processing problem?," Medical Hypotheses,ScienceDirect, 2010.
- H. BehnamA, A. SheikhaniB, M. R. MohammadiC, M. NoroozianD, and P. GolabiE, "Analyses of EEG background activity in Autism disorders with fast Fourier transform and short time Fourier measure," in International Conference on Intelligent and Advanced Systems 2007,IEEE paper 10368672 p1240 - 1244
- Trottier G, Srivastava L, Walker CD. Etiology of infantile autism: a review of recent advances in genetic and neurobiological research. J Psychiatry Neurosci. 1999;24(2):103–115
- Kai Velten "Mathematical Modeling and Simulation Introduction for Scientists and Engineers" 2009 WILEY-VCH Verlag GmbH & Co KGaA, Weinheim
- S. A. S. E. Schipul , M. A. Just "Applying Machine Learning Techniques to Brain Imaging Characteristics to Distinguish Between Individuals with Autism and Neurotypical Controls " 2010.
- C. A. N. Bosl, "Using EEGs to Diagnose Autism Spectrum Disorders in Infants: Machine-Learning System Finds Differences in Brain Connectivity," 2011.
- L. M. Oberman, E. M. Hubbard, J. P. McCleery, E. L. Altschuler, V. S. Ramachandran, and J. A. Pineda, "EEG evidence for mirror neuron dysfunction in autism spectrum disorders," Cognitive Brain Research,ScienceDirect, vol. 24, pp. 190-198, 2005.
- J. A. Pineda, D. Brang, E. Hecht, L. Edwards, S. Carey, M. Bacon, C. Futagaki, D. Suk, J. Tom, and C. Birnbaum, "Positive behavioral and electrophysiological changes following neurofeedback training in children with autism," Research in Autism Spectrum Disorders,ScienceDirect, vol. 2, pp. 557-581, 2008.
- A. Sheikhani, H. Behnam, M. R. Mohammadi, M. Noroozian, and P. Golabi, "Connectivity analysis of quantitative Electroencephalogram background activity in Autism disorders with short time Fourier transform and Coherence values," 2008, pp. 207-212.
- B. William, T. Adrienne, and N. Charles, "EEG complexity as a biomarker for autism spectrum disorder risk," BMC Medicine, vol. 9, 2011.
- E. Milne, "Increased Intra-Participant Variability in Children with Autistic Spectrum Disorders: Evidence from Single-Trial Analysis of Evoked EEG," Frontiers in Psychology, vol. 2, 2011.
- C. Croux, P. Filzmoser, and K. Joossens, "Classification efficiencies for robust linear discriminant analysis" Statistica Sinica, vol. 18, pp. 581-599, 2008.
- http://www.gtec.at
- G. Schalk and J. Mellinger, A Practical Guide to Brain-Computer Interfacing with BCI2000: Springer 2010.
- Mahmoud I. Kamel, Mohammed Alhaddad, Hussein Malibary, Anas A. Hadi. "Improving P300 Speller by Common Average Reference (CAR)". To be published.
- H. H. Monson, Statistical digital signal processing and modeling: John Wiley & Sons, 1996.
- R.O. Duda, P.E. Hart, and D.G. Stork, Pattern classification, 2nd ed.Wiley, New York, (2001).
- B. Blankertz et al. (eds.), Brain–Computer Interfaces, The Frontiers Collection, Springer-Verlag Berlin Heidelberg 2010
- J.E. Vos, Representation in the frequency domain of non-stationary EEGs, G Dolce, H Künkel, Editors , Computerized EEG analysis, Gustav Fischer Verlag, Stuttgart (1975), pp. 41–50
- Ulrich Hoffmann , Jean-Marc Vesin, Touradj Ebrahimi, Karin Diserens, "An efficient P300-based brain–computer interface for disabled subjects", Journal of Neuroscience Methods 167 (2008), pp. 115–125
