Effect of barriers on international trade

Author: Aleshin D.B., Tregub I.V.
Journal: Экономика и социум @ekonomika-socium
Section: Основной раздел
Article in issue: 3 (34), 2017.
Free access
In this analysis we seek to investigate the impact of various import tariffs on trade as a percentage of GDP. Members of the World Trade Organization (WTO) set up defined tariffs to help facilitate trade with one another. There are specific guidelines for joining, namely the equitable tariff limits that disallow discrimination among countries. These universal rates allow for a firm investigation into how tariffs affectt rade as percent of GDP, because it assists in diminishing the impact of substitutes among countries that are not a part of WTO.
Economic barriers, international trade, gross domestic product, foreign direct investment, purchasing power
Short address: https://sciup.org/140122798
IDR: 140122798
Text of the scientific article Effect of barriers on international trade
International trade is defined as the exchange of capital, goods, and services across international borders or territories. Such trade makes up a large share of gross domestic product (GDP) for most nations. In theory, countries engage in trade with other countries when one does not have the resources or capacity to meet their own needs and wants. As nations develop domestic scarce resources, they can produce a surplus of goods and trade this surplus of goods for the resources they need with another nation.
The World Trade Organization (WTO) is the only global international organization dealing with the rules of trade between nations. WTO agreements are negotiated and signed by the bulk of the world's trading nations and ratified in their parliaments.
The main objective of tariffs is to decrease demand for imports while increasing demand for domestic products. However Tariffs discourage international competition, leading to decreases in domestic product variation or availability.
The paper illustrates, how tariffs affect trade as a percentage of GDP. The expectation is countries that impose higher weighted average tariffs will have a lower trade percentage of GDP.
Our first linear regression includes 121 nations (counting the European Union as one because it is also a custom union) which approaches a broader analysis compared to just one single country
Data:
Simple Linear Regression
This is the summary for our variables of the Linear regression Model.
|
Variable |
Oba |
Mean |
Std. Dev. |
Min |
Max |
|
TradeaaGDP |
121 |
89.73087 |
59.36845 |
25.63479 |
455.2767 |
|
WAT |
129 |
7.787597 |
3.991436 |
0 |
20.9 |
-
I. Trade as Percent of GDP
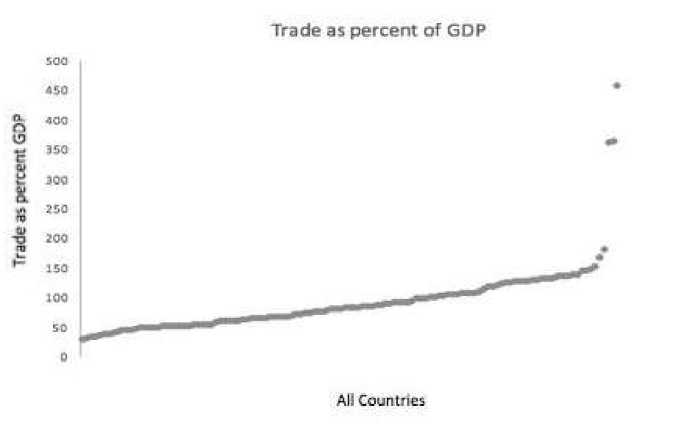
To conduct our analysis we decided to choose “Trade as percent of GDP” as our dependent variable (our “Y”).
Trade as percent of GDP is a variable that has grown since the foundation of WTO in 1994, the worldwide trade growth was and still is a goal of the WTO. In the following chart is show all the possibilities of trade as percent of GDP, the data goes from a minimum of 25% to a maximum of 455%.
Trade as Percent of GDP can be higher that 100% since it is (Import+Exports)/GDP and GDP is a sum of Consumption, Income, Government Spending, Exports Less Imports. What happens in small countries with high productivity like Hong Kong and Singapore is that due to their small size, instead of trying to be self-sufficient and produce all the products their population needs, they specialize in a few highly-profitable industries. These industries may produce more money from exports than the entire domestic economy. All that money from exports allows them to purchase imports far into excess of what their domestic economy could otherwise support
-
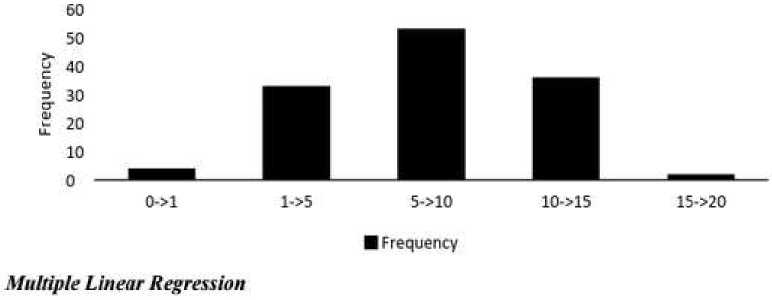
II. Weighted Average Tariff
Trade weighted average tariff (WAT) is our first independent variable for the Simple Linear Regression Model. Trade Weighted Average tariff is “HS 6-digit MFN applied tariff”averages weighted by HS 6-digit import flows for traded products (or “tariff lines”) — in calculating the average tariffs, more weight is given to products with larger import flows.
Weighted Average tariff
This is the summary for our variables of the Multiple regression Model.
|
Variable Obs |
Mean Std. Dev. Min Max |
|
TradeasGDP 121 |
89.73087 59.36845 25.63479 455.2767 |
|
WAT 129 |
7.787597 3.991436 0 20.9 |
|
NTH 109 |
342.5872 627.1439 1 4808 |
|
PRI 108 |
69.2037 11.35638 43 93 |
|
FDI 11€ |
5623.549 13930.4 -675.55 96894.98 |
|
PPP 93 |
138094.8 206410.6 558.0545 944503.1 |
-
III. Non-tariff barriers
For our second model we added the amount of Non-tariff barriers as another independent variable. The total amount of NTB for country is a sum of Anti dumping, Countervailing, Quantitative Restrictions, Safeguards, Sanitary and Phytosanitary, Special Safeguards, Technical Barriers to Trade, Tariff-rate quotas and Export Subsidies.
-
IV. Political Risk Index
For our third model we added the Political Risk Index as an independent variable. The PRI is the overall measure of risk for a given country, calculated by using all 17 risk components from the Political Risk Services Methodology including turmoil, financial transfer, direct investment, and export markets. The Index provides a basic, convenient way to compare countries directly, it ranges from a minimum of 43 to a maximum of 93, the country with a higher index have a stronger political stability, on the contrary countries with a lower PRI are more unstable (african countries)
-
V. Foreign Direct Investment
Foreign direct investment is an investment made by a company or individual in one country in business interests in another country, in the form of either establishing business operations or acquiring business assets in the other country, such as ownership or controlling interest in a foreign company. FDI data are taken from WorldBank database, refer to 2014 and all data are in million. We believed that this variable has a positive relationship with Trade, because more FDI should increase Trade
-
VI. Purchasing Power
PPP GNI (formerly PPP GNP) is gross national income (GNI) converted to international dollars using purchasing power parity rates. An international dollar has the same purchasing power over GNI as a U.S. dollar has in the United States. Gross national income is the sum of value added by all resident producers plus any product taxes (less subsidies) not included in the valuation of output plus net receipts of primary income (compensation of employees and property income) from abroad. Data are in current international dollars. Data are taken from Worldbank and refers to year 2014 and are in million.
Our data meet Gauss Markov Assumptions for the Multiple regressions:
-Linear in parameter
-Random sample
-
-No perfect collinearity
-
-Zero conditional mean
-Homoskedasticity
Tradea~₽
WAT
NTB
PRI
FDI
PPP
TradeasGDP
1.0000
WAT
-0.4116
1.0000
НТВ
-0.1324
-0.3868
1.0000
PRI
0.4854
-0.5004
0.3570
1.0000
FDI
-0.0529
-0.0927
0.1837
0.3202
1.0000
PPP
-0.0152
-0.1059
0.0783
0.2546
0.6293
1.0000
2. Trade = + 152.54 -7.00 (WAT) -0.03(NTB)
3. Trade = +4.63 -4.20 (WAT) -0.04(NTB) +1.86(PRI)
4. Trade = -74.30 -6.26(WAT) -0.08(NTB) +3.53(PRI) -0.002 (FD1)-0.00002(PPP)
Results:
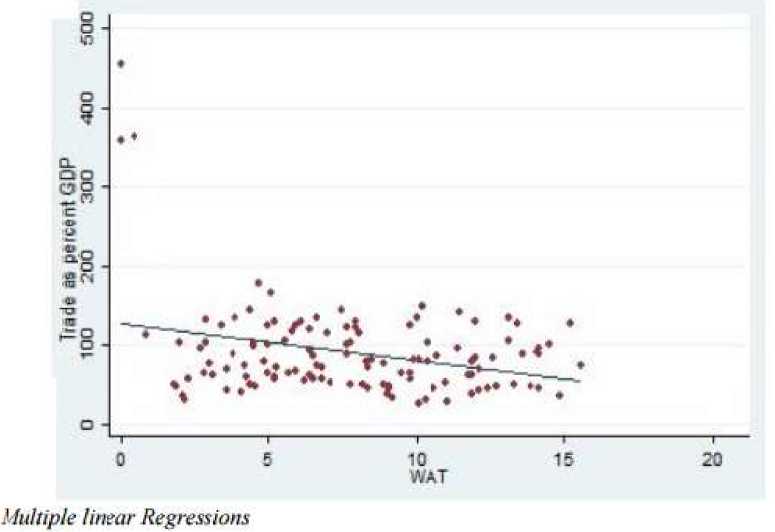
Simple Linear Regression
Our simple linear regression model illustrate what we expected: there is, even if not very strong, a negative correlation between the Weighted Average Tariff and the total Trade in one country. One main problem is related to R-squared that in this model is extremely low (0.09), but we think that this value in our multi regression model will be higher. As is shown in the below chart the data is not tightly packed, which also reflects the R-squared value.
Models
1. Trade = + 125.77 -4.25 (WAT)
|
Dependent Variable: Trade as Percent of GDP |
||||
|
Independent Variables |
Model (1) |
Model (2) |
Model (3) |
Model (4) |
|
Weighted Average Tariff |
-4.63 (-3.42)*** |
-7.00 (4.46)*** |
-4.20 (-2.17)** |
-6.26 (-2.90)* *♦ |
|
Non-Tariff barriers |
-0.03 (-3.54)*** |
-0.04 (-4.03)*** |
-0.08 (-4.00)*** |
|
|
Political Risk index |
1.86 (2.94)*** |
3.53 (4.58)*** |
||
|
Foreign Direct Investment |
-0.002 (-107) |
|||
|
PPP GNI |
-0.00002 (-0.56) |
|||
|
Intercept |
125.76 (10.72)*** |
152.54 (10.66)*** |
4.63 (0.09) |
-74.30 (1.21) |
|
No. of obs. |
121 |
103 |
93 |
68 |
|
R-square |
0.089 |
0.20 |
0.27 |
0.46 |
♦Significant at 10%, **5%, ♦** 1% T-statistic in parenthesis.
The first thing we noticed is that our R-squared value has increased thourgh our models, going up to 0.30 in the last model.
Our second model is probably the best one. It shows how both WAT and NTB are negatively correlated to Trade.
Our third model shows the same results of the previous model and it addsthat the more a political system is solid so higher PSI the more the country will have a higher value ofTrade as percent of GDP.
Robustness Test:
The F-test is 15.04 and the F-critical value at 5% is 3.15, so the 2 variables are jointly significant and we will keep them in our model. Below the calculations.
F-test = [(SSRr-SSRur)/2]/(SSRur/62) = [(288278-194085)/2]/(194085/62) = 15.04
F(2,60)=3.15
F-test > F-cv so Jointly significant.
Conclusion:
Our final Model is consistent with our initial expectations: Barriers have a negative impact on trade. Direct barriers such as Import Tariffs have a strong negative impact on trade, indirect barriers such as Non-tariff barriers and Political Instability have also a negative relationship but they are weaker. Both direct and indirect barriers are significant at 1% in our final model. Other factors such as Foreign Direct Investments and the Purchase Power Parity of the country came out not to have a strong correlation with Trade but to be jointly significant to the model.
In order to have a more integrated world with free flow of goods the most important thing underlined by our project are low import tariffs, the lower import tariffs, the more a country is going to import and export. Non-tariff barriers resulted in being less important than we expect, but still the lower they are the higher will be the amount of trade for the country.
The Political Stability of the country turns out to be an important variable of Trade, thehigher it is the higher will be the amount of trade in the country.
However Foreign direct investment and Purchasing Power didn’t prove to be very important, if a country invests a lot in other countries this doesn’t boost trade.
These results lend themselves to support the point of view that the establishment of tariffs in a non-optimal price dictated by an organizational agreement yields a loss in welfare as realized by trade as a percent of GDP.
References Effect of barriers on international trade
- Graaff, Jan. "Optimal Tarrifs Revisited." History Of Political Economy 32.3 (2000): 437-439. EconLit. Web. 2 Oct. 2016
- Imbruno, Michele. "China and WTO liberalization: Imports, tariffs and non-tariff barriers." China
- Economic Review Vol. 38 (2016): 222-237. ScienceDirect. Web. 3 Oct. 2016.
- Kemp, Murray C., Ngo Van Long, and Koji Shimomura. "A Differential Game Model Of Tariff War."
- Japan And The World Economy 13.3 (2001): 279-298. EconLit. Web. 2 Oct. 2016.
- Mariani, A., et al. "Tariff and Non-Tariff Barriers to Wine Exports and Initiatives to Reduce their
- Effects." Agricultural Economics Review 15.1 (2014): 5-24. ProQuest. Web. 6 Nov. 2016.
