Effects of Filter Numbers and Sampling Frequencies on the Performance of MFCC and PLP based Bangla Isolated Word Recognition System

Author: Oli Lowna Baroi, Md. Shaikh Abrar Kabir, Azhar Niaz, Md. Jahidul Islam, Md. Jakaria Rahimi
Journal: International Journal of Image, Graphics and Signal Processing @ijigsp
Article in issue: 11 vol.11, 2019.
Free access
In this work, a 5 state left to right HMM-based Bangla Isolated word speech recognizer has been developed. To train and test the recognizer, a small corpus of various sampling frequencies have been developed in noisy as well as the noiseless environment. The number of filter banks is varied during the feature extraction phase for both MFCC and PLP. The effects of 2nd and 3rd differential coefficients have also been observed. Experimental results exhibit that MFCC based feature extraction technique is better in CLASSROOM environment on the contrary PLP based technique performs better not only in a noiseless environment but also in when AC or FAN noise is present. We have also noticed that higher sampling frequency and higher filter order don’t always help to improve the performance.
MFCC, PLP, Clean and Noisy Environment, Different Sampling Rate, Different number of filter banks, HMM, Bangla ASR
Short address: https://sciup.org/15017049
IDR: 15017049 | DOI: 10.5815/ijigsp.2019.11.05
Text of the scientific article Effects of Filter Numbers and Sampling Frequencies on the Performance of MFCC and PLP based Bangla Isolated Word Recognition System
Automatic speech recognition (ASR) or computer speech recognition is a process by which a computer can identify the words that are spoken by a person into a microphone or telephone and converts it into written text against a provided or acquired vocabulary. Now-a-days we can find various modifications of standard techniques and different types of research have already been done by using them. But only a few works try to compare these techniques experimentally for Bangla Speech Corpus using different parameters.
The benefit of the increasing number of coefficients on MFCC and PLP [1] for Bangla speech corpus was explored using triphone model and the impact of the number of filters and coefficients on MFCC and PLP [2] also tested for speaker-independent continuous speech using different language corpus. The effect of the third differential coefficient on MFCC [5] for Bangla speech corpus also analyzed. Several research papers showed the comparison among feature extraction techniques like LPC, MFCC, PLP, RASTA-PLP, etc [7], [10, 11] using different language corpus. Besides, some documents helped to comprehend how different types of feature extraction techniques work [3, 4], [6], [8].
Even though many feature extraction techniques are available for ASR, this work only deals with the MFCC (Mel Frequency Cepstral Coefficient) and PLP (Perceptual Linear Prediction) feature extraction techniques for Bangla Speech Corpus since both techniques are very popular for the automatic speech recognition process. It’s because they try to work by understanding the concept of human hearing and how they perceive sounds with various frequencies. The concept of critical band rate and critical bandwidth is frequently applied in speech recognition from this point of view. However, MFCC is a simplified auditory process and relatively fast, sometimes it is not robust enough in the presence of additive noise. That’s why PLP was introduced which smooth the modified power spectrum using the all-pole model and then estimate the output cepstral coefficients.
That’s why here both the techniques were compared for different numbers of filters distributed in a different frequency band. We also investigated the influence of the introduction of Third differential coefficient on the accuracy rate. All the experiments were performed for isolated speech database uttered by five male and three female speakers over noiseless as well as a noisy medium. That’s why we used a 5 state left to right Hidden Markov Model (HMM) based on monophone model for our experiment as it is better for isolated voices. For building HMM, we have used the HTK toolkit with the help of MATLAB.
We have divided our paper into five parts including this introduction section. Section-2 delineates the influence of sampling rate and filter numbers on PLP and
MFCC. In Section-3, we discussed the experimental setup. Section-4 represents the Result analysis and finally, conclusion and future work are discussed in Section-5.
II. Influence Of Sampling Rate And Filter Numbers On Mfcc And Plp
In spite of being many similarities between MFCC and PLP feature extraction techniques, there also have some dissimilarities between them. From Figure1, we can notice the differences lie in the filter-banks, the equalloudness pre-emphasis, the intensity-loudness conversion and the application of LP. Each component helps PLP to become more compatible with the human auditory system [3].
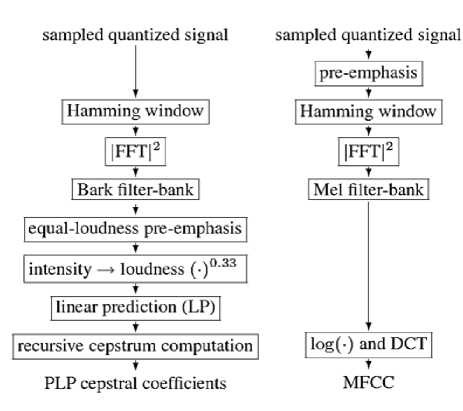
Fig.1. The computation steps of PLP (left) and MFCC (right)
The MFCC and PLP model usually perform by implementing a filter bank whose center frequencies are spaced along the frequency axis satisfying the critical-band scale and whose particular filter widths correspond to the theory of critical bandwidths [6]. The critical-band scales we have used are the Mel-scale (triangular in shape) and the bark-scale (trapezoidal in shape) in which the filters are distributed along the frequency axis approximately linear up to about 1000 Hz for Mel-scale and 500 Hz for bark-scale and logarithmic above these. The following formula is used to compute the Mel for a given frequency [4]
Mel(D = 2595 log™ (1 + £) (1)
Besides, the Bark for a particular frequency can be estimated using the equation given below,
Вог«Л = =+7 -“.53 (2)
If Bark (f) < 2, add 0.15 × (2 – Bark (f))
If Bark (f) > 20.1 add 0.22 × (Bark (f) - 20.1)
The number of Mel and Bark increase along with the sampling frequency. Also the spacing of these symmetric overlapping triangular and trapezoidal filters increases with frequency. For example, for MFCC the bank of filters was distributed over the whole frequency band 02840 Mels when the frequency was 8 kHz where for 44.1 kHz sampling rate the frequency band becomes 0-4687 Mels.
The spacing, as well as the bandwidth of the particular filters, is determined by a constant Mel-frequency interval. Like at 8 kHz, when we have taken 14 filters, the spacing of these symmetric overlapping triangular filters was approximately (2840÷14)202 Mels and the widths of the triangles were 404 Mels. On the contrary, at 44.1 kHz, for the similar number of filers spacing was 334 Mels and width was 668 Mels. Now when we increase the number of filter banks the spacing of these symmetric overlapping triangular filters decreases. Like, instead of 14 filters when we take 26 filters the spacing become 109 Mels at 8 kHz. And for 44.1 kHz, the spacing is 180 Mels.
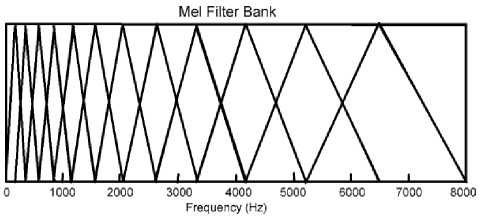
Fig.2. Mel-scale Filter Bank
Another technique is PLP which uses bark spaced filter bank instead of Mel scaled filter Bank where 1 Bark is approximately equal to 100 Mels.
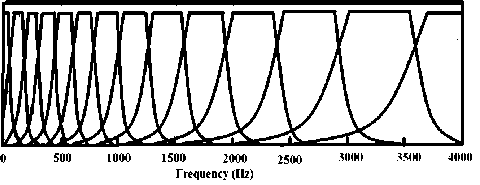
Fig.3. Bark Filter Bank
By using bark equation, we can see that. The filters centers are spaced in the Bark domain linearly with the step approximately 1 Bark. The Bark filter bank is a series of a trapezoidal-shaped bandpass filter. To transform a power speech spectrum to a corresponding auditory spectrum, PLP combines three components from the psychophysics of hearing: the critical-band spectral selectivity, the equal- loudness curve, and the intensityloudness power law.
When the speech signal covers the range from 0 to 8 kHz the corresponding range in the Bark scale was 022.02 Bark. When we used 14 filters, they spaced linearly with the step of 1.573 Bark and as the numbers of filter banks increase the space between two filters started to decrease. For example, the spacing becomes 0.8469
Barks, when we use 26 filters. Furthermore, while the sampling rate increases the spacing of these symmetric overlapping trapezoidal filters also increases. Like at 44.1 kHz, for 14 filters the spacing is 1.89 Barks where for 26 filters it is 1.018 Barks.
Though both techniques are quite popular, PLP works better than MFCC most of the times as PLP is very low order it needs fewer coefficients. Therefore, the filter numbers variation show less effect in PLP than MFCC. Where in MFCC, spacing among filters varies dramatically with changing frequency and amount of filter, in PLP this change is very small. PLP is very efficient for both storage and recognition complexity than most other spectral representation. It could show less sensitivity to speaker variation than most other spectral representation. On the contrary, MFCC is a fast and simplified model. However, it’s less sensitive in additional noise.
III. Experimental Setup
For our experiment, firstly, we have taken 800 sentences uttered by three female and five male speakers (100 sentences per person) at 8 kHz, 16 kHz, 32 kHz and 44.1 kHz sampling rate for the isolated speech database in both noiseless and noisy medium and then by using the monophone model we built the train corpus. Furthermore, we have also built the test corpus using 100 voices at a time for the test. We have recorded voices in four different medium. They are (1) noiseless environment, (2) only AC noise present, (3) only FAN noise present and (4) CLASSROOM environment. We used both MFCC and PLP configurations for our experiments and tried to observe the effects of different filters and sampling rate in different environments. By appending the Third differential coefficient, we also tried to exhibit whether it affects the detection rate or not. For an evaluation of recognition results, we used the standard measure- the accuracy (Acc) defined in percentage as
Лее = N-D-s-i * 100% (3)
N
Where N is the total number of words in the reference transcription, S is the number of substitution errors, D is the number of deletion and I the number of insertion errors. The main configuration files for MFCC and PLP are given in Table 1.
For changing the model and number of coefficients, we must append some qualifiers in the TARGETKIND. For our experiment, we discuss Delta (D), Acceleration (A), Third Differential (T) and Cepstral coefficients (0). By adding one qualifier, we append 12 coefficients at a time except for the cepstral coefficient. Its power depends on the additional qualifiers. If only D is present then the power of cepstral will be 2 whereas also adding A and T will make it 4. So MFCC39 means here delta, acceleration, and cepstral qualifiers are present whereas in MFCC52 third differential qualifiers should also append. A similar phenomenon applies to PLP39 and PLP52.
Table 1. Configuration Files
|
PLP |
MFCC |
|
SOURCEKIND = HAUDIO |
SOURCEKIND=WAVEFORM |
|
SOURCEFORMAT = HTK |
SOURCEFORMAT = WAV |
|
SOURCERATE = 226 |
SOURCERATE = 226 |
|
TARGETKIND = PLP |
TARGETKIND = MFCC |
|
TARGETRATE = 100000.0 |
TARGETRATE = 100000.0 |
|
WINDOWSIZE = 250000.0 |
SAVECOMPRESSED = T |
|
USEHAMMING = T |
SAVEWITHCRC = T |
|
PREEMCOEF = 0.97 |
WINDOWSIZE = 250000.0 |
|
NUMCHANS = 20 |
USEHAMMING = T |
|
CEPLIFTER = 22 |
PREEMCOEF = 0.97 |
|
NUMCEPS = 12 |
NUMCHANS = 26 |
|
USEPOWER = T |
CEPLIFTER = 22 |
|
LPCORDER = 12 |
NUMCEPS = 12 ENORMALISE = T |
So, our paper considered the following TARGETKIND:
-
I. MFCC_D_A_0 (39 coefficients) monophone HMM
-
II. MFCC_D_A_0_T (52 coefficients) monophone
HMM
-
III. PLP_D_A_0 (39 coefficients) monophone
HMM
-
IV. PLP_D_A_0_T (52 coefficients) monophone
HMM
SOURCERATE, TARGETRATE, and WINDOWSIZE require a floating-point value in 100 ns units. The SOURCERATE must be changed along with the sampling rate. As SOURCERATE = (1÷Frequency). For example, at 44.1 kHz frequency SOURCERATE is (1÷44100) or 22.6µs. Moreover, by changing NUMCHANS we can change the filter amount.
IV. Result Analysis
Our database consists of 800 speech signals acquired during different sessions at different sampling frequencies. Here, 800 sentences are spoken by five male and three female in a noiseless as well as noisy medium, which are used for making the train corpus. After that, 100 voices have taken for the test purpose from the base voices.
In Figure 4, we have tried to compare between MFCC39 and MFCC52 by varying the No of filter banks at different frequencies and observe the results and Fig-4 delineates the average sentence detection rate of PLP39 and PLP52 by varying the No of filter banks at different frequencies only in noiseless medium.
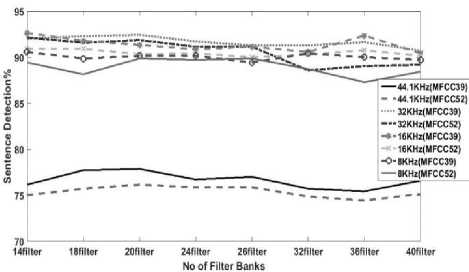
Fig.4. Comparison between MFCC39 and MFCC52 for noiseless environment
According to Figure 4, it is quite noticeable that for the highest sampling frequency (44.1 kHz) MFCC gives the least amount of sentence detection rate (SDR). Also, SDR shows inverse relation with the sampling rate and as soon as we decrease the sampling frequency to 32 kHz, detection rate crosses 90 percent on average. Highest SDR is always given by 32 kHz sampling rate except we use 14 and 36 number of filter banks since at those filter banks 16 kHz frequency shows the highest detection. Moreover, between MFCC39 and MFCC52, the highest detection rate is always given by MFCC39 in the noiseless medium.
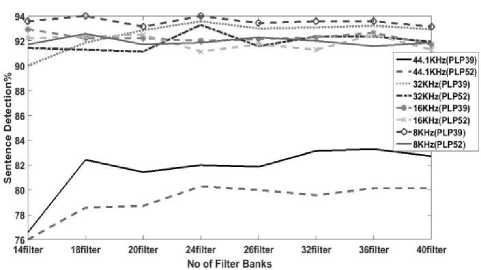
Fig.5. Comparison between PLP39 and PLP52 for noiseless environment
From Figure 5, a similar pattern is observed that 44.1 kHz sampling rate gives the lowest SDR and as we minimize the sampling rate the SDR starts to rise. Now the highest detection is showed by PLP39 at 8 kHz sampling rate for a different number of filter banks.
Now after juxtaposing Figure 4 and Figure 5, it is clear that MFCC39 and PLP39 show better detection than 52 coefficients. That means Third differential coefficient doesn’t have much effect on sentence detection rate. Also for a noiseless environment, PLP39 detects more than MFCC39. As we find that MFCC39 and PLP39 give the best detection in noiseless medium, we can also observe their effect in different noisy mediums using the same No of Filter Banks. Though we find that third differential didn’t show much effect in noiseless medium, we observe their detection rate in a noisy environment to comprehend their effects.
Figure 6 depicts the average sentence detection rate in percentage at 8 kHz sampling rate in noiseless as well as
AC, FAN, and CLASSROOM noise-based medium for different numbers of filter banks.
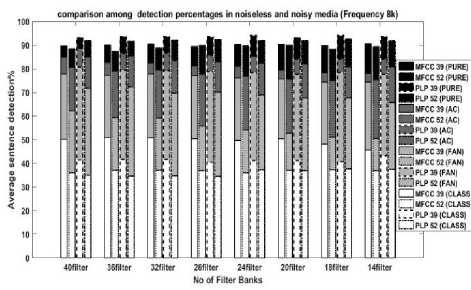
Fig.6. Comparison between MFCC and PLP in a different medium at 8 kHz frequency
The figure exhibits that, PLP39 detects more than all other models in noiseless, as well as AC and FAN, noised medium though the detection rate decreases when we add noise in the clear environment. In a clear environment, average SDR is more than 90 percent. Now when different types of noise being added in an environment like CLASSROOM, we can see MFCC39 gives the best detection than others even if SDR is equal or less than 50 percent.
Now if we observe the effect of No. of filter banks, it is noticeable that in clear medium change of filter banks show negligible effect. But when we turned into a noisy medium whether it is AC, FAN or CLASSROOM, the addition of filter numbers gives more correct detection. The highest detection is given by 40 filter banks and the lowest SDR is visualized in 14 filter banks. While observing the figure we also notice that in Class Room environment all other filters except 14 filter banks give almost similar detection.
Figure 7 delineates the detection rate at 16 kHz sampling rate in noiseless as well as AC, FAN, and CLASSROOM noise-based medium for different numbers of filter banks.
comparison among detection percentages in noiseless and noisy media {Frequency 16k)
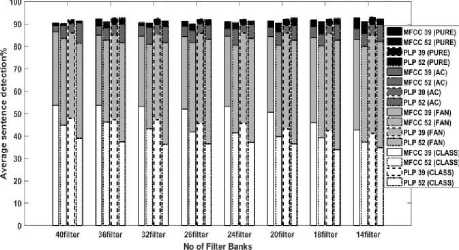
Fig.7. Comparison between MFCC and PLP in a different medium at 16 kHz frequency
At 16 kHz, though we can see that PLP39 is better than MFCC39 all the time, the difference in the detection rate is nearly negligible. Whatever number of filter bank we have used, the average detection rate is approximately similar for both MFCC39 and PLP39. In a noiseless medium, the average detection rate is more than 90 percent whatever model or number of filter banks is used. For AC noised medium, the detection rate slightly decreases and varies between 88-90 percent on average. Although the detection rate is quite similar in all filter banks, 40 filter banks detect slightly better than others in PLP39 model. When we consider Fan noised medium, detection rate fluctuates between 80-86 percent and here 20 and 24 filter banks gives better detection than others do. In real life environment (e.g.-CLASS ROOM), the models show more variation than other mediums at 16 kHz and MFCC39 detects better than other models. At this frequency, MFCC39 detects better than any other sampling frequency and detection rate crossed 50 percent on average in this noisy medium. Here also additional filter banks help to increase the detection rate as we can see that 14 filter gives the worst detection and 36, as well as 40 filter banks, give the highest detection.
Finally, Figure 8 exhibits the average detection rate at 32 kHz and Figure 9 visualizes the average detection rate at 44.1 kHz sampling rate in noiseless and AC, FAN, CLASSROOM noise-based medium for different numbers of filter banks.
For 32 kHz frequency, PLP39 gives better detection if the filter is 20 or above. Or else MFCC39 shows better detection. Here 14 filter banks give the worst detection where 24, 26 filter banks show the highest detection. For Ac noised medium, PLP39 gives better detection for all the filters except 14 filter banks and it shows the worst detection. On the contrary, for FAN and CLASSROOM environment, MFCC39 shows a better detection rate than other models. Though 40 filters give the best detection and 14 filters give poor when only Fan noise is present in the medium, we can visualize the opposite pattern when different types of noises are present in the environment (e.g. CLASSROOM). Also, the detection rate barely crosses 50 percent on average whatever number of filter banks we use.
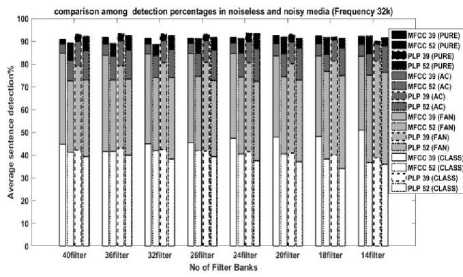
Fig. 8. Comparison between MFCC and PLP in a different medium at 32 kHz frequency
At 44.1 kHz, the detection rate of noiseless and AC noised mediums are nearly the same when the number of filter banks is low. But when we add 36 no. of filter banks we can observe that SDR of the pure environment is more than AC noised environment.
For 44.1 kHz we further get a similar pattern that
PLP39 shows better SDR in a clear environment as well as in Ac and Fan noised medium whereas MFCC39 detects better in the Classroom environment. Even though on average the best SDR is shown by a higher number of filter banks (40 for Fan, Classroom and 32 for pure) and the worst by lowest filter banks (14) almost in all types of environment, Ac noised medium shows the complete opposite characteristics. After the capacious discussion of these experimental results, we can visualize that the higher the sampling rate of the voices, the less the difference between noiseless medium and AC noise medium’s detection rate. Also, the detection rate drops when we increase the sampling frequency. Except for the Classroom, PLP39 outperforms all the other models all the time. Only in the Classroom, MFCC39 performs best. Among the four sampling rate, 16 kHz shows best detection in Classroom and Fan noised medium where when we see the clear medium, 8 kHZ gives the best detection and in AC noised medium best is shown by 32 kHz sampling frequency.
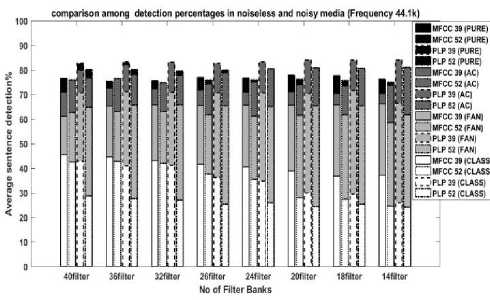
Fig. 9. Comparison between MFCC and PLP in a different medium at
44.1 kHz frequency
Also, we can see although in noiseless medium no of filters show us very less effect in SDR, in noisy medium addition of filter banks show us variation in detection. On average best detection is given by the highest no of filter banks and as the number of filter addition decreases the SDR decreases most of the time.
V. Conclusion
So, after all the experimental results we can come to this conclusion that both in noiseless and noisy medium PLP detects better than MFCC most of the time and 39 coefficient model dominates 52 coefficient model in both models. Though PLP outperforms MFCC in different noisy mediums, in a real environment like CLASSROOM where various types of noise are present, MFCC outperforms PLP at any sampling frequency. However, as we expected from theory, the detection rate varies depending on sampling frequency. For higher sampling frequency, this detection rate becomes poor as the spacing of these symmetric overlapping filters increases. Though the addition of filters didn’t show much effect in noiseless medium, in noisy medium average detection rate varies for variation of filter numbers. In most cases, the highest detection we get by using higher numbers of filter banks and 14 filter banks show the lowest detection. However, some cases also show the opposite pattern too. In this paper, we observed the effects of filter numbers and different sampling frequencies on different environment. Therefore, in future, we can try to observe the effects of the environment, filter numbers and sampling frequencies using triphone model which is better for naturally spoken language and also can enrich our database for getting more practical output.
Acknowledgements
The authors would like to thank Ahsanullah University of Science and Technology for supporting this work. Md. Jakaria Rahimi helped to get the idea. Oli Lowna Baroi, Md. Shaikh Abrar Kabir, Azhar Niaz, and Md. Jahidul Islam did the experimental works. Oli Lowna Baroi interpreted the results as well as wrote the paper with the help of Md. Jakaria Rahimi.
References Effects of Filter Numbers and Sampling Frequencies on the Performance of MFCC and PLP based Bangla Isolated Word Recognition System
- Oli Lowna Baroi, Md. Shaikh Abrar Kabir, Azhar Niaz, Al Mahmud Rakib, Md. Jahidul Islam and Md. Jakaria Rahimi,“Effects of Different coefficients on MFCC and PLP for Bangla Speech Corpus using Tied-state Triphone Model”. In: 2019 International Conference on Electrical, Computer and Communication Engineering (ECCE), pp.1-6(2019)
- Josef Psutka, Ludek Muller and Josef V Pustka,“Comparison of MFCC and PLP parameterizations in the speaker independent continuous speech recognition task”. In: Eurospeech 2001, pp.1813-1816(2001)
- Florian Honig, Georg Stemmer, Christian Hacker, Fabio Brugnara, “Revising Perceptual Linear Prediction (PLP)”. In: INTERSPEECH 2005.
- Athiramenon.G, Anjusha.V.K, “Analysis of Feature Extraction Methods for Speech Recognition”, In: IJISET - International Journal of Innovative Science, Engineering and Technology, Vol. 4 Issue 4, April 2017.
- Debnath, S., Saha, S., Aziz, M.T., Sajol, R.H., Rahimi, M.J.: Performance comparison of MFCC based Bangla ASR system in presence and absence of third differential coefficients. In: Proceeding of the International Conference on Electrical Engineering and Information Communication Technology (ICEEICT), pp. 1–6 (2016)
- H. Hermansky, “Perceptual linear predictive (PLP) analysis of speech,” In: Acoustical Society of America Journal, vol. 87, no. 4, pp. 1738–1752, 1990.
- Sai Chen, Hongcui Wang, JiaJia, Yeteng An and Jianwu Dang, “Comparison of Mel Frequency Ceptrum Coefficient and Perceptual Linear Predictive in Perceptual Measurement of Chinese Initials”, In: Trans Tech Publications, Switzerland Applied Mechanics and Materials Vols. 411-414, pp 291-297 (2013)
- Namrata Dave, “Feature Extraction Methods LPC, PLP and MFCC In Speech Recognition, “ In: International Journal for advance Research in Engineering and Technology, Volume 1, Issue VI, July 2013.
- Fatmazohra Chelali, Amar.Djeradi, Rachida.Djeradi, “Speaker Identification System based on PLP Coefficients and Artificial Neural Network”, In: Proceedings of the World Congress on Engineering 2011 Vol II WCE 2011, July 6 - 8, 2011, London, U.K.
- H.B.Chauhan, Prof. B.A. Tanawala, “Comparative Study of MFCC and LPC Algorithms for Gujrati isolated Word Recognition,” In: International Journal of Innovative Research in Computer and Communication Engineering, Vol.3, Issue 2, February 2015.
- Corneliu Octavian Dumitru, Inge Gavat, “A Comparative Study of Feature Extraction Methods Applied to Continuous Speech Recognition in Romanian Language,” International Symphosium ELMAR, 07-09 June, 2006, Zadar, Croatia.
