Efficiency of water resources’ use in the regions of the North-West federal district in view of the water strategy

Author: Fomina Valentina Fyodorovna
Journal: Economic and Social Changes: Facts, Trends, Forecast @volnc-esc-en
Section: Environmental economics
Article in issue: 3 (11) т.3, 2010.
Free access
Water industry, water strategy, directions of development, water-retaining capacity of the made product, water use efficiency
Short address: https://sciup.org/147223207
IDR: 147223207 | UDC: 332.14(470.1)
Text of the article Efficiency of water resources’ use in the regions of the North-West federal district in view of the water strategy
Competitiveness, advanced technology, equilibration of the territories’ socio-economic development and life quality’s improvement should become the strategic reference points of Russia’s economic development in the long-term prospect. Aims’ achievement in the specified directions is substantially connected with the development of the water-industrial economic structures [1]. In view of the determining role of the water-resources’ providing, “Water strategy of the Russian Federation for the period till 2020” (authorized by the Russian Federation Government’s decree from August, 27, 2009 № 1235-р), directed on the effective water resources’ utilization was worked out. The major priority-driven directions of the water industry’s development in the long-term prospect are [2]:
-
- guaranteed providing of the population and the economy’s branches with the water resources;
-
- protection and restoration of the water objects’ ecosystems to the state providing ecologically favorable conditions for the population’s life;
-
- providing population’s and economic objects’ immunity from flooding and negative influence of the waters.
According to the mentioned Government’s decree the programs of the regional socioeconomic development should include the actions set by Water strategy and the plan of its realization.
Principal prognosis’ parameters in the Russian Federation. In view of the scenarios of the national economy’s development and rates of growth, considered in the Concept of the long-term socio-economic development of the Russian Federation, and of the water industry’s condition, the principal prognosis’ parameters of Water strategy, which are necessary to be reached in the water use by 2020, are specified. The water-resource component of the country’s innovational development for the first time is estimated by with the integrated parameter that is the water-retaining capacity of the gross national product. In 2007 its value made 2.4 m3/thousand rubles; this level of the water consumption is estimated as an inadmissibly high one in comparison with the economically advanced countries. With the purpose of the increase of the water use’s efficiency it is planned to lower the value of the water-retaining capacity of the gross national product to 1.4 m3/thousand rubles, i.e. for 42% by the year of 2020.
Alongside with this criterion Water strategy includes the following parameters as the principal prognosis’ indicators describing the water industry’s condition: water losses at its transportation; the share of the polluted sewage which are fused insufficiently cleared or completely crude into the water objects; the quantity of the polluting substances in the structure of the sewage which is to be cleared; the share of the water industry’s sites in the economically advanced areas with the water quality estimated as “relatively pure” and “slightly polluted”.
The characteristics of the considered parameters of the water industry for 2007 and the expectant results of the increase of the water use’s efficiency and the decrease of the anthropogenic influence on the water objects are represented in table 1 .
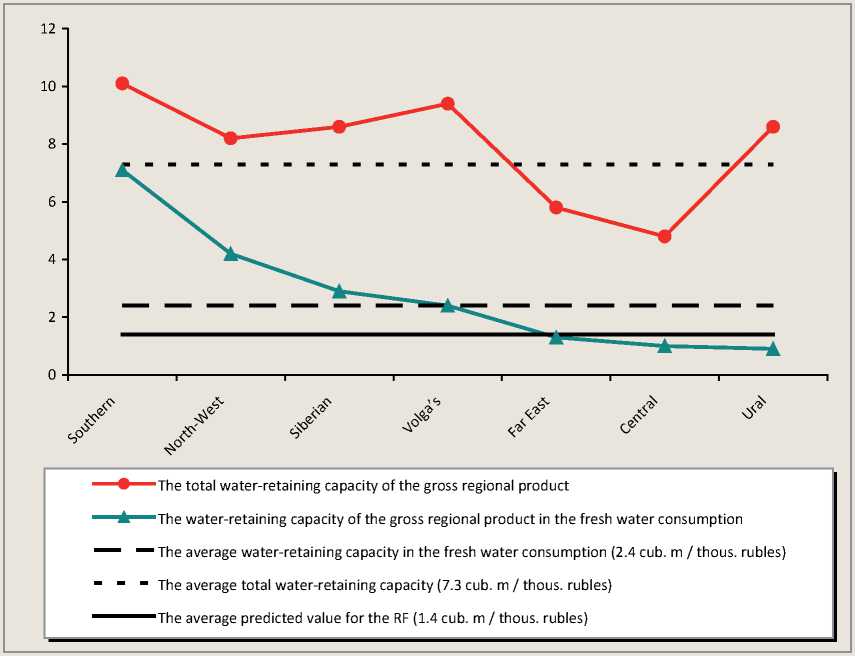
It is necessary to emphasize that the parameter “the water-retaining capacity of the gross national product” takes into account the consumption of the fresh water only. The use of the full water-retaining capacity’s parameter, estimated on the base of the total amount of the fresh and reused water’s consumption, as the control indicator of the realization of the planned actions is not considered by the Water strategy. In our opinion skipping the role of this criterion prevents the optimum variant’s choice for the decision of the problem of the regional water-retaining capacity’s decrease. In figure1 the parameters’ values of the water-retaining capacity in the federal districts are represented; from this comparison it is clear that in the fresh water use the most water-capacious are the Southern (7.1 m3/thous. rubles) and the NorthWest (4.2 m3/thous. rubles) districts. At the same time, if the Southern federal district also keeps the first position in the general waterretaining capacity (10.1 m3/thous. rubles), the North-West federal district (8.2 m3/thous. rubles) ranks fifth after the Southern, the Volga’s, the Siberian and the Ural districts.
According to the data in figure the 42% decrease of the existing water-retaining capacity of the gross regional product which will provide the average level of 1.4 m3/thous. rubles in the Russian Federation, can be a problem for some regions and it demands searching possible ways of the efficiency’s increase of the water resources’ use, including the development of the recycling water supply systems. Due to the dynamics of the water industry’s parameters for the period from 1990 to 2007 (tab. 2) it can be noted, that to present day in the water consumption’s volumes in all the districts the values’ levels of 1990’s are not achieved.
Table 1. Principal prognosis’ parameters of the major directions of the national water industry’s development according to Water strategy of the Russian Federation
|
Control parameters |
Parameter value |
Required decrease by 2020 |
|
|
2007 |
By 2020 |
||
|
I. Water-retaining capacity of the gross national product, m3/thousand rubles |
2.4 |
1.4 |
42% |
|
Water losses at transportation, % |
10 |
5.0 |
In 2 times |
|
II. Share of the polluted sewage fused into the water objects, % |
89 |
36 |
In 2.5 times |
|
Quantity of the polluting substances in the structure of the sewage, million tons |
11 |
6.6 |
In 1.7 times |
|
Share of the water industry’s sites with the water quality estimated as “relatively pure” and “slightly polluted”, % |
-* |
Not less than 40 |
Increase** |
|
III. Territories’ immunity degree from flooding and other negative influence of waters, % |
16 |
50 |
In 3.1 times |
|
Quantity of the population protected from flooding and other negative influence of waters, one million people |
1.9 |
4.8 |
Increase in 2.5 times |
|
Share of the emergency hydraulic engineering constructions, % |
5.0 |
0 |
100 |
|
* The information is not available. ** Due to the planned reduction of the ecological influence on the environment in 2.5 times. |
|||
Table 2. The water industry’s parameters determining the water-retaining capacity of the made gross regional product, and their change in the federal districts for the period from 1990 to 2007
|
Parameters |
5 |
S’ |
co |
5 |
о |
||
|
Parameters’ value in 2007 Share of the reused water in production – % |
35 * |
48 |
81 |
72 |
94 |
86 |
84 |
|
Share of the fresh water’s consumption for the industrial needs, % |
27+50 ** |
87 |
71 |
75 |
55 |
61 |
66 |
|
industrial and drinking needs, % |
9 |
11 |
22 |
17 |
31 |
34 |
29 |
|
Parameters’ change (2007 to 1990): - the fresh water’s consumption, % |
56 |
81 |
67 |
66 |
76 |
63 |
50 |
|
- volume of the reused water, % |
68 |
88 |
77 |
84 |
101 |
87 |
64 |
|
- total water consumption, % |
59 |
84 |
74 |
77 |
98 |
80 |
60 |
|
- volume of the sewage, relatively pure without cleansing, % |
47 |
93 |
102 |
99 |
112 |
61 |
52 |
|
* It is determined taking into account the fresh water’s consumption for irrigation ** The share of the fresh water’s consumption for irrigation. |
. |
Figure 1. The water-retaining capacity’s parameters of the made product in the Federal Districts in 2007, m3/thousand rubles
The greatest rates of the total water consumption’s growth can be noted in the Ural federal district (98%), mainly due to the increase of the reused water supply’s volume which made
101% to the level of the year of 1990. At the same time the volume of the sewage of the “relatively pure without cleansing” category increased and made 112% that specifies the backlog of the capacities’ growth at the reused water supply’s systems. The insufficient rates of the recycling water supply systems’ development are also noted in the districts with the outstripping growth of the relatively clean sewage’s volumes: in the Volga’s federal district the level of 1990 is exceeded for 2%, in the Siberian federal district it made 99%, in the North-West federal district it made 93% (see tab. 2).
According to the Water strategy the regions with the greatest water supply (Siberian, Far East) have the priority value at placing such new large and water-capacious manufactures, as metallurgical, chemical, pulp-and-paper industries. On the territories of other districts (North-West, Central, Volga’s, Southern and Ural districts) the water-capacious manufactures’ development is provided by the existing capacities’ enhancement and expansion with simultaneous water recycle systems’ introduction.
The designated reference points of the water industry’s development in these regions, including the North-West federal district, and their achievement estimated by the control indicator “water-retaining capacity of the gross national product” (for regions “water-retaining capac- ity of the gross regional product”), demand the analysis of the existing water-industry’s situation at the regional level, and the timely elaborating of the program decisions on the increase of the water resources’ effective use.
Principal prognosis’ parameters according to the Water strategy in the regions of the NWFD. For the regions of the North-West federal district distinguished by the high water-retaining capacity, production’s branch structure and natural and climatic conditions, the plan of measures on the water-retaining capacity’s reduction will be determined by the rated parameters represented in table 3 .
Preliminary calculations of the prognosis’ parameters concerning the basic year of 2007 show that at the approach by the principle of “ratability” to the parameters’ decrease the most adverse position is characteristic for the regions with the least water-retaining capacity of the gross regional product, such as Novgorod region, Kaliningrad region and Saint Petersburg, where the average level of the water-retaining capacity in the gross regional product is lower than the average planned level in the Russian Federation in general. At the
Table 3. Principal prognosis’ parameters of the water use in the regions of the North-West federal district according to the Water Strategy
|
Subjects of the North-West federal district |
Water-retaining capacity of the gross regional product (fresh water), m3/thousand rubles |
Water losses at transportation, %/million m3 |
Amount of the polluted sewage of the drains’ volume, %/million m3 |
|||
|
Reduction by 2020 |
||||||
|
for 42% |
in 2 times |
in 2.5 times |
||||
|
2007 |
2020 |
2007 |
2020 |
2007 |
2020 |
|
|
Leningrad region |
20 |
11.6 |
6.4 / 40.2 |
3.2/-* |
99.97 / 324.4 |
40 /-** |
|
Murmansk region |
8.4 |
4.9 |
1.0 / 19.0 |
0.5/- |
95.9 / 383.4 |
38 /- |
|
Pskov region |
4.6 |
2.7 |
2.8 / 8.5 |
1.4/- |
100 / 57.4 |
40 /- |
|
Vologda region |
3.0 |
1.7 |
1.6 / 12.2 |
0.8/- |
76 / 155.9 |
30 /- |
|
Archangelsk region |
2.4 |
1.4 |
4.6 / 34.6 |
2.3/- |
98 / 476.4 |
39 /- |
|
Komi Republic |
2.2 |
1.3 |
3.2 / 18.8 |
1.6/- |
63 / 121.3 |
25 /- |
|
Karelia Republic |
2.16 |
1.3 |
4.5 / 10.7 |
2.3/- |
99 / 204.0 |
40 /- |
|
Novgorod region |
1.2 |
0.7 |
13.6 / 16.8 |
6.8/- |
99.4 / 75.1 |
40 /- |
|
Saint Petersburg |
1.1 |
0.6 |
6.7 / 90.6 |
3.4/- |
100 / 187.0 |
40 /- |
|
Kaliningrad region |
1.0 |
0.6 |
8.6 / 14.7 |
4.3/- |
100 / 115.8 |
40 /- |
|
NWFD |
4.2 |
2.4 |
2.1 / 266 |
1.0/- |
95 / 3101 |
38 /- |
* Absolute values will depend on the diversion capacity’s value and within the given research were not considered (in the Water Strategy of the Russian Federation it is noted, that by 2020 the country’s need for water resources will be guaranteed and provided in the volume of 107 million m3, i.e. it will increase for 34%);
** Absolute values of the parameter by 2020 depend on the diversion capacity’s value, industrial water use and other factors demanding a more detailed analysis, lying beyond the available statistical database.
same time, as it is expected, by 2010 the 42% decrease of the water-retaining capacity in the gross regional product will be achieved by all the regions, the part of them will remain outside the established value of 1.4 m3/thousand rubles (the Leningrad, Murmansk, Pskov and Vologda regions). In our opinion, such approach concerning the water-retaining capacity in the gross regional product which does not take into account differences in the starting conditions of the regions and their socio-economic differentiation is not justified.
Water losses at transportation, represented in table 3, according to the statistics [3], make more than 5% in four subjects of the NorthWest federal district: the Novgorod region (13.6), the Kaliningrad region (8.6), the Leningrad region (6.4) and Saint Petersburg (6.7). First of all it is necessary to provide measures on the pipeline systems’ enhancement in these subjects.
The least regions’ distinction is noted in the parameter “the share of the polluted sewage”, in all the subjects of the District its value is close to 100% except some cases (in Komi Republic it is 63%, in the Vologda region it is 76%). At the required decrease in 2.5 times of this parameter by 2020 its value in the most part of the District’s subjects should make 38 – 40% of the volume of sewage to be cleared. The reduction of this category of drains is expected, first, due to the increase of the purification efficiency and, hence, the reductions of the amount of the sewage not cleared enough. Second, clearing complexes’ enhancement and in some cases additional capacities’ putting into operation should provide clearing constructions’ stable and effective work that will allow to reduce the volume of the sewage taken away into the water objects without clearing. As the result of the mentioned measures polluting substances’ dumping into the water objects can be decreased. At the same time there are doubts that at achieving the specified value of the planned dumping (of the polluted sewage and the polluting substances in its structure) the ecologically allowable influence will be provided. In our opinion, the rating of 38 – 40% of the parameter “the share of the polluted sewage”
is too high, first of all the other approach based on the basin’s principle with the account of the circuits of complex use and of the water objects’ protection is required for its establishment.
Opportunities of the principal parameters’ achievement by the subjects of the NWFD. For estimating the opportunities of the principal parameters’ achievement of the increase of the water industry’s efficiency in view of the tasks set in the face of the regions by 2020, and for the differentiated approach’s use for their development the analysis of the parameters in the NWFD regions is carried out: river drain resources, population, water consumption and water drain (fresh and reused water use in production, specific water consumption for the industrial and drinking needs, water losses, sewage’s quantity and its structure according to the pollution degree, etc.), the gross regional product, the gross regional product per head, the branch structure of production [3, 5, 6].
Water resources of the NWFD regions. As a whole the NWFD territory is characterized by a high rate of the water supply and in this respect has favorable conditions for the water-capacious economic branches’ development. For example, the water potential of the NorthWest federal district almost five times surpasses the potential of the Central federal district. But these resources are arranged irregularly and in some settlements water-industrial problems can take place.
In figure 2 on the basis of the data [3] the parameters characterizing the NWFD regions’ heterogeneity in the water resources and their use are represented. Archangelsk region and Komi Republic have the greatest water potential, surpassing accordingly in 32 and 14 times the potential of the Pskov region (12 km3/year). The available resources in these regions caused the most water-capacious economic branches’ development (energy and pulp-and-paper).
The share of the water resources’ use in the NWFD regions, represented in (see fig. 2), takes into account only the fresh water use which amount essentially differs from all water sources’ use in the Leningrad region. Here the annual fresh water use makes 1,613 million m3 (25.5% of the total amount). In the parameter
Figure 2. NWFD regions’ differentiation in the water resources and their use
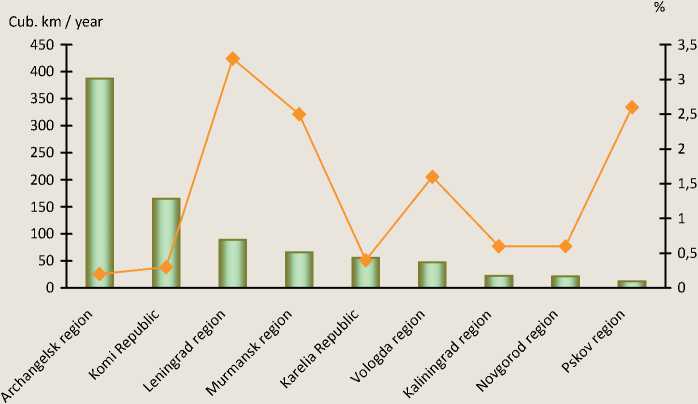
I—I Water resources (average long-term value), cub. km / year Share of the fresh water use, %
of the water resources’ use in the Leningrad region (3.3%) the value of the water use in Saint Petersburg (1,353 million m3) is taken into account. From the comparison of the considered data it follows that on the quantitative indicators the NWFD regions have considerable potential for the water-capacious branches’ development.
Water consumption in the NWFD regions is characterized on the statistics’ basis [3] with the parameters represented in table 4 .
The annual water consumption in the NWFD regions makes from 300 to 7,608 million m3 (1:25), including the fresh water consumption from 107 to 6,255 million m3 (1:58), and the specific drinking water consumption from 112 to 351 liters / 24 h per head (the average value in NWFD 254 liters / 24 h per head). The least volumes of the fresh water consumption are in the Pskov, Kaliningrad, and Novgorod regions and in Karelia Republic. Here the lowest specific water consumption for the industrial
Table 4. Water consumption’s parameters in the NWFD regions (2007)
In the majority of the regions the prevailing part of the fresh water consumption goes for the industrial needs (60 – 97%), in Saint Petersburg, the Novgorod region and the Kaliningrad region the consumption makes about 50%. In the regions the fresh water savings, determined by the reused water use, amounted to 18 – 84%. The least value concerns to the Leningrad region; the greatest one concerns to the Novgorod and Vologda regions.
The regions of NWFD also differ in the water drain : the total amount of the sewage dumped into the water objects, makes from 82 to 6,181 million m3 (1:75), including the sewage, which draining is permitted without clearing, from 6 to 5,856 million m3 (1: 976), the volume of the polluted sewage dumping owing to the insufficient clearing or its absence makes from 57 to 1,187 million m3 (1: 21) (tab. 5) .
From the analysis of the water draining structure it follows, that about 73% of the sewage dumping is made by the category “relatively pure, without clearing” and 27% – “needing clearing”. The main part of the relatively pure water is made by the sewage dumping in the Leningrad region (68%), the minimal value of 0.07% concerns to the Novgorod region.
The greatest amount of the sewage demanding clearing, characterizes the water drain in Saint Petersburg (36.5% of the total amount in the district), the least one is observed in the Pskov region (1.8%).
An inadmissibly low degree of clearing is characteristic for the work of the clearing water drain’s complexes in all the District’s subjects, that is specified by the dumping structure’s parameters (“relatively cleared” and “polluted”, including the part of dumping without clearing) (see tab. 5). As a whole in the NWFD the share of the relatively cleared sewage makes only 4.6% of the quantity of the water demanding clearing (fig. 3) .
Thus, the most part of the drains demanding purifying is dumped polluted into the water objects. The “contribution” of the District’s subjects to the water objects’ pollution on the territory of the North-West region is characterized by the share of the polluted sewage in the percentage of their total amount in the district ( fig. 4 ).
It is necessary to note that the estimation of the polluting “contribution” to the water objects at the account of the sewage’s pollution, and also of the polluting substances’ quantity in view of their harm is more objective [4].
The water protection’s condition in the District’s subjects is characterized by the data in figure 5, where the share of the polluted sewage, dumped into the water objects without purifying, is represented in each subject of the District.
Table 5. Water draining parameters in the NWFD regions (2007)
|
Subjects of the North-West federal district |
Amount of the sewage dumped into the water objects, million m3 |
||||
|
In all |
Of them |
||||
|
relatively pure, without clearing |
demanding clearing, in all |
Including |
|||
|
relatively cleared |
polluted |
||||
|
Leningrad region |
6,181 |
5,856 |
325 |
0.08 |
325 |
|
Murmansk region |
1,756 |
1,356 |
400 |
16 |
384 |
|
Saint Petersburg |
1,317 |
130 |
1,187 |
0 |
1,187 |
|
Archangelsk region |
675 |
188 |
487 |
11 |
476 |
|
Vologda region |
674 |
469 |
205 |
49 |
156 |
|
Komi Republic |
513 |
321 |
192 |
71 |
121 |
|
Pskov region |
291 |
234 |
57 |
0 |
57 |
|
Karelia Republic |
241 |
35 |
206 |
2 |
204 |
|
Kaliningrad region |
137 |
21 |
116 |
0 |
116 |
|
Novgorod region |
82 |
6 |
76 |
1 |
75 |
|
In NWFD |
11,866 |
8,615 |
3,251 |
150 |
3,101 |
Figure 3. Sewage dumping structure after water clearing complexes in the North-West federal district
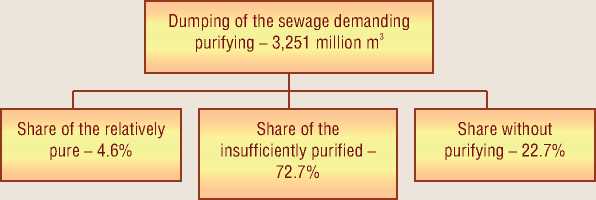
Figure 4. Polluted sewage dumping into the water objects in the NWFD subjects, %
Kaliningrad region; 3.7j
Komi Republic; 4j---
Vologda region; 5 j
Novgorod region; 2.4
Pskov region; 1.8
Leningrad region; 10.5
Murmansk region; 12.4
Karelia Republic; 6.6
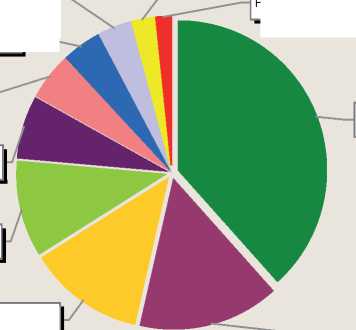
Saint Petersburg; 38.3
Archangelsk region; 15.3
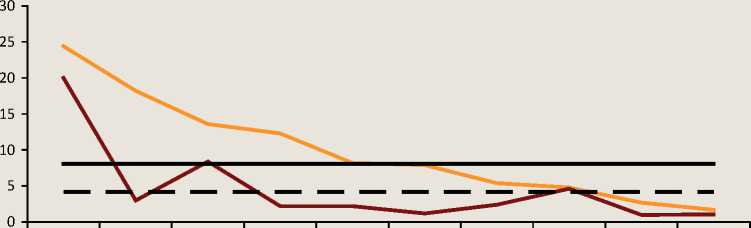
This parameter reflects the unsatisfactory condition of the clearing constructions which do not provide the required degree of purifying owing to out-of-date technologies’ application, deteriorated or incomplete set of constructions. Its value in the District makes 22.7% that exceeds the average level in the RF (18%).
Less critical is the situation in Komi Republic where the ratio between relatively cleared and polluted sewage makes 1:1.7 and in Vologda region the ratio is 1:3.2 (as a whole in the District it is 1:21, in the Russian Federation it is 1:12).
Connection of the water consumption with the general socio-economic indices. For the comparative characteristic of the regions the factors of the parameters’ differentiation were defined (the ratio between the parameter value’s excess and the minimal value – Pdiff.), the most significant in the socio-economic plan. The valuesof P
. diff. in the considered parameters for the regions are represented in figure 6, where the NWFD regions are placed according to the general water consumption decrease.
The analysis showed that the Pskov region has the least potential: in the gross regional product (63,108 million rubles, in figure 6 it corresponds Pdiff. = 1), in the gross regional product per head (88,967 rubles) and in the volume of the total water consumption (300 million m3); and the Novgorod region has the same tendency: in population (655 thous. people) and in the fresh water consumption (107 million m3).
The maximal distinctions of the NWFD regions, concerning its subjects with the least
Figure 5. Quantity of the polluted sewage without purifying dumped into the water objects in the NWFD subjects
Saint Petersburg 40
Komi Republic
Vologda region
Karelia Republic
Archangelsk region
Pskov region
Novgorod region
17,7
Leningrad region
Kaliningrad region
Murmansk region
---- Dumping of the polluted sewage without purifying into the water objects, % of the water demanding purifying ^^^м ^^^^^ On the average in the NWFD (22.7%)
Figure 6. Parameters characterizing the NWFD regions’ distinction, 2007
^^^^^^^^Total water consumption (1 = 300 million cub. m) ^^^^^^^^ Fresh water consumption (1 = 107 million cub. m)
^^^^^^^^Gross regional product (1 = 63,108 million rubles)
Gross regional product per head (1 = 88,967 rubles)
^^^=^^^= Population (1 = 655 thousand people)
potential, are characterized by the following values of Pdiff.: а) Saint Petersburg – 7 times in population; 17.6 times in gross regional product; b) Komi Republic – 2.8 times in gross regional product per capita; c) the Leningrad region – 58.5 times in the fresh water consumption and 25.4 times in the total water consumption. Analyzing the criteria Pdiff. represented in figure 6, it is possible to note that in the ranged number of population among the NWFD subjects Saint Petersburg where at the high gross regional product there are rather low volumes of the total water consumption and considerable volumes of the fresh water consumption (the third position after the Leningrad and Murmansk regions) stands aside. It can be explained by the water consumption structure in Saint Petersburg, which has equal shares of the industrial needs (47%) and drinking ones (47%) (see tab. 4). Here the high volumes of the fresh water consumption are caused by the plentiful population.
Besides, according to figure 6, for the Leningrad, Murmansk and Vologda regions the total water consumption’s rise is characteristic at the relatively low volumes of the gross regional product and the smaller population, in comparison with the marked Pdiff. for Saint Petersburg. In the Leningrad and Murmansk regions the growth of the total water consumption and the fresh water consumption are noted that is caused by the low share of the reused water supply. In the first case it makes about 18%, in the second case it makes 39% (see tab. 4). The situation in Vologda region is different due to the fact that there isn’t the sudden change of the fresh water parameter here that is caused by the high 84% share of the reused water supply.
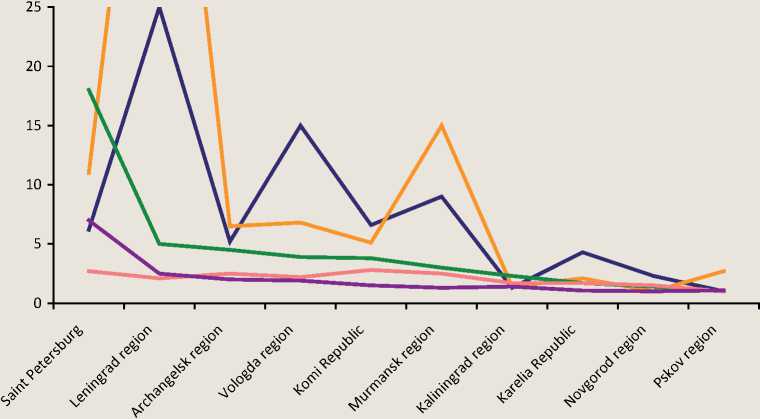
Total water-retaining capacity and the waterretaining capacity in the fresh water in the structure of the gross regional product. Taking into account the inconsistence between the socioeconomic indices and the water consumption’s level let’s consider their connections, using the criterion “the water-retaining capacity in the gross regional product” (the amount of the water for one unit of the made gross regional product). This criterion is the integrated reflection of the socio-economic differentiation of the Russian regions. Its value for each region is represented in figure 7 by two parameters: the water-retaining capacity in the fresh water in the gross regional product and the total water-retaining capacity in the gross regional product in view of the industrial use of the reused water. The second parameter is necessary to be taken into account alongside with the first one at elaborating concrete decisions on the water-retaining capacity’s decrease in the gross regional product. Also in figure the average levels of the total water-retaining capacity in the gross regional product in the fresh water consumption are represented; in 2007 in the North-West federal district they made 8.1 and 4.2 m3/thousand rubles accordingly.
The Leningrad (20), Murmansk (8.4) and Pskov (4.6) regions have high rates of the fresh water consumption relative to the average value of the water-retaining capacity in the gross regional product in the District (4.2). Relative to the total water consumption the most water-capacious regions are Leningrad (24.4) and Murmansk (13.6) regions. The Vologda region (18.2) and Karelia Republic (12.3) also belong to this group.
With the purpose of revealing the opportunities of the average level’s decrease of the water-retaining capacity of the gross regional product in the District from 4.2 to 2.4 m3/ thousand rubles according to the Water strategy it is necessary to compare two kinds of the water-retaining capacity in each subject of the District. On the basis of these parameters’ comparison we can draw the conclusion that the decrease of the water-retaining capacity of the gross regional product in the fresh water is necessary to carry out in the regions with the low water rotation (the Leningrad and Murmansk regions). More detailed researches of the regional industrial production’s structure, production specificity’s studying and the opportunities of the more effective use of the water resources are necessary for other regions.
In our opinion it is necessary to relate the use of the sewage of the category “relatively pure, without clearing” to these opportunities. As the basis of the mentioned proposal the following parameters’ ratings are represented in figure 8 for the NWFD regions: operating ratio of the reused water in production (%), the amount of the sewage “relatively pure, without clearing” in percentage relative to the volume of the reused water.
From the comparison of the considered parameters values it follows that the higher values of the water rotation in industry correspond the smaller volumes of the relatively pure sewage and their smaller share relative to the volume of the reused water. Thus the water-retaining capacity if the gross regional product in the fresh water is higher in the regions with the smaller water rotation and the high share of the relatively pure sewage. First of all, it is necessary to note the Murmansk and Leningrad regions, where the volumes of the relatively pure sew-
Figure 7. Parameters of the water-retaining capacity of the gross regional product in the NWFD regions in 2007, m3/thousand rubles
Total water-retaining capacity of the gross regional product
Water-retaining capacity of the gross regional product in the fresh water
Average value of the total water-retaining capacity of the gross regional product in the NWFD (8.1)
Average value of the water-retaining capacity of the gross regional product in the fresh water (4.2)
Figure 8. NWFD subjects’ characteristic according to the parameters, defying water-retaining capacity of the gross regional product in the fresh water
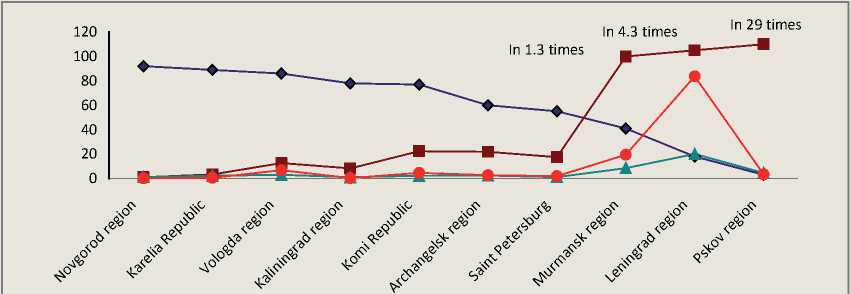
Share of the reused water use, %
Amount of the sewage “relatively pure, without clearing”, % of the reused water volume
Water-retaining capacity of the gross regional product in the fresh water, cub. m / thousand rubles
Sewage “relatively pure, without clearing” (1 = 70 million cub. m)
age exceed the volumes of the reused water supply in 1.3 and 4.3 times accordingly. In the Pskov region this excess is the maximal (in 29 times), as the volume of the reused water is small (8.08 million m3) thus ratio of the reused water = 3%, the share of the industrial water consumption is great (84% – 245 million m3, see tab. 4) and the volume of dumping the sewage of the category “relatively pure without clearing” is considerable (234 million m3).
Thus, from the analysis it follows, that the parameter of the relatively pure water is necessary for considering as the criterion supplementing the regions’ characteristic in the water resources’ use.
Parameters of the water drain in the gross regional product. For the comparative estimation of the water industry’s situation in the regions and the effective water resources’ use alongside with the considered parameters of the waterretaining capacity of the gross regional product it is necessary to define the similar parameters in the water drain which can be the control indicators of the water-retaining capacity’s decrease. For the NWFD subjects in table 6 the parameters of the water drain of the gross regional product of various sewage’s categories (sewage in all, relatively pure without clearing, polluted, and polluted without clearing) are represented. The parameters of the sewage’s category “relatively pure” are not represented, as their cost values in the District’s subjects are small or equal to zero (Saint Petersburg, the Kaliningrad and Pskov regions); as a whole in the NWFD their value makes 0.05 m3/thous. rubles.
The data represented in table 6 correlate with the parameters of the water-retaining capacity of the gross regional product mentioned above. The regions with the high water-retaining capacity of the gross regional product make up the group with the greatest volume of the water drain in the category “in all”: the Leningrad (19.8 m3 / thousand rubles), Murmansk (9.1) and Pskov (4.6) regions. In NWFD the average value of this parameter made 4.3 m3/thousand rubles. As it was noted earlier (see fig. 8), the mentioned regions were noted in dumping sewage of the category “relatively pure without clearing”, that is caused by the low share of the reused water use in industry (in 2007 they made 17, 41 and 2% accordingly – the lowest values of this parameter in the District).
By the amount of the sewage for a unit of the made product, which demand purifying, the most “contaminant-capacious” regions are Karelia Republic (2.0 m3/thous. rubles), the Murmansk (2.1) and Archangelsk (1.7) regions; the less “contaminant-capacious” (0.8 m3/ thous. rubles) regions are Komi Republic and the Kaliningrad region. The contaminant capacity’s value of the gross regional product in the other District’s subjects made 0.9 – 1.1 m3/ thous. rubles. From the comparison of the specific water drain’s parameters it follows that the branch structure of production causes the certain expenses’ volume connected with the necessity of sewage’s sterilization, and in the NWFD subjects it differs up to 3 times on a unit of the made product. The ratings of the polluted sewage’s dumping, represented in table 6 , also specify the insufficient water protection financing and the large scale of the caused damage to the water ecosystems in the District’s subjects. The considered parameters of the water drain of the gross regional product are necessary for being taken into account in the programs of the regional socio-economic development, at the decision of the financing questions in the water protection sphere and for using as the additional control indicators at the estimation of the efficiency of carrying out the actions on the water-retaining capacity’s decrease.
Efficiency of the water resources’ use in the NWFD subjects. Estimation of the efficiency of the water resources’ use in the District’s subjects is represented in table 7 as the result of the analysis of the water use parameters carried out earlier. As the basic estimated parameters were considered the following ones: the waterretaining capacity of the gross regional product (total and in the fresh water consumption), dumping the relatively pure water as the share of the reused water volume, the share of the reused water use in industry. Preliminarily the regions were divided into three groups depending on the value of the total water-retaining capacity of the gross regional product and in view of its average value in the District:
Table 6. Parameters of the water drain in the gross regional product in the NWFD subjects (2007)
|
Amount of sewage in categories |
||
|
1. “In all” in the District – 4.3 m3/thousand rubles In its subjects: |
||
|
Leningrad region – 19.8 Murmansk region – 9.1 Pskov region – 4.6 |
Vologda region – 2.8 Archangelsk region – 2.4 Karelia Republic – 2.3 Komi Republic – 2.1 |
Saint Petersburg – 1.2 Kaliningrad region – 0.9 Novgorod region – 0.9 |
|
2. “Relatively pure without clearing” in the District – 3.1 m3/thousand rubles In its subjects: |
||
|
Leningrad region – 18.7 Murmansk region – 7.0 Pskov region – 3.7 |
Vologda region – 1.9 Komi Republic – 1.3 Archangelsk region – 0.7 |
Karelia Republic – 0.3 Saint Petersburg – 0.1 Kaliningrad region – 0.1 Novgorod region – 0.1 |
|
3. “To be cleared” in the District – 1.2 m3/thousand rubles In its subjects: |
||
|
Murmansk region – 2.1 Karelia Republic – 2.0 Archangelsk region – 1.7 |
Saint Petersburg – 1.1 Leningrad region – 1.1 Novgorod region – 0.9 Vologda region – 0.9 |
Pskov region – 0.9 Komi Republic – 0.8 Kaliningrad region – 0.8 |
|
Including “polluted” in the District – 1.1 m3/thousand rubles In its subjects: |
||
|
Murmansk region – 2.0 Karelia Republic – 2.0 Archangelsk region – 1.7 |
Saint Petersburg – 1.1 Leningrad region – 1.0 Novgorod region – 0.9 Pskov region – 0.9 |
Kaliningrad region – 0.8 Vologda region – 0.6 Komi Republic – 0.5 |
|
Of them “polluted, without clearing” in the District – 0.3 m3/thousand rubles In its subjects: |
||
|
Saint Petersburg – 0.39 Murmansk regions – 0.34 Archangelsk region – 0.30 |
Leningrad region – 0.18 Vologda region – 0.16 Kaliningrad region – 0.14 |
Karelia Republic – 0.12 Novgorod region – 0.11 Pskov region – 0.08 Komi Republic – 0.04 |
-
- in the territorial water resources’ supplies the North-West federal district ranks third after the Far East and the Siberian districts (in comparison with the Ural federal district); in the water-retaining capacity of the gross regional product and the parameters of the water drain of the gross regional product (“contaminant capacity” of the made product) the NWFD takes the leading position both as a whole and in the comparative estimation of the regions characterized by the low water use efficiency;
-
- development and realization of the measures on the 42% decrease of the water-retaining capacity of the gross regional product in the NWFD subjects, which are settled by the accepted in 2009 Water strategy of the Russian Federation for the period till 2020 with the purpose of the water-resource provision of the regional socio-economic development, demand redesigning and approving of the circuits of the water objects’ complex use and protection being the main tool of the allowable
Table 7. Efficiency of the water use in the NWFD regions
Subjects of the NWFD
Sewage “relatively pure without cleaning”, % of the reused water volume
Share of the reused water in industry, %
Water-retaining capacity in the gross regional product, m3/thousand rubles
Water use’s efficiency
in the fresh water
total (fresh + reused)
Vologda region
12.6
86
3.0
More than 10
High
Karelia Republic
3.3
89
2.2
Leningrad region
> in 4.3 times
18
20.0
Low
Murmansk region
> in 1.3 times
41
8.4
Novgorod region
1.0
92
1.2
5 – 10
High
Komi Republic
22.3
77
2.2
Average
Arkhangelsk region
21.8
60
2.4
Pskov region
> in 29 times
3
4.6
Low
Kaliningrad region
8.2
78
1.0
Less than 5
High
Saint Petersburg
17.5
55
1.1
influence’s regulation (water sample, sewage dumping) on in the water-industrial river basins and providing water objects’ complex use and protection in the long-term prospect;
-
- as the control indicators of the realization of the Water Strategy’s regulations concerning the decrease of the water-retaining capacity in the regional economy, alongside with the offered in the Strategy, it is worthwhile to use the following parameters: the total water-retaining capacity of the gross regional product; the share of the reused water in production – the parameter reflecting the technological development of production and the water use efficiency; the specific water drain of the made product in the sewage categories “ pure without clearing”, “to be purified”, and other criteria of the
water drain, characterizing the “contaminant capacity” of the made product;
-
- it is necessary to realize the differentiated approach for revealing the prognosis levels of the regions’ water-retaining capacity in view of their distinctive features and the existing efficiency of the water resources’ use. With this purpose it is necessary to develop the system of the parameters reflecting the interrelation between the water use and the socio-economic characteristics of the regions. In our opinion, the mentioned in the given work approaches on the example of the comparative estimation of the water resources’ effective use in the NorthWest federal district’s subjects can be used as the methodical instruments of estimation of the water use efficiency’s rise.
References Efficiency of water resources’ use in the regions of the North-West federal district in view of the water strategy
- Concept of the long-term socio-economic development of the Russian Federation for the period till 2020: authorized by the Russian Federation Government’s decree from November, 17, 2008, № 1662-r.
- Water strategy of the Russian Federation for the period till 2020: authorized by the Russian Federation Government’s decree from August, 27, 2009, № 1235-r.
- State report “Water resources’ condition and use in the Russian Federation in 2008”. -M.: NIA-Nature, 2009. -457 p.
- Fomina, V.F. Water use and the payments’ technique for dumping sewage with the polluting substances in its structure (Komi Republic)/V.F. Fomina, A.V. Kokovkin. -Syktyvkar, 2005. -156 p.
- Data of the central statistical data base of the federal state statistics service . -Access mode: http://www.gks.ru.
- Regions of the North-West federal district. Socio-economic indices: stat. coll./KomiStat. -Syktyvkar, 2009. -203 p.
