Efficient Global and Region Content Based Image Retrieval

Author: Ibrahim S. I. Abuhaiba, Ruba A. A. Salamah
Journal: International Journal of Image, Graphics and Signal Processing(IJIGSP) @ijigsp
Article in issue: 5 vol.4, 2012.
Free access
In this paper, we present an efficient content based image retrieval system that uses texture and color as visual features to describe the image and its segmented regions. Our contribution is of three directions. First, we use Gabor filters to extract texture features from the whole image or arbitrary shaped regions extracted from it after segmentation. Second, to speed up retrieval, the database images are segmented and the extracted regions are clustered according to their feature vectors using Self Organizing Map (SOM). This process is performed offline before query processing; therefore to answer a query, our system does not need to search the entire database images. Third, to further increase the retrieval accuracy of our system, we combine the region features with global features to obtain a more efficient system. The experimental evaluation of the system is based on a 1000 COREL color image database. From experimentation, it is evident that our system performs significantly better and faster compared with other existing systems. We provide a comparison between retrieval results based on features extracted from the whole image, and features extracted from image regions. The results demonstrate that a combination of global and region based approaches gives better retrieval results for almost all semantic classes.
Content based image retrieval, Region based features, Global based features, Texture, Color, Gabor filter, Self organizing map
Short address: https://sciup.org/15012300
IDR: 15012300
Text of the scientific article Efficient Global and Region Content Based Image Retrieval
Published Online June 2012 in MECS
Content Based Image Retrieval (CBIR) is a set of techniques for retrieving semantically-relevant images from an image database based on automatically-derived image features [1]. CBIR is extremely useful in a plethora of applications such as publishing and advertising, historical research, fashion and graphic design, architectural and engineering design, crime prevention, medical diagnosis, geographical information and remote sensing systems, etc. [2]. The main goal of CBIR is efficiency during image indexing and retrieval, thereby reducing the need for human intervention in the indexing process.
Some of the existing CBIR systems extract features from the whole image not from certain regions of it; so, they are global features. Histogram search algorithms [3] characterize an image by its color distribution or histogram. Many distances have been used to define the similarity of two color histogram representations.
Euclidean distance and its variants are the most commonly used. The drawback of a global histogram representation is that information about object location, shape and texture is discarded. Color histogram search is sensitive to intensity variations, color distortions, and cropping. The color layout approach attempts to overcome the drawback of histogram search. In simple color layout indexing [3], images are partitioned into blocks and the average color of each block is stored. Thus, the color layout is essentially a low resolution representation of the original image. A relatively recent system, WBIIS [4], uses significant Daubechies' wavelet coefficients instead of averaging. By adjusting block sizes or the levels of wavelet transforms, the coarseness of a color layout representation can be tuned. Hence, we can view a color layout representation as an opposite extreme of a histogram. At proper resolutions, the color layout representation naturally retains shape, location, and texture information. However, in the color layout representation, the retrieval system cannot perceive color directly. In addition, color layout search is sensitive to shifting, cropping, scaling, and rotation because images are described by a set of local properties [1].
Image retrieval using only color features often gives disappointing results, because in many cases, images with similar colors do not have similar content. This is due to the fact that global color features often fail to capture color distributions or textures within the image.
-
D. Zhang [5] proposed a method combining both color and texture features to improve retrieval performance. The database images are indexed using both types of features. During the retrieval process, given a query image, images in the database are firstly ranked using color features. Then, in a second step, a number of top ranked images are selected and re-ranked according to their texture features. Two alternatives are provided to the user, one is the retrieval based on color features, and the other is retrieval based on combined features. When the retrieval based on color fails, the user uses the other alternative which is the combined retrieval. Since the texture features are extracted globally from the image; they are not an accurate description of the image in some cases, which degrades the system performance.
Region-based retrieval systems attempt to overcome the deficiencies of global feature based search by representing images at the object-level. A region-based retrieval system applies image segmentation to decompose an image into regions, which correspond to objects [6]. The object-level representation is intended to be close to the perception of the human visual system
(HVS). Since the retrieval system identifies what objects are in the image, it is easier for the system to recognize similar objects at different locations and with different orientations and sizes. Region based retrieval systems include the Natra system [7], and the Blobworld system [8]. The Natra and the Blobworld systems compare images based on individual regions. The motivation is to shift part of the comparison task to the users. To query an image, a user is provided with the segmented regions of the image and is required to select the regions to be matched and also attributes, e.g., color and texture, of the regions to be used for evaluating similarity. Such querying systems provide more control to the user. However, the user's semantic understanding of an image is at a higher level than the region representation. For objects without discerning attributes, such as special texture, it is not obvious for the user how to select a query from the large variety of choices. Thus, such a querying scheme may add burdens on users without significant reward.
Recently, Natsev et al considered the similarity model WALRUS [9], which is a robust model for scaling and translation of objects within an image. Each image is first decomposed into regions. The similarity measure between two images is then defined as the fraction of the area of the two images covered by matching regions. However, WALRUS focuses on the development of a fast and effective segmentation method instead of an image-to-image similarity measure. Consequently, region matching should be necessary before image matching. The authors proposed a greedy heuristic for computing the similar region pair set with the maximum area. The basic idea is to iteratively choose the best pair of matching regions that maximizes the area covered by the regions. The time complexity of their greedy algorithm is O(n 2 ) , where n is the number of matching pairs obtained by the R*-tree search.
In [10], the mean shift algorithm is used for segmentation of images and interesting regions are indexed using cluster-based R*-tree to increase the efficiency of the retrieval process. However, this system uses only color as image signature, which is sensitive to shifting, cropping, scaling, and rotation. Also, query is by image region matching, while a user’s semantic understanding of an image is at a higher level than region representation.
Region based image retrieval of [11] uses low-level features including color, texture, and edge density. For color, the histograms of image regions are computed. For texture, co-occurrence matrix based entropy, energy, etc., are calculated, and for edge density it is Edge Histogram Descriptor (EHD) that is used. To decrease the retrieval time of images, an idea is developed based on greedy strategy to reduce the computational complexity. In this strategy, the query image is compared to each of the target images in the database based on region matching in term of Euclidian distance between them. The system then arranges the segments of each image in decreasing order based on the size of each segment. When a query is presented to the system, it starts comparing from the first region, if the distance between the query region and the target region is less than a threshold value, the system continues to check the other regions; otherwise it exits and does not check the other segments marking the target image as an irrelevant one.
To measure the similarity between images, Li et al [12], proposed the Integrated Region Matching (IRM) algorithm, which allows matching a region of one image to several regions of another image. That is, the region mapping between any two images is a many-to-many relationship. As a result, the similarity between two images is defined as the weighted sum of distances in the feature space, between all regions from different images. Compared with retrieval systems based on individual regions, such as Blobworld, the IRM approach decreases the impact of inaccurate segmentation by smoothing over the imprecision in distances. IRM incorporates the properties of all the segmented regions so that information about an image can be fully used.
Fuzzy Club [13] addresses the issue of effective and efficient content based image retrieval by presenting an indexing and retrieval system that integrates color, texture, and shape information for the indexing and retrieval, and applies these features to regions obtained through unsupervised segmentation, as opposed to applying them to the whole image domain. Fuzzy Club emphasizes improving on a color feature “inaccuracy” problem in the region based literature–that is color histogram bins are not independent.
The aim of this paper is to propose a new CBIR system to: (1) reduce the semantic gap between low-level image features and the richness of human semantics, and (2) reduce the overall retrieval time. Our contribution is of three directions:
-
• Salient low-level texture features are extracted from arbitrary-shaped regions using Gabor filter, which has been a widely acclaimed natural and excellent tool in texture description, segmentation, feature extraction, and classification [14].
-
• Many of the existing systems attempt to compare the query image with every target image in the database to find the top matching images, resulting in an essentially linear search, which is prohibitive when the database is large. We believe this is not necessary. In fact, it is possible to exploit a priori information regarding the organization of the images in the database in the feature space before a query is posed, such that when a query is received, only part of the database needs to be searched. This certainly saves significant query processing time without compromising the retrieval precision. Therefore, the database images are segmented into distinct regions. A clustering algorithm, namely the Self Organizing Map (SOM), is used to cluster the image regions into groups. Similar regions are grouped together in the same cluster. This clustering process is performed offline, and each region’s indexing data along with its associated class ID is recorded in the index files. To answer a query, the query image is segmented into regions. The distances between each query region and all region cluster centroids in the database is computed to determine which
clusters these query regions belong to. The similar regions in the database are returned and all the images that have any of these regions are assigned as candidates. The query image is compared to the candidate image set instead of being compared to the whole database image.
-
• To further increase the performance of the system, we develop a global searching algorithm that uses texture and color features from the whole image to compute the distance between two images. This algorithm is combined with the region based searching algorithm using a weighted sum of the two distances.
The paper is organized as follows. A global content based image retrieval system is presented in section II. In section III, a region content based image retrieval system is described. Both systems are integrated into one system in section IV. Experimental results are reported in section V. Finally, the paper is concluded in section VI.
-
II. GLOBAL CONTENT BASED IMAGE RETRIEVAL SYSTEM
In this section, we introduce our proposed Global Content Based Image Retrieval (GCBIR) system. This system defines the similarity between contents of two images based on global features.
-
A. Texture feature
Gabor filter (or Gabor wavelet) is widely adopted to extract texture features from images for image retrieval [14, 15], and has been shown to be very efficient.
Manjunath and Ma [14] have shown that image retrieval using Gabor features outperforms that using Pyramid-structured Wavelet Transform (PWT) features, Tree structured Wavelet Transform (TWT) features and multiresolution simultaneous autoregressive model features. Therefore, we use the Gabor filter to extract global texture features from the whole image. A total of twenty-four wavelets are generated from the "mother" Gabor function, Equation (1), using four scales of frequency and six orientations.
-
( X,У)= а ™∙ д ( ̃, ̃) (1)
where m and n are integers specifying the scale and orientation of the wavelets, respectively, with m = 0, 1, 2, ..., M – 1, n = 0, 1, 2, ..., N - 1, M and N are the total number of scales and orientations, respectively, and ̃= а ™( х cos 9 + У sin 9 ) (2)
̃= а ™ (-х sin θ+ У cos 9 ) (3)
where a > 1 and = .
N
Redundancy, which is the consequence of the nonorthogonality of Gabor wavelets, is addressed by choosing the parameters of the filter bank to be the set of frequencies and orientations that cover the entire spatial frequency space so as to capture texture information as much as possible in accordance with filter design in [14]. The lower and upper frequencies of the filters are set to 0.04 octaves and 0.5 octaves, respectively, the orientations are at intervals of 30 degrees, and the halfpeak magnitudes of the filter responses in the frequency spectrum are constrained to touch each other [14]. Note that because of the symmetric property of the Gabor function, wavelets with center frequencies and orientation covering only half of the frequency spectrum are generated.
To extract texture feature from an image, we first convert the image from the RGB color space into gray level and implement the group of designed Gabor filters. Twenty four filtered images, (X,У), are produced by convolution of the gray level image and the Gabor filters as given in the equation:
-
( X , У )=∑∑ J ( X - S , У - t ) д ∗ ( s , t ) (4)
where s and t are the filter mask size variables, 9 ∗ is the complex conjugate of the mother Gabor function , and Gmn is the convolution result corresponding to the Gabor kernel at orientation m and scale n.
Using Equations (5), (6), and (7), the mean, 9тп , and variance, , of the energy distribution, Е ( т , п ) , of filters responses are computed:
E(m,n)=∑∑у|G (x,y)|(5)
.. — Е(,)
-
µ = ×(6)
√∑ ∑ у(| (X,У)|)
σ =(7)
mn р ×Q
Finally, the texture feature vector, T G , is obtained with 48 attributes:
TG=[µ00 σ00 µ01 σ01 µ02 σ02 ………․․μ35 σ35 ](8)
These steps are summarized below:
Step1: Convert the RGB image into gray level image. Step2: Construct a bank of 24 Gabor filters using the mother Gabor function with 4 scales and 6 orientations.
Step3: Apply Gabor filters on the gray level of the image. Step4: Get the energy distribution of each of the 24 filters responses.
Step5: Compute the mean, µ , and the standard deviation, σ , of each energy distribution.
Step6: Return the texture vector, T G , consisting of 48 attributes calculated at step 5. The attributes of the texture features vector may have different ranges; therefore, Min-Max normalization [16] is used to make all the texture features have the same effect in measuring image similarity.
To test the similarity between a query image, Q, and a database image, B, based on their texture feature we use the Euclidian distance for its simplicity.
-
B. Color feature
In the GCBIR system, we used global color histograms to extract the color features of images. We adopt to use the HSV (Hue, Saturation, and Value) color space for its simple transformation from the RGB (Red, Green, Blue) color space, in which images are commonly represented. The HSV color space is quantized into 108 bins by using uniform quantization (12 for H, 3 for S, and 3 for V); the choice of these parameters was motivated by [17]. Since Hue (H) has more importance in human visual system than saturation (S) and value (V), it is reasonable to assign bins in the histogram to Hue more than the other components. It is straightforward to generate the histograms of color images using the selected quantized color space.
The similarity metric we used in deriving the similarity between two color histograms is the Histogram Intersection Technique (HIT) [18]. In this technique, the similarity between two histograms is a floating point number between 0 and 1. Two histograms are equivalent when the similarity value is 1 and the similarity decreases as it approaches 0. Both of the histograms must be of the same size to have a valid similarity value.
Let H Q and H B denote the histograms of the query image and an image in the database, respectively, and S ( H Q , H B ) denote their similarity. Then, S ( H Q , H B ) can be expressed as [19]:
, ц \ - S zex,yer,zez min(H0(x,y,z),H B (x,y,z))
Q' min\lxex ^ eY ^ ezHQ(x,y,zy£xex ^ eY ^ ezHB(x,y,z)\ '
where X , Y , and Z are the arguments of the discretized color channels. This metric satisfies the associativity condition.
Finally, the distance, d C ( Q , B ), between the query image and the database image according to the extracted color feature is:
dc(Q,^) = 1-S(HQ,HB) (10)
-
C. Image matching and retrieval
The similarity between a query image, Q , and a database image, B , is defined in term of the distance, D G ( Q , B ), between them, which is assessed according to the extracted texture and color features. Two images are equivalent when the distance value between them is zero, and the similarity between them decreases as the distance increases. Using the texture distance, d T , and the color histogram distance, d C , we define the global distance D G ( Q , B ) as:
OC(Q, B) = wTdT + wcdc (11)
where wT and wc are weights for the texture and color distances, respectively. We used w= = 0.35 for texture and wc = 0.65 for color as have been used effectively in the literature [13].
The similarity between the query image and every image in the database is calculated. The top similar target images are retrieved to the user.
-
III. REGION CONTENT BASED IMAGE RETRIEVAL SYSTEM
The Region Content Based Image Retrieval System (RCBIR) attempts to overcome the deficiencies of the GCBIR system by representing images at the object level. The system applies image segmentation to decompose an image into regions, which correspond to objects. There are many proposed algorithms for automatic image segmentation; in our system we used the Texture and Boundary Encoding-based Segmentation (TBES) [20]. Since the retrieval system identifies what objects are in the image, it is easier for the system to recognize similar objects at different locations and with different orientations and sizes, thus results in more accurate retrieved results. However, some previous CBIR systems have the drawback of high computational complexity since they compare each region in a query image with each region in the database images, making the system inefficient. Our proposed solution to this problem is to index the image regions into subgroups via unsupervised clustering algorithm that maps the database image regions of similar visual features into separate clusters. The query image regions will also be mapped into these clusters and thus we need not to search all images in the database, but only those images that have regions in the same cluster with any of the query image regions; this will reduce the searching time to a high extent.
-
A. Texture feature
In our proposed RCBIR system, we use the same features we have used in the GCBIR system, which are texture and color, to represent each region extracted from the segmented image.
In the existing region based CBIR systems, visual features are extracted on pixel level, and each region is described by the average of these pixel features. However, we have found out that average pixel feature values are not efficient in describing the region’s content. We propose to extract the color and texture features from each image region after being segmented; this will help in representing the region efficiently and will make us free to use any image segmentation method without being obliged to use the same features used in that segmentation method.
In this context, there is one problem to be considered when extracting texture features using Gabor filters. Transforms such as Gabor filtering require the input image to be rectangular, which is not always true for regions resulting from image segmentation. An instinctive way is to obtain an inner rectangle (IR) from a region on which filtering can be performed. This works when the size of the filtering mask is much smaller than the size of the IR. But many regions are small, and the coefficients obtained cannot well describe the region. To solve this problem, we present an extended rectangle (ER) texture feature extraction method. By initial padding, our method extends an arbitrary-shaped region into a larger rectangle onto which Gabor filtering is applied. Then, a set of coefficients best describing the region is obtained, from which texture features can be extracted. In the literature, there are many padding techniques such as mirror padding and object-based padding; we have chosen zero padding for its simplicity and low cost computation.
As in the GCBIR system, we implement a bank of Gabor filters with 4 scales and 6 orientations to extract texture features from the ER of an image region. Then, we select the M largest coefficients in each of the 24 filtered output regions, since the high frequency components represent the object region and its boundary. By assuming spatial homogeneity of texture in each image region, the texture features are computed as the mean of the selected coefficients according to the formula:
Bmn =^x^yGmn(x,y) (12)
where x and y correspond to M largest coefficients.
Texture feature vector is:
Tr = [^ 0 0 Bo 1 Bo 2 '"^ 35 ] (13)
Image region texture features may have different ranges; therefore, a normalization method should be applied on each of them. We use the Min-Max normalization; the same as we did in the GCBIR system.
-
B. Color feature and region area/image area ratio
We use the HSV color space for color feature extraction. As the image regions extracted from the image after segmentation are approximately color homogeneous, it is possible to use the average HSV value in each channel of all pixels in the region as its perceptual color. We also use the standard deviation for each color channel resulting in six color features. The Min-Max normalization is used to have the values of each color feature in the range [0, 1].
The last feature we used is the region area/image area ratio. We propose that the area occupied by a region in an image gives information about its importance which should be greater for regions with larger areas.
-
C. Region matching
An image region is described by a feature vector of 30 normalized attributes, f 1 to f 30 . The first 24 features are for texture, and f 25 to f 30 are for color. To measure the similarity between two images we have to compare each region in one image to all the regions of the other image. We use the Euclidian distance between the feature vectors to find the distance between regions. The distance, dij , bet ween two image regions Ri and Rj is defined as:
dy =√ WT ∑k=l( fki - fkj )+ Wc ∑fc=2S ( fki - fkj ) (14) where fki and fkj are the k th features of the regions Ri and Rj , respectively, and WT and Wc are weights for texture and color features. We choose WT =1 , and Wc =2 because we have 24 texture features whereas the color features are only six, and thus we have to increase the effect of such few features.
-
D. Image similarity
Given a query image, Q, with nQ regions and a database image, B, with nB regions, we compute the total similarity between the two images using the following procedure:
Step 1: Using Equation (15), compute the distance, , between every region, Ri , in Q and all regions in B :
di , в = ( da ) ∀ Rj ∈ В (15) Step 2: Compute the similarity from the query image, Q , to the database image, B , as follows:
Di ( Q , В )=∑ , в (16) where at is the weight for region Ri in image Q ; we use the region area/image area ratio as its weight.
Step 3: The similarity distance between the query image and the database image given in Equation (16) is not symmetric. So, we compute the distance, , between every region, Rj , of a database image, B , and all regions of query image, Q , by:
dj , Q = ( djt ) ∀ Ri ∈ Q (17) Step 4: The distance from B to Q is defined as:
d2 ( в , Q )=∑ ^.«jdj , Q (18) where aj is the weight for region Rj in image B , and also we use the region area/image area ratio as its weight as we did in step 2.
Step 5: The overall distance between the two images Q and B is defined as:
Dr ( Q , в )= ( Q- , B- ) +d2 ( B- , ^ ) (19)
As compared with many existing similarity measures in the literature, this definition strives to incorporate as much semantic information as possible, and at the same time also achieves computational efficiency. Given this definition of distance, it is straightforward to compute the distance between a query image and all database images.
-
E. Database regions clustering
It is possible to make use of a priori information regarding the organization of images in the database in the feature space before a query is processed, such that when a query is received, only part of the database needs to be searched. This certainly saves significant query processing time without compromising the retrieval precision. To achieve this goal, we add a pre-retrieval processing phase after database features are constructed by applying a clustering algorithm in the region feature vector space to cluster all the regions in the database. This clustering is performed offline, and each region’s features data, along with its associated class number, is recorded in the database files.
For clustering, we used the Self Organizing Map (SOM) algorithm [21]. The main advantage of using the SOM network is that it automatically clusters the input space and is not sensitive to initialization. Also, the SOM network can be applied to a large scale of data, and most importantly, the learning of SOM can be incremental such that only new images can be used for new training of SOM.
The SOM is chosen to have two dimensional 10×10 nodes in grid-top topological organization; each of these nodes is considered as a cluster center. Each image region in the database is assigned a cluster number stored with it at the end of SOM training.
-
F. Image retrieval methodology
Given a query image, Q , our system processes the query as follows:
Step 1: Perform the query image segmentation to obtain all the regions, say we have n Q regions, R i , i = 1 to n Q , in the query image.
Step 2: For every, R i , calculate the closest SOM node, C j , also known as the best matching unit (BMU).
Step 3: Retrieve all the regions in the database that belong to node C j . These regions constitute a region set, U . The images containing any regions in the set U are retrieved. These images comprise an image set, V , and are the candidate images.
Step 4: Compare the query image with the images in the set V using the distance D R ( Q , B ), Equation (19). The top-least-distance images are returned to the user.
-
IV. INTEGRATED GCBIR AND RCBIR SYSTEM
Since the region based approach consumes more time in image retrieval due to the segmentation process besides working on each image region for feature extraction and similarity measure, the global features based method may give good results in shorter time. We propose that our overall system to have three alternatives to answer an image query:
-
(a) First we return to the user the results using GCBIR approach. If the results are not satisfying we move to the second choice.
-
(b) We apply RCBIR approach; if the results are not satisfying we can use the third choice.
-
(c) We use a combination of the two methods, GCBIR and RCBIR, such that the similarity distance between a query image and a database image is defined as:
Dgr (Q,B) = Dg(Q, В) + Dr(Q,B) (20)
where DG(Q, B) and DR(Q, B) are as defined in Equations (11) and (19), respectively.
-
V. RESULTS AND SYSTEM EVALUATION
-
A. Image database and implementation environment
The database we used in our evaluation is WANG database [22]. It consists of 1000 images, a subset of the Corel database, which have been manually selected to be a database of 10 classes of 100 images each. The images are of size 384×256 or 256×384 pixels. This database was extensively used to test many CBIR systems [6, 11, 23, 24] because the size of the database and the
availability of class information allows for performance evaluation.
Our image retrieval systems are implemented using MATLAB image processing and statistical tools. We used a platform of Intel Core 2 Due Processing power of 2.4 GHz CPU with 4GB RAM. The 1000 image database went through image segmentation to obtain more than 5800 objects. We used precision-recall pair to evaluate the proposed systems.
-
B. Evaluation
To test the effectiveness of our RCBIR system, we randomly selected 20 images as queries from each of the 10 semantic classes in the database. For each query, the precision of the retrieval at each level of the recall is obtained by gradually increasing the number of retrieved images. The 200 retrieval results are averaged to give the final precision/recall chart of Figure 1. From the figure, it can be noticed that the system has good average precision values over different recall levels. It has a maximum average precision of 0.9 at recall level of .01; this value decreases to 0.52 precision value at 0.43 of recall level. For example, for an average recall value of 10%, we have an average precision value of 70% (i.e., if the user intends to get 10% of the relevant images in the database, he can get them with 70% of the retrieved images relevant and 30% of them irrelevant). As expected from a good retrieval system, the precision values are shown to decrease little as the recall levels increase.
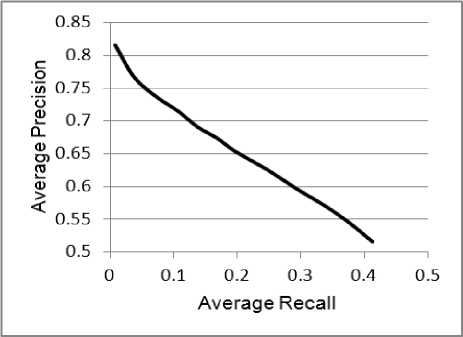
Figure 1. The average precision/recall of RCBIR system over 200 randomly selected queries
We improved the efficiency of our proposed RCBIR by clustering of the database image regions using the SOM algorithm as mentioned earlier. We randomly selected 20 images from 10 different semantic classes in the database as queries. We applied these queries twice, the first using clustering, and the second without clustering. The average precisions for each group based on the returned top 20 images are shown in Figure 2. Notice that clustering of the database image regions does not degrade the average precision values of the system for the different semantic classes; even these precision values can be seen to increase slightly in some semantic classes such as classes of Africa, Buildings, Buses, and Dinosaurs.
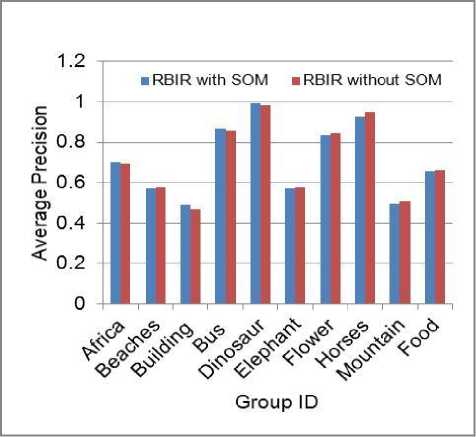
Figure 2. Comparison of precision of RCBIR system with clustering and without clustering
The average time the RCBIR system takes for feature extraction is about 2 seconds per image. A comparison of the average time required for returning top 20 images, per query, recorded for each semantic group in the database over 20 randomly selected queries with clustering and without clustering preprocessing is shown in Figure 3. Clustering decreases the average query response time and thus increases the efficiency of the system.
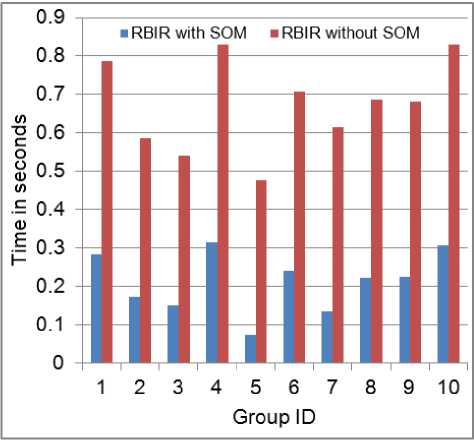
Figure 3. Comparison of average retrieval time required by RCBIR system with clustering and without clustering
We compared our RCBIR system with some of the existing region based algorithms. In order to evaluate the performance, we used the same approach as that of Lakshmi et al [24], since we refer to their comparison results. For each category in the 1000 database images, we randomly selected 20 images as queries. For each query, we examined the precision of the retrieval based on the relevance of the semantic meaning between the query and the retrieved images. Each of the 10 categories in the database portrays a distinct semantic topic, therefore this assumption is reasonable to calculate the precision. The average precisions for each group based on the returned top 20 images were recorded. The result of this study is compared against the performance of IRM [12], Fuzzy Club [13], Geometric Histogram [25], and Signature Based [24]; the comparison is recorded in Table 1. Results show that our proposed system performs significantly better than the Fuzzy Club, Geometric Histogram, and IRM in all semantic classes. Our system outperforms the Signature Based algorithm in all image groups, except Horses and Flowers groups.
We also used the precision/recall curve to evaluate the GCBIR system using the same steps we used in testing the RCBIR. The average precision/recall curve for the GCBIR system is shown in Figure 4. From this figure, it can be noticed that the system has good average precision values over different recall levels.
To compare the effectiveness of the three systems; GCBIR, RCBIR, and GRCBIR, we recorded their average precision/recall curves over 200 random selected images from different semantic classes in the database as queries. The three precision/recall curves are shown in Figure 5. It can be noticed that the average precision/recall values in the GRCBIR system are higher than those of the other two systems. The two approaches RCBIR and GCBIR have approximately the same precision/recall values when the number of the retrieved images is small, but as the number of the retrieved images increases, we find out that the RCBIR system slightly overcomes the performance of the GCBIR system.
Table 1. Comparison of precision (%) of RCBIR with previously existing systems, 1: Fuzzy Club, 2: IRM, 3: Geometric Histogram, 4: Signature Based, 5: Proposed RCBIR
|
Semantic Group |
1 |
2 |
3 |
4 |
5 |
|
Africa |
65 |
47 |
12.50 |
42 |
70.25 |
|
Beaches |
45 |
32 |
13 |
46 |
57 |
|
Building |
55 |
31 |
19 |
25 |
49.25 |
|
Bus |
70 |
61 |
11 |
83 |
86.75 |
|
Dinosaur |
95 |
94 |
16 |
92 |
99.25 |
|
Elephant |
30 |
26 |
19 |
95 |
57.25 |
|
Flower |
30 |
62 |
15 |
96 |
83.50 |
|
Horses |
85 |
61 |
11 |
89 |
92.75 |
|
Mountain |
35 |
23 |
22 |
32 |
49.75 |
|
Food |
49 |
49 |
15 |
28 |
65.50 |
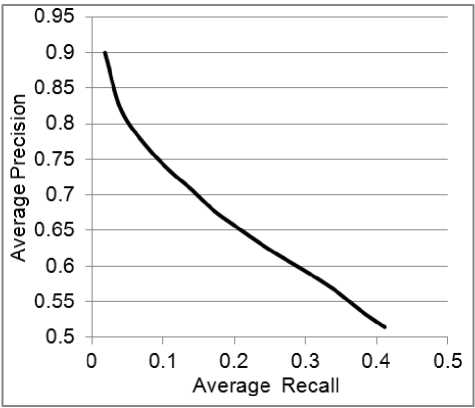
Figure 4. Average precision/recall of GCBIR system over 200 randomly selected queries
Even though the two systems RCBIR and GCBIR have approximately equal performance results on average over all semantic classes in the test database, from our experiments, we found that each of them provides better results than the other for certain images, and worse for other images according to the semantics of these images. To demonstrate this, we randomly selected 20 images as queries from each semantic class in the database, and we recorded the precision of the three systems for top 20 retrieved images responding to a selected query. The average precisions of the three systems over the 20 queries in each class are shown in Figure 6. As can be noticed, the GCBIR outperforms the RCBIR system in classes: Africa, Buses, Elephants, and Foods, whereas the RCBIR has higher precisions in classes: Beaches, Dinosaurs, Horses, and Mountains. The GRCBIR system has retrieval precision higher than the other two systems over all semantic classes.
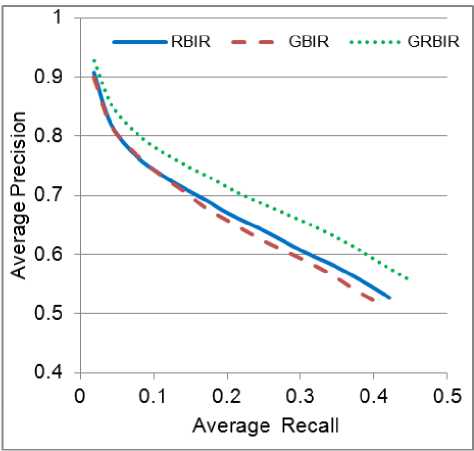
Figure 5. Average precision/recall of RCBIR, GCBIR, and GRCBIR systems over 200 randomly selected queries
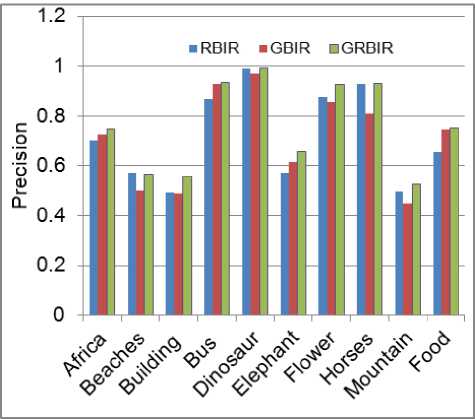
Figure 6: Precision of GRCBIR compared to that of RCBIR and GCBIR for different semantic classes
-
VI. CONCLUSION
In this paper, we presented a content based image retrieval system that introduces three alternatives to answer an image query, which are to use either global features, region features, or a combination of them. We used Gabor filter, which is a powerful texture extraction technique, to describe the content of image regions or the global content of an image. Color histogram as a global color feature and histogram intersection as color similarity metric combined with Gabor texture have been proved to give approximately as good retrieval results as that of region based retrieval systems. We have increased the effectiveness of the RCBIR system by estimating texture features from an image region after segmentation instead of using the average value of group of pixels or blocks through the segmentation process.
Furthermore, we have improved the efficiency of the RCBIR system by not considering the whole database images for similarity computation but a number of candidate images are only considered. A candidate image is any database image that has at least one of its regions in the same cluster with any of the query image regions. The clustering process of the database image regions is performed offline using SOM algorithm. The simulation results have proved the benefit of this clustering process in decreasing the retrieval time without sacrificing the retrieval accuracy.
The performance of our algorithm has been shown to perform better compared to a number of recent systems such as Geometric Histogram, Fuzzy Club, IRM, and signature based CBIR. Both of our proposed systems, RCBIR and GCBIR, have good retrieval results and high precession/recall values. According to our simulation results, the GCBIR system can be used as the first option in our retrieval system, since it gives accepted results and avoids the complex computations of the segmentation process and region comparison that are present in the RCBIR system, which can be used next to further improve the retrieval results in case the user is not satisfied.
Acknowledgment
We thank anonymous referees for their constructive comments.
References Efficient Global and Region Content Based Image Retrieval
- F. Long, H. Zhang, H. Dagan, and D. Feng, "Fundamentals of content based image retrieval," in Multimedia Information Retrieval and Management: Technological Fundamentals and Applications, D. Feng, W. Siu, and H. Zhang, Eds., Berlin Heidelberg New York: Springer-Verlag, 2003, ch. 1, pp. 1-26.
- V. Gudivada and V. Raghavan, "Content-based image retrieval systems," IEEE Computer, vol. 28, no. 9, pp. 18-22, Sep. 1995.
- M. Flickner, H. Sawhney, W. Niblack, J. Ashley, Q. Huang, B. Dom, M. Gorkani, J. Hafner, D. Lee, D. Petkovic, and P. Yanker, "Query by image and video content: The QBIC system," IEEE Computer, vol. 28, no. 9, pp. 23-32, Sep. 1995.
- J. Wang, G. Wiederhold, O. Firschein, and X. Sha, "Content-based image indexing and searching using Daubechies" wavelets," Int. J. Digital Libraries, vol. 1, no. 4, pp. 311-328, 1998.
- D. Zhang, "Improving image retrieval performance by using both color and texture features," in Proc. IEEE 3rd Int. Conf. Image and Graphics (ICIG04), Hong Kong, China, 2004, pp.172-175.
- J. Wang, J. Li, and G. Wiederhold, "Simplicity: Semantics-sensitive integrated matching for picture libraries," IEEE Trans. Pattern Anal. Mach. Intell., vol. 23, no. 9, pp. 947–963, Sep. 2001.
- W. Ma and B. Manjunath, "Natra: A toolbox for navigating large image databases," Proc. IEEE Int. Conf. Image Processing, Santa Barbara, 1997, pp. 568-571.
- C. Carson, M. Thomas, S. Belongie, J. M. Hellerstein, and J. Malik, "Blobworld: A system for region-based image indexing and retrieval," in 3rd Int. Conf. Visual Inform. Syst., Amsterdam, The Netherlands, 1999, pp. 509-516.
- A. Natsev, R. Rastogi, and K. Shim, "WALRUS: A similarity retrieval algorithm for image databases," IEEE Trans. Knowl. and Data Eng., vol. 16, no. 3, pp. 301-316, Mar. 2004.
- M. Sudhamani and C. Venugopal, "Image retrieval from databases: An approach using region color and indexing technique," Int. J. Computer Science and Network Security, vol. 8, no. 1, pp. 54-64, Jan. 2008.
- S. Nandagopalan, B. Adiga, and N. Deepak, "A universal model for content-based image retrieval," Proc. world academy science, engineering, and technology, vol. 36, pp. 659-662, Dec. 2008.
- J. Li, J. Wang, and G. Wiederhold, "Integrated region matching for image retrieval," in Proc. 2000 ACM Multimedia Conf., Los Angeles, 2000, pp. 147-156.
- R. Zhang and Z. Zhang, "A clustering based approach to efficient image retrieval," in Proc. 14th IEEE Int. Conf. Tools with Artificial Intell. (ICTAI'02), Washington, DC, 2002, pp. 339-346.
- B. Manjunath and W. Ma, "Texture features for browsing and retrieval of image data," IEEE Trans. Pattern Anal.Mach. Intell., vol. 18, no. 8, pp. 837-842, Aug. 1996.
- J. Smith, "Integrated spatial and feature image system: Retrieval, analysis and compression," Ph.D. dissertation, Dept. Elect. Eng., Columbia University, New York, 1997.
- J. Han and M. Kamber, Data Mining Concepts and Techniques, 2nd ed., Morgan Kaufmann Publisher, 2006, ch. 2, pp. 71-73.
- T. Ojala, M. Rautiainen, E. Matinmikko, and M. Aittola, "Semantic image retrieval with HSV correlograms," in 12th Scandinavian Conf. Image Anal., Bergen, Norway, 2001, pp. 621-627.
- M. Swain and D. Ballard, "Color indexing," Int. J. Computer Vision, vol. 7, no. 1, pp. 11-32, Nov. 1991.
- J. R. Smith and S. F. Chang, "Tools and techniques for color image retrieval," in IST/SPIE—Storage and Retrieval for Image and Video Databases IV, San Jose, CA, 1996, vol. 2670, pp. 426-437
- A. Yang, J. Wright, Y. Ma, and S. Sastry, "Unsupervised segmentation of natural images via lossy data compression," Computer Vision and Image Understanding (CVIU), vol. 110, no. 2, pp. 212-225, May 2008.
- T. Kohonen, S. Kaski, K. Lagus, J. Salojvi, J. Honkela, V. Paatero, and A. Saarela, "Self organization of a massive document collection," IEEE Trans. Neural Networks, vol. 11, no. 3, pp.1025–1048, May 2000.
- J. Z. Wang. (2010, Aug. 12). Wang Database [Online]. Available: http://wang.ist.psu.edu
- F. Jing, M. Li, H.-J. Zhang, and B. Zhang, "An efficient and effective region-based image retrieval framework," IEEE Trans. Image Process., vol. 13, no. 5, pp. 699-709, May 2004.
- D. Lakshmi, A. Damodaram, M. Sreenivasa, and J. Lal, "Content based image retrieval using signature based similarity search," Indian J. Science and Technology, vol. 1, no. 5, pp. 80-92, Oct. 2008.
- A. Rao, R. Srihari, and Z. Zhang, "Geometric histogram: A distribution of geometric configuration of color subsets," in Proc. SPIE Conf. Electronic Imaging 2000, vol. 3964-09, San Jose, CA, 2000, pp. 91-101..
