Efficient image retrieval through hybrid feature set and neural network

Author: Nitin Arora, Alaknanda Ashok, Shamik Tiwari
Journal: International Journal of Image, Graphics and Signal Processing @ijigsp
Article in issue: 1 vol.11, 2019.
Free access
Images are an important part of daily life. Any person cannot easily control the huge repository of digitally existing images. Extensive scanning of the image database is very much essential to search a particular image from the huge repository. In some cases, this procedure becomes very exhaustive also. As a result, if a count of ten thousand, lakhs or considerably more images are included in the image database, then it may be transformed into a tedious and never-ending process. Content-based image retrieval (CBIR) is a technique, which is used for retrieving an image. This type of image retrieval procedure is centered on the real content of the image. This paper proposed a model of the hybrid feature set of Haar wavelets and Gabor features and analyzed with different existing models image retrieval. Content-based image retrieval using hybrid feature set of Haar wavelets and Gabor features superiors on other models.
Content-based Image Retrieval, Information Retrieval, Color features, Texture features, Shape features
Short address: https://sciup.org/15016026
IDR: 15016026 | DOI: 10.5815/ijigsp.2019.01.05
Text of the scientific article Efficient image retrieval through hybrid feature set and neural network
With the advancement of the Internet and the accessibility of various imaging gadgets, the measure of created computerized pictures is expanding quickly [1]. At the point when the measure of pictures turns out to be so huge, it will be futile unless there is a successful device to recover wanted images. For this reason, many image recovery approaches have created. They are content-based and substance based [2]. In Text-based Image Retrieval (TBIR) approach, pictures are recorded by printed portrayal, known as the metadata of the picture, for example, the date at which picture was delivered and a physically commented on the depiction of the substance of the picture itself [3]. TBIR approach has numerous troubles, for example, it cannot recover pictures that are setting touchy and the measure of exertion required to physically clarify each picture, and additionally the distinction in human observation while depicting the pictures, which result in mistakes amid the recovery procedure. To conquer the deficiency related with TBIR framework, Content-based Image Retrieval (CBIR) approach was presented in the mid-1980s [1]
-
A. Content based Image Retrieval (CBIR)
In CBIR framework, visual highlights of the image, such as, shading, surface, shape or whatever other data that can be so extricated from the image and used to recover pertinent images from the database of images. The recovered images are then positioned by similitudes between the inquiry image and images in the database utilizing a computability coordinating measure [3]. A CBIR framework comprises two most imperative ways: highlight extraction and likeness coordinating [4]. The model of CBIR system architecture has presented in Figure 1.
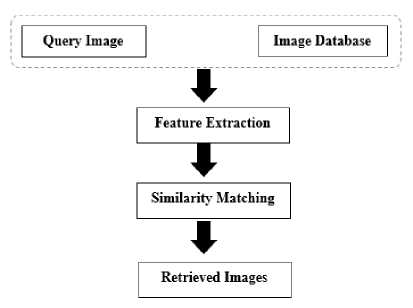
Fig.1. Basic Model of CBIR system [4]
-
II. Related Work
CBIR frameworks depict the way toward finding the images from extensive databases that match to a given query image utilizing image content highlights. One of the issues that emerge while actualizing a CBIR framework is the manner by which to make it a broadly useful framework. This is on the grounds that the trouble of deciphering image by clients and PCs, the trouble of framework assessment, and recovery comes about with various image databases [7]. Numerous CBIR frameworks have been effectively created utilizing diverse image highlights.
Jhanwar et al. [8] proposed an image recovery framework that depends on theme co-event grid (MCM). This framework changes the distinction between pixels into an essential realistic and appraisals the likelihood of its event in the contiguous zone as the image highlight.
Additionally, Huang and Dai [9] proposed a surface based image recovery framework, which coordinates the wavelet deterioration and the inclination vector. The framework includes a coarse component descriptor and an element descriptor with each image. The two descriptors are gotten from the wavelet coefficients of the first image. The coarse component descriptor is used at the primary stage to quickly screen out non-promising images; the fine element descriptor is hence used to discover suitably coordinated images.
Lin et al. [10] displayed a Color-Texture and ColorHistogram based Image Retrieval framework (CTCHIR). They proposed three image content highlights that in view of shading, surface and shading dispersion, as shading co-event lattice (CCM), the contrast between pixels of output design (DBPSP) and shading histogram for K-mean (CHKM) individually. They likewise proposed a strategy for the image recovery process by incorporating CCM, DBPSP, and CHKM to enhance image recognition rate and rearrange the calculation of image recovery. Utilizing exploratory outcomes, they found that their proposed strategy beats the Jhanwar et al. [8], Hung, and Dai [9] techniques.
Rao et al. [11] introduced a CTDCIRS (shading surface and prevailing shading based image recovery framework). They proposed coordinating three highlights, which are Motif co-event network (MCM), the distinction between pixels of output design (DBPSP), and dynamic prevailing shading (DDC) to remove shading highlight. They tried their outcomes with strategies for Jhanwar et al. [8], Hung, and Dai [9] and found that their strategy gives unrivalled recovery comes about.
Hiremath and Pujari [12] proposed a CBIR framework that depends on the shading, surface and shape includes by isolating the image into tiles. The highlights processed on tiles fill in as nearby descriptors of shading and surface highlights. The shading and surface examination are breaking down by utilizing two level lattice structures and the shape include is utilized by utilizing Gradient Vector Flow. The proposed technique is contrasted and different frameworks [13] and found that their proposed recovery framework gives better execution.
Zhang [14] figured shading and surface highlights from the image database. In this way, for each image, shading and surfaces highlights are registered. For any inquiry image, the shading and surface highlights are processed. At to start with, the images in the database are positioned by the shading highlights then the best-positioned images from shading highlights are repositioned by the surface highlights. Additionally, Sharma et al. [15] proposed a proficient CBIR framework that utilized shading histogram handling. The proposed approach utilized shading minutes and shading histograms. They processed shading minutes from the images. The shading highlights are then utilized for coordinating between the question image and images in the database.
As an outline, working with shading images and separating its visual highlights have a few issues. To begin with, shading images have huge measurements, likewise calculations process is very tedious. Second, shading images are delicate to clamor obstruction [7]. For a proficient CBIR framework, a solitary ascribe is not productive to speak to image highlights. Our commitment is to give an effective CBIR framework by consolidating shading and surface highlights as a solitary element vector. Two new proposed strategies are recommended. This bring about lessening recovery time and expanding recovery exactness. The proposed techniques are contrasted and aftereffects of the strategies exhibited by Jhanwar et al. [8], Huang and Dai [9], Rao et al. [11] and Lin et al. [10]. We found that the proposed techniques give better execution.
-
III. Feature Extraction
Feature extraction is considered the most difficult task in the retrieval process [5]. It involves extracting significant features of the image to a different level. The similarity matching is concerned with matching extracted features to get a result that is visually similar [6]. So for a given query image, its feature vector is extracted. If the similarity distance between the feature vector of collection of images and the feature vector of the query image is minor, then the equivalent image in the collection of images is considered as a match for the query. The retrieval is commonly based on similarity instead of the exact match and the retrieved images are ranked depending on to a similarity index [6].
-
A. Color
The supreme important feature of CBIR system is color [16]. The main benefits of color are speediness and small memory space. Color Histogram and color moments are examples where color properties are used for retrieving the images. Color is usually used for image demonstration and free of the dimension of an image. Color space, Color moments, Color histograms, Color coherence vector, invariant color features [17] and color correlogram [18] are most widely used methods for extracting color. A color histogram is non-invariant to scaling but it is invariant to rotation. The main advantage of color moments is their storage requirement is very less and are mainly used for indexing color.
-
1) Color Histogram
The histogram of an image refers to the probability density function of the image intensities with gray levels in the interval (0, L — 1) and defined as
n
P ( r i ) = — (1) n
Where, i = 0,1,2,3... L — 1, L = number of levels, rt = the i th gray level, n t = number of pixels in the image having gray level, n = total number of pixels in the image.
The histogram of color image refers to the joint probabilities of the intensities of the three-color channels. It can be define as:
histogram(RS T} ( r , s , t ) = N . P ( R = r , S = s , T = t )
Where, R, S and T represent the three color channels such as RGB or HSV and N is the number of pixels in the image. The histogram expresses the frequency distribution of color containers in an image, and each container in the color histogram contains information about the number of pixels that belong to the color container.
-
2) RGB Color
The RGB colour architecture is made out of the essential hues Red, Green, and Blue. This framework characterizes the shading model that is utilized as a part of most shading CRT screens and shading raster designs. They are viewed as the "added substance primaries" since the hues are included to create the coveted shading. The RGB demonstrate utilizes the Cartesian arrange framework. Notice the askew from (0, 0, 0) dark to (1, 1, 1) white which speaks to the dim scale.
-
3) HSV Color
HSV (hue, saturation, value) is one of a few shading frameworks utilized by individuals to choose hues from a color wheel or palette. This color framework is impressively nearer than the RGB framework to the manner by which people involvement and depict shading sensations. The HSV color space is planned by taking a gander at the RGB shading 3D Square along its dim hub, which brings about the hexagonally formed shading palette.
-
4) Color Moment
Color moments need aid measures that describe color appropriation in an image in the same path that vital moments particularly portray a likelihood dissemination. Color moments would utilize for color indexing purposes likewise offers on image recovery provisions so as with think about how comparative two images need aid dependent upon color. Typically, you quit offering on that one image is contrasted with a database for advanced images for pre-computed features also recover a comparable picture. Each examination between images brings about a comparability score, and then bring down this score is those a greater amount indistinguishable twin those two images would assume with be. Color moments are scaling and revolution invariant. Since color moments encode both shapes furthermore color data they are a great characteristic to utilize under evolving lighting conditions, however, they cannot handle impediment effectively. Mainly three-color moments are used:
-
• Mean
-
• Standard Deviation
-
• Skewness
The principal color moment translated as the normal shading in the image, and it can be figured by utilizing the following equation
Ei=Z pj
Where N is the number of pixels in the image and P tj is the value of the j th pixel of the image at the i th color channel.
The second color moment is the standard deviation (er ; ), which is achieved by taking the square root of the variance of the color dissemination.
° , =
N
Z ( p i ,j- E i ) 2 j = 1
N
Where, E ; is the mean value, or first color moment, for the i th color channel of the image.
The third color moment is the skewness. It gives how unbalanced the color dissemination is, and thus it provides information about the shape of the color distribution. Skewness computed as:
S i = \
N
Z ( p v- E)
j = 1
N
-
B. Texture
Another main property of an image is texture. It describes the visual pattern. The two main categories of texture representation are structural methods and statistical methods. Structural methods are very effective in case of regular textures. Tamura features [19], World features, Simultaneously Auto-Regressive (SAR) Model, Gabor Filter features [20], Wavelet Transform features [21] are frequently used and effective in CBIR systems.
-
1) Gabor Filter
Gabor capacities give acceptable those ideal determinations to both those occasion when (spatial) and recurrence domains. Gabor wavelet convert will be those ideal premises should extricate local features because of following:
Biological motivation: the demonstrating of the higher dream visual cortex for mammalian brains is best suiting toward a family of self-similar 2D Gabor wavelets.
Scientific motivation: the multi-resolution and multiorientation valuables of the Gabor wavelet change might make utilized for computing local spatial occurrences.
Gabor wavelet convert can also be utilized within many people image dissection provisions including face recognition, composition arrangement Furthermore facial outflow order. For a provided image Image(a, b) for measure M X N its discrete Gabor wavelet convert may be provided for by
Gnm ( a , b ) = ∑ s ∑ t Im( a - p , b - q ) Ψ * nm ( p , q )
Where p and q are the mask size variables, ipnm the complex conjugate of t^ nm which is a self-similar functiongenerated from dilation and rotation of the mother wavelet. The self-similar Gabor wavelets are computed using the generating function:
Ψ nm ( a , b ) = a - n Ψ ( a , b ) (7)
-
2) Wavelet Filter
Similar to Gabor filtering, wavelet transformation provides a multiple resolution approach to plot analysis and classification. The wavelet transforms decompose a signal with a family of basic functions фпт(а) obtained through the translation and dilation of a mother wavelet^(a), that is,
- n
Ψ nm ( a , b ) = 2 2 Ψ (2 - na - m ) (8)
Where, n and m are dilation and translation parameters
-
IV. Neural Network Setup
Randomly divide the 500 samples for training, validating and testing.
Table 1. Neural Network Setup For Training, Validating And Testing
|
Purpose |
% |
No. of samples |
|
Training |
70% |
350 |
|
Validation |
15% |
75 |
|
Testing |
15% |
75 |
-
• Training
These are presented to the network during training, and the network is adjusted according to its error. 70% of the total samples have been used for training purpose.
-
• Validation
These are used to measure network generalization, and to halt training when generalization stops improving. 15% of the total samples have been used for validating purpose.
-
• Testing
These have no effect on training and so provide an independent measure of network performance during and after training. 15% of the total samples have been used for testing purpose.
-
• Hidden Layers
Hidden layer defines a pattern recognition neural network and change the number of neurons if the network does not perform well after training. For this system, the number of hidden layers are 10. [23-24]
-
V. Database
For the execution and for proficiency estimation of CBIR framework, a database of the subset of WANG database of 500 pictures has been manually chosen to be a database of five classes of five hundred images. The images are subdivided into five classes namely class1, class2, class3, class 4 and class 5, with the end goal that it is certain that a client needs to locate alternate images from a class if the query is from one of these five classes [22]
Class1 consisting of African images, class2 consisting of Beach images, class3 consisting of image of Monuments, class4 consisting of buses images and class5 consisting of Dinosaurs images.

Africa
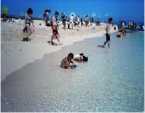
Beach

Monuments

Buses

Dinosaurs
Fig.2. One example image from each of the five classes of the used database.
This database was utilized broadly to test the different features in light of the fact that the measure of the database and the accessibility of class data takes into account execution assessment. Every one of the images is of size 256 x 256 pixels too.
-
VI. Results and Comparisons
Three different CBIR models are used for the experiments, CBIR model using Gabor features, CBIR model using Gabor and Haar hybrid features, and CBIR Model using HSV Color Moment, Gabor and Haar Hybrid Features.
-
A. CBIR Model using Gabor Features
0.3%
0 0.0%
This experiment has utilized Gabor wavelet features for classification. Square energy and mean amplitude have been calculated from Gabor features. These two features are used as input to the neural network. The feed forward neural network [25] of three layers is used in this classification model. The first layer has two neurons corresponding to two input features. The out layer has five neurons corresponding to five classes in image database. Ten neurons are used in the single hidden layer since this number of neurons are giving optimum results. The network is trained for fifty epochs. The image database is divided into training and validation dataset. 70% of images are used for training and 30% images are utilized for validation. The whole dataset is used for testing. Training, Validation, Testing and combined confusion matrices are given in Figure 3. The ROC curves are plotted in Figure 4. The overall accuracy achieved through the model is 63.0%.
Training Confusion Matrix
0 0.0%
0 0.0%
0 0.0%
100% 0.0%
2.9%
14 0%
32 9.1%
5.4%
5 1.4%
0.3%
0 0.0%
4.6%
1.1%
0 0.0%
42.6%
57.4%
76.2%
23.8%
£-4
О
0 0.0%
0 0.0%
0 0.0%
0 0.0%
0 0.0%
4a N%
4a No
59 16.9%
5.1%
5.7%
14.3%
14%
98.6%|26 9%j76.5%) 100%
18.9% 59.0%
93 0% 37.7%
7.0%
62.3%
Validation Confusion Matrix
О
|
0 0.0% |
0 0.0% |
0 0.0% |
0 0.0% |
0 0.0% |
teN% |
|
4 |
11 |
7 |
2 |
0 |
45 8% |
|
5.3% |
14.7% |
9.3% |
2.7% |
0.0% |
>4.2% |
|
0 |
0 |
2 |
0 |
0 |
100% |
|
0.0% |
0.0% |
2.7% |
0.0% |
0.0% |
0.0% |
|
0 |
0 |
0 |
0 |
0 |
4a N% |
|
0.0% |
0.0% |
0.0% |
0.0% |
0.0% |
4aN% |
|
10 |
6 |
8 |
11 |
14 |
28 6% |
|
13.3% |
8 0% |
10.7% |
14 7% |
18.7% |
71.4% |
|
0.0% |
64.7% |
118% |
0.0% |
100% |
36.0% |
|
100% |
35.3% |
88.2% |
100% |
0.0% |
54.0% |
Target Class
2 3 4 5
Target Class
Test Confusion Matrix
All Confusion Matrix
£-4
0 0.0%
3 4.0%
0 0.0%
0 0%
0 0.0%
0 0.0%
0 0.0%
13.3% 10.7%
3 4.0%
1.3%
0 0.0%
16.0%
5 6.7%
0.0%
0 0.0%
4a N%
0.2%
0 0.0%
0 0.0%
0 0.0%
0 0.0%
100%
0.0%
2 2.7%
0 0%
5 6.7%
1.3%
1.3% 0 0.0%
40.0%
60.0%
50.0%
50.0%
3.4%
14.0% '
c
0.2%
0.2%
9.4%
4.0%
4.8%
1.0%
6 1.2%
0 0.0%
0 0.0%
0 0.0%
4a N%
13.3%
30.4%
18.7% 89.6%
о
0 0.0%
0 0.0%
0 0%
0 0.0%
0 0.0%
$7.3%
25 9%
48 N* r
4aN'
16.2% 5.8%
6.6%
30 5%
14.2% 18.8% 69 5%>
100% 37 5% 86 7% 100%
93.3%
6.7%
34.7%
65.3%
1.0%
70.0% 20.0% 0.0% 94.0% 37.0%
99.0% 30.0% 80 0% 100%
6.0%
2 3 4 5
Target Class
Target Class
Fig.3. Confusion matrix using only Gabor features
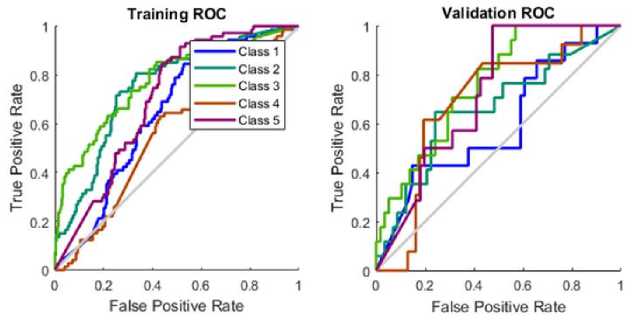
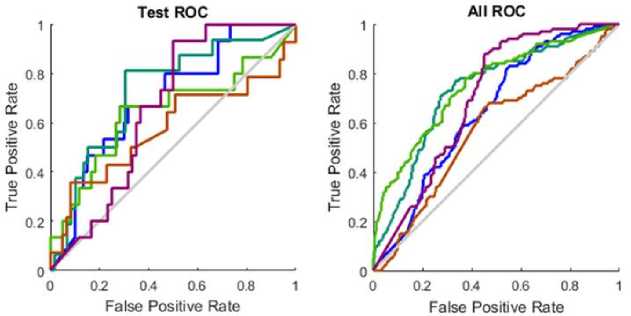
Fig.4. False positive rate vs true positive rate using only Gabor features for five categories of images
-
B. CBIR Model using Gabor and Haar Hybrid Features
10
2.9%
23
6.6%
16
4.6%
6
1.7%
7
2.0%
16.1%
83.9%
0 0.0%
1
0.3%
1
0.3%
0 0.0%
0 0.0%
50 0%
50.0%
2 0.6%
15
4.3%
24
6.9%
4
1.1%
0
0.0%
53.3%
46.7%
56
16.0%
31
8.9%
36
10.3%
63
18 0%
55
15.7%
26
73.9%
0
0.0%
0
0.0%
0 0.0%
0 0.0%
0
0.0%
MaN
MaN%
14.7%
85.3%
1 4%
98.6%
31.2%
68.8%
86.3%
13.7%
0.0%
100%
28.0%
72.0%
6
8.0%
1
1.3%
4
5.3%
0
0.0%
1
1.3%
50.0%
50.0%
0 0.0%
0 0.0%
0
0.0%
0
0,0%
0 0.0%
4aN% 4a N %
1
1 3%
0
0.0%
5
6.7%
1
1.3%
0
0.0%
28.6%
14
18.7%
9 12.0%
4
5.3%
13
17.3%
16
21.3%
76.8%
0 0.0%
0 0.0%
0
0.0%
0
0.0%
0 0.0%
4a N%
4a N%
28.6%
71.4%
0.0%
100%
38.5%
61.5%
92.9%
7.1%
0.0%
100%
32.0%
68.0%
This experiment has utilized Gabor wavelet and Harr wavelet features for classification. Square energy and mean amplitude have been calculated from Gabor features. Mean and standard deviation feature are calculated from two dimensional wavelet decomposition of input image with 2 level. These four features are used as input to the neural network. The feed forward neural network of three layers is used in this classification model. The first layer has four neurons corresponding to two input features. The out layer has five neurons corresponding to five classes in image database. Ten neurons are used in the single hidden layer since this number of neurons are giving optimum results. The network is trained for fifty epochs. The image database is divided into training and validation dataset. 70% of images are used for training and 30% images are utilized for validation. The whole dataset is used for testing. Training, Validation, Testing and combined confusion matrices are given in Figure 5. The ROC curves are plotted in Figure 6. Results shows that by using hybrid feature set of Haar wavelets and Gabor features, efficiency of the system is 73.4%.
Training Confusion Matrix
Validation Confusion Matrix
1 2 3 4 5
Target Class
1 2 3 4 5
Target Class
Test Confusion Matrix
|
0 0.0% |
6 8.0% |
1 1.3% |
3 4.0% |
4 5.3% |
0 0% 100% |
|
1 1.3% |
0 0.0% |
1 1.3% |
0 0.0% |
0 0.0% |
0.0% 100% |
|
0 0.0% |
1 1.3% |
2 2.7% |
1 1.3% |
0 0.0% |
50.0% 50.0% |
|
10 13.3% |
13 17.3% |
6 8.0% |
9 12.0% |
17 22.7% |
16.4°/ 83.6% |
|
0 0.0% |
0 0.0% |
0 0.0% |
0 0.0% |
0 0.0% |
MaN% MaN% |
|
0.0% 100% |
0.0% 100% |
20.0% 80.0% |
69.2% 30.8% |
0.0% 100% |
14.7% 85.3% |
All Confusion Matrix
|
16 3.2% |
30 6.0% |
21 4.2% |
9 1.8% |
12 2.4% |
81.8% |
|
1 0.2% |
1 0.2% |
2 0.4% |
0 0.0% |
0 0.0% |
75.0% |
|
3 0.6% |
16 3.2% |
31 6.2% |
6 1.2% |
0 0.0% |
44.6% |
|
80 16.0% |
53 10.6% |
46 9.2% |
85 17.0% |
88 17.6% |
24.1% 75.9% |
|
0 0.0% |
0 0.0% |
0 0.0% |
0 0.0% |
0 0.0% |
4a N % 4a N% |
|
16 84.0% |
1.0% 99.0% |
31.0% 69.0% |
85.0% 15.0% |
0.0% 100% |
26.6% 73.4% |
1 2 3 4 5
Target Class
1 2 3 4 5
Target Class
Fig.5. Confusion matrix using hybrid feature set of Haar wavelets and Gabor features
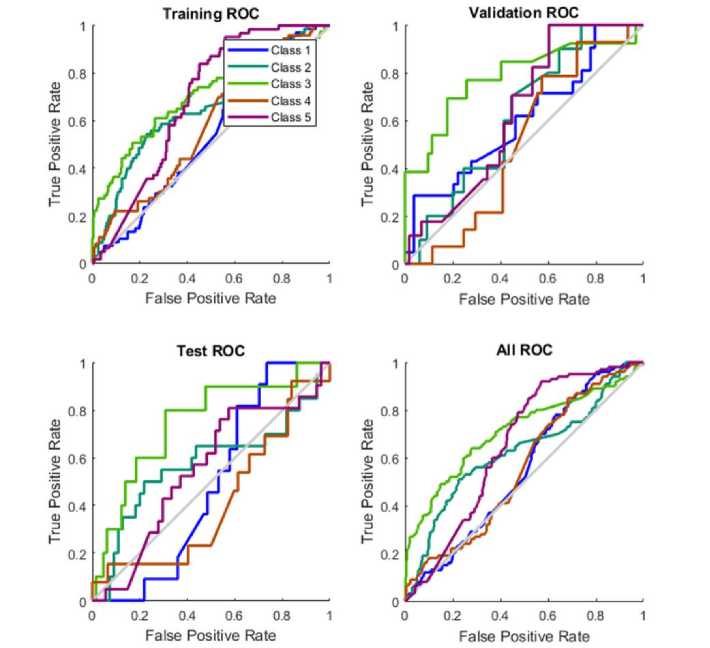
Fig.6. False positive rate vs true positive rate using hybrid feature set of Haar wavelets and Gabor features for five categories of images
-
C. CBIR Model using HSV Color Moment, Gabor and Haar Hybrid Features
This experiment has utilized HSV Color Moment, Gabor wavelet and Harr wavelet features for classification. Mean Hue, Mean Saturation, Mean Intensity, Standard deviation Hue, Standard deviation Saturation and Standard deviation Intensity are calculated from HSV Color Moments. Square energy and mean amplitude have been calculated from Gabor features. Mean and standard deviation feature are calculated from two dimensional wavelet decomposition of input image with 2 level. These ten features are used as input to the neural network. The feed forward neural network of three layers is used in this classification model. The first layer has ten neurons corresponding to three input features. The out layer has five neurons corresponding to five classes in image database. Ten neurons are used in the single hidden layer since this number of neurons are giving optimum results. The network is trained for fifty epochs. The image database is divided into training and validation dataset. 70% of images are used for training and 30% images are utilized for validation. The whole dataset is used for testing. Training, Validation, Testing and combined confusion matrices are given in Figure 7. The ROC curves are plotted in Figure 8. Results shows that by using hybrid feature set of HSV, Gabor features and Haar wavelets, efficiency of the system is 69.4%.
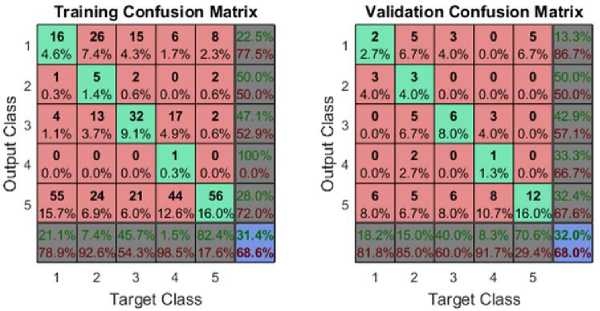
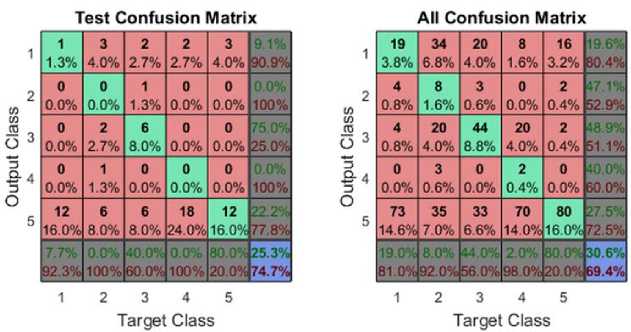
Fig.7. Confusion matrix using hybrid feature set of HSV, Gabor features and Haar wavelets
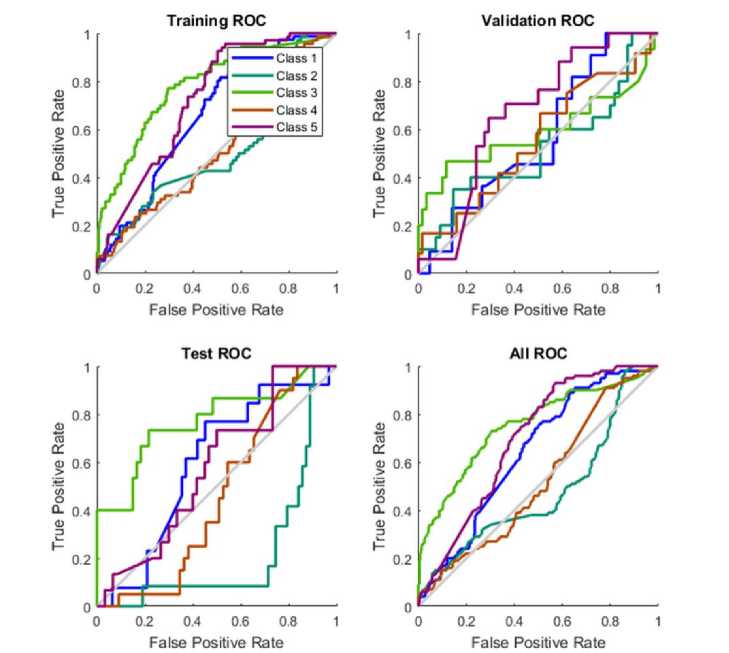
Fig.8. False positive rate vs true positive rate using hybrid feature set of HSV, Gabor features and Haar wavelets for five categories of images
Comparative results of all the models are described in table 2.
Table 2. Result Comparison Using Different Features
|
Sr. No. |
Feature(s) used |
Efficiency (%) |
|
1 |
Only Gabor feature |
63.0 |
|
2 |
Hybrid feature set of HSV, Gabor features and Haar wavelets |
69.4 |
|
3 |
Hybrid feature set of Haar wavelets and Gabor features |
73.4 |
-
VII. Conclusion
Content-based image retrieval system practices actual contents of image such as color, texture and shape to retrieve images from image database. Three classification models are proposed in this paper namely CBIR using Gabor features, CBIR using hybrid feature set of Haar wavelets and Gabor and CBIR using hybrid feature set of combining HSV, Gabor, and Haar wavelet. Classification results shows that second classification model based on hybrid features of Gabor and Haar wavelet superiors on other models.
-
VIII. Future Scope
The proposed strategy worked through image recovery from collection of images. Suitably conserved database stockpiling as opposed to MATLAB record might provide for enhanced precision level and can decrease the time and computational complexity. This system focusses main on retrieving from claiming image files, be that as clinched alongside future this exertion camwood be enhanced on recover the sound also feature document by utilizing these offers or changing them. Neural system method is used to figure those separation vectors furthermore finally yield the topmost pictures. Some other approaches, i.e. Euclidean distance method, Chebyshev distance, maul separation might additionally provide for progressed precision to suggested plan.
References Efficient image retrieval through hybrid feature set and neural network
- Pattanaik S and Bhalke D 2012 Beginners to Content-Based Image Retrieval. International Journal of Science, Engineering and Technology Research. 1: 40–44
- Chen Y, Wang J, and Krovetz R 2005 CLUE: Cluster- based retrieval of images by unsupervised learning. IEEE Transaction Image Process. 141: 187– 1201
- Wang J, Li J, and Wiederholdy G 2000 SIMPLIcity: Semantics-sensitive integrated matching for picture libraries. Lecture Notes Computer. Science. 1929: 360–371
- Hany F , Attiya G, and El-Fishawy N 2013 Comparative Study on CBIR based on Color Feature. International Journal of Computer Applications. 78 : 975–8887
- Hall E 1971 A Survey of Preprocessing and Feature Extraction Techniques for Radiographic Images. IEEE Transaction Computer. C-20: 1032–1044
- Rangari F and Ramarao U 2013 Searching by Content based image retrieval through combined features. 1: 85–93
- Afifi Ahmed J and Ashour Wesam M Image Retrieval Based on Content using Color Feature. ISRN Comput. Graph. 341: 560–564.
- Jhanwar N, Chaudhuri S, Seetharaman G and Zavidovique B 2004 Content based image retrieval using motif co-occurrence matrix. Image and vision Computing Journal. 22: 1211–1220
- Huang P and Dai SK 2003 Image retrieval by texture similarity. Pattern Recognition. 36: 665– 679
- Lin CH, Chen RT and Chan YK 2009 A smart content-based image retrieval system based on color and texture feature. Image and vision Computing Journal. 27 : 658–665
- Rao M, Rao B, and Govardhan A 2011 CTDCIRS: Content based Image Retrieval System based on Dominant Color and Texture Features. International Journal of Computer Applications. 18 : 40–46
- Hiremath P and Pujari J 2007 Content Based Image Retrieval based on Color, Texture and Shape features using Image and its complement. International Journal of Computer Science Security. 1 : 25–35
- Li J, Wang J and Wiederhold G 2000 IRM: integrated region matching for image retrieval. Proceedings ACM International Conference on Multimedia. pp. 147–156
- Zhang D 2004 Improving Image Retrieval Performance by Using Both Color and Texture Features. Third International Conference Image and Graphics. pp. 172–175
- Sharma N, Rawat P, and Singh J 2011 Efficient CBIR Using Color Histogram Processing. Signal Image Processing: An International Journal. 2: 94–112
- Kushwah V and Agrawal A 2014 Study on Query Based Clustering Technique for Content Based Image Retrieval. International Journal of Research in Engineering Advance Technology. 2: 1–6
- Singha M and Hemachandran K 2012 Content Based Image Retrieval using Color and Texture. Signal and Image Processing: An International Journal. 3: 39–57
- An Y, Riaz M, and Park J 2010 CBIR based on adaptive segmentation of HSV color space. 12th International Conference on Computer Modeling Simulation. pp. 248–251
- Chakravarti R and Meng X 2009 A Study of Color Histogram Based Image Retrieval. Sixth International Conference on information Technology-New Generation., pp. 1323–1328
- Wei C, Li Y, Chau W, and Li C 2009 Trademark image retrieval using synthetic features for describing global shape and interior structure. Pattern Recognition. 42: 386–394.
- Smith J and Chang S 1996 VisualSEEk: A Fully Automated Content-based Image Query System. Proceedings fourth ACM International Conference on Multimedia. pp. 87–98
- Li J and Wang J 2003 automatic linguistic indexing of pictures by a statistical modeling approach. IEEE Transaction Pattern Analysis and Machine Intelligence. 25:1075– 108
- Tiwari, S., Prasad Shukla, V., Biradar, S. R., & Singh, A. K. (2014). Blind restoration of motion blurred barcode images using ridgelet transform and radial basis function neural network. ELCVIA: electronic letters on computer vision and image analysis, 13(3), 63-80.
- Tiwari, S., Shukla, V. P., Biradar, S. R., & Singh, A. K. (2014). Blur parameters identification for simultaneous defocus and motion blur. CSI transactions on ICT, 2(1), 11-22.
- Kane, L. and Khanna, P., 2017. Vision-based mid-air unistroke character input using polar signatures. IEEE Transactions on Human-Machine Systems, 47(6), pp.1077-1088.
