Efficient thermal image segmentation for heat visualization in solar panels and batteries using watershed transform

Author: Akash Singh Chaudhary, D.K. Chaturvedi
Journal: International Journal of Image, Graphics and Signal Processing @ijigsp
Article in issue: 11 vol.9, 2017.
Free access
Sun being a non-conventional source of energy produces solar energy which is clean and available in abundance. The power obtained from solar panels is used to charge solar batteries and utilized to get continuous power supply. Solar panels are installed in open atmosphere and when subjected to different weather conditions involve many problems such as damage to different components, loss of power generation and heating. The different deposits on solar panel surface such as cement deposits, bird droppings increase temperature of deposited area and produce heating. The heating in solar panels develop hot spots. Batteries placed in a battery room attain high temperature and produce heat. This overheating affect working and performance of solar panels and batteries. These effects of heat are not visible by naked eye but are visible in thermal images, captured using thermal imaging camera. This paper focus on implementing an efficient visualization technique to segment the desired portion of heat from thermal images of solar panels and batteries using watershed transform.
Watershed transform, Heat visualization, Thermal images, Solar panels, Batteries, Image segmentation
Short address: https://sciup.org/15015912
IDR: 15015912 | DOI: 10.5815/ijigsp.2017.11.02
Text of the scientific article Efficient thermal image segmentation for heat visualization in solar panels and batteries using watershed transform
Published Online November 2017 in MECS
Sun is a non-conventional source of energy having its reserve in abundance. It safe for environment and reduces green house gas emission [1]. The government of India has made several plans to develop solar cities, green campus, model cities and solar technology parks in order to make a developed and clean nation [2]. Today solar panels are being installed in almost every place like industries, hospitals, institutions, roads, rural areas due to their several advantages. Normally solar panels are designed to operate in open condition with a proper maintenance at regular interval of time [3]-[4]. Deposition of dirt (like bird droppings, cement deposits) and other natural conditions (like shading of tree or building, soiling,tree branches) on solar panel surface cause heating and loss of electrical power generation in solar panels. The condition become dangerous when there is a damage to the affected area in solar panels and probability of fault, electrical shock or fire is more [5]-[6]. Batteries in solar photovoltaic system are used to store the generated energy obtained from solar panels. Usage of batteries minimize the overall system cost and provides reliable operation [7]. Generally lead-acid batteries are used in solar photovoltaic generation system. When a battery takes part in electrochemical reaction (charging or discharging of battery), the internal losses result into heating. This heating may reduce the efficiency of battery or shorten the life of battery [8]. Infra-red radiations emitted from any object are in the form of heat, which are not visible by naked eye but through a thermal imaging camera. So this heat captured through thermal imaging camera produce images on screen of thermal imaging camera known as thermal images or THERMOGRAMS. It show heating of the objects through bright and dark colours showing variation of temperature. Thermal images with dark colour shows cold area and bright colour shows hot area due to heat [9].
To view defects and failure shown in thermal images with more clarity, they are processed through digital image processing techniques. After the acquisition of thermal image data, these techniques involve image filtering, image enhancement, image segmentation, feature extraction [10]. Watershed transform is known as region based segmentation method. This method is helpful to segment an image and apply colours to achieve better view of understanding [11]. spelling. Digitize or paste down figures.
-
II. Solar Panels and Batteries
A solar cell is a semiconductor device which absorb solar radiations emitted by sun and converted them into electrical energy through photoelectric effect. A solar cell produce generally 3 watt (approx.) at voltage 0.5 V DC. These solar photovoltaic cells are connected in series and parallel arrangement to produce the desired rating. General classification of photovoltaic cells include Mono-Crystalline, Poly-Crystalline, Amorphous silicon (a-Si) and Organic photovoltaic cells. Many solar cells combine together to produce a solar module and solar modules form solar panels [12]-[13]. Solar batteries are used as a storage device and fill the gap between generation and consumption of photovoltaic solar power. Lead-acid batteries with plastic container are used for storage in solar photovoltaic generation system. There are certain ageing factors of battery which must be taken into consideration which they are in use such as high battery temperature, low battery temperature, corrosion and erosion of electrodes, acid stratification (corrosion of battery plates), sulphur deposition on battery plates and short circuiting of complete battery [14].
-
III. Concept of Thermal Images
First Infra-red radiations aka heat radiations were discovered by a German Astronomer, Sir Frederick William Herschel in 1800. The technique used for obtaining thermal images is known as thermal imaging. A thermal imaging camera detects thermal energy or infrared radiations emitted by the object above absolute zero temperature (-273°C) and produce thermal images aka THERMOGRAMS with dark colour as colder area and bright colour as hotter area [15]. Fig. 1 shows block diagram of a thermal imaging system used in thermal imaging cameras. The emitted infra-red radiations are collected through infra-red lens and passed to infra-red detector. Infra-red detector convert these radiations into electrical signal and produce THERMOGRAMS, which are passed through signal processing unit and displayed by display unit [16].
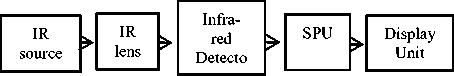
Fig.1. Block diagram for components of a thermal imaging system
-
IV. Image Segmentation And Watershed Transform
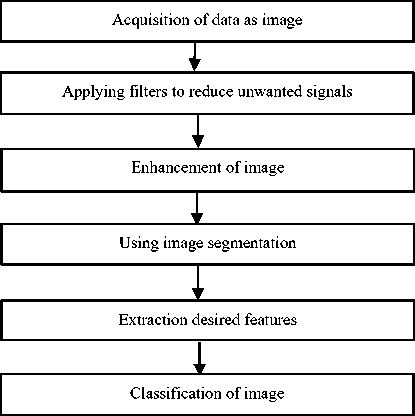
Fig.2. Main steps used in image analysis used in digital image processing
Digital image processing an important tool to analyse any image. Fig. 2 shows the main steps used to perform image analysis in digital image processing through a flowchart.
Image segmentation is an important step in digital image processing basically used to divide an image/object into foreground and background regions. There are several image segmentation techniques used for an image which can be classified as edge based segmentation, region based segmentation and special theory based segmentation. The following fig. 3 shows classification of image segmentation techniques used in digital image processing [17-18].
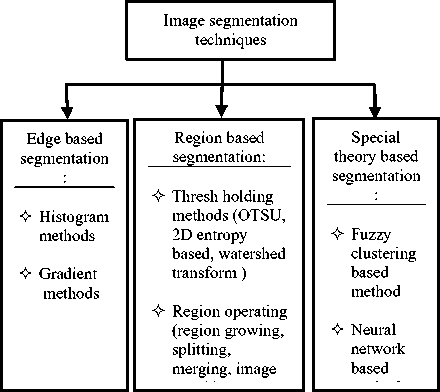
Fig.3. Image segmentation techniques
Image segmentation based on watershed transform is an efficient technique to determine to area of interest in an image. When a landscape is flooded by water with holes in local minima, catchment basins will fill up with water. The water will stop filling when peak of landscape has reached as a result image is partitioned into regions or basins separated by dams called watershed ridge lines. The catchment basins correspond to regions of an image and watershed ridge lines correspond to the edges of an image. Marker approach is used to avoid problem of over-segmentation in watershed transform [19]. Feature extraction is an another important operation of image segmentation which has capability to extract the image parameters in pixel form. Most common extracted features for an image are area, perimeter, mean, standard deviation, major and minor axis length [20].
-
V. Heat Visualization in Thermal Images Using Watershed Transform
Thermal images for solar photovoltaic panels having heated areas are analysed using digital image processing. It presents a coloured view of heated area of solar panels [21]. Besides heating it also analyse breaking of glass, hot spots in solar cells, shadow effects and cracks in cell [22]. The application of image processing on thermal images give improved results [23]. Watershed transform is a popular technique used for image segmentation. Application of watershed transform technique in thermal images gives the desired pseudo-coloured segmented thermal image. The heated areas in thermal images are segmented with a pseudo-colours. This algorithm gives a clear view of segmented thermal image for better analysis [24]. When watershed transform is directly applied to thermal images without any pre-processing of thermal image leads to over-segmentation. This problem makes many regions of segmented image due to noise contain in thermal images. To reduce over-segmentation marker based approach is used in watershed transform [25].
-
VI. Work Done for Heat Visualization in Thermal Images for Solar Panels And Batteries
-
A. Apparatus and set up used in Experiment:
The work done involves a thermal imaging camera (KUSAM MECO model TE-P) for thermal data acquisition and Matlab R2010a software for using image segmentation analysis using watershed transform. The solar panels were installed on roof of a building and for solar batteries placed in battery room. The measurements for experiment were done on Monday, 20.03.17 with normal operating conditions of atmosphere and full load connected to solar panels. The specifications of solar panels, thermal camera and solar batteries used in experiment is given table 1, table 2 and table 3 respectively:
Table 1. Specifications of Solar Panels
|
S.No. |
Name |
Value |
||
|
1. |
Company |
BHEL |
||
|
2. |
Module No. |
L20220 |
||
|
3. |
р . maximum |
220 WP |
||
|
4. |
V ■ ч open circuit |
36 V |
||
|
5. |
I short circuit |
8.3 A |
||
|
6. |
V 1 m peak |
29 V |
||
|
7. |
I m peak |
7.60 A |
||
|
8. |
Maximum system voltage |
1000 V |
||
|
9. |
Bypass diode rating |
15 A |
||
|
10. |
Maximum over current protection |
15 A |
||
|
11. |
A. |
STC (Standard test conditions): |
INSOLATION |
1000 W/m2 |
|
B. |
AM |
1.5 |
||
|
C. |
Cell Temp. |
25 °C |
||
Table 2. Specifications of thermal camera
|
Thermal Camera Info. |
Value |
|
Type of Detector |
UNCOOLED FPA Micro-bolometer |
|
Min. Focus distance |
0.3m |
|
Spectral range |
8-14μm |
|
Measurement Temp. |
-20 °C to +350° C |
|
Environment operating Temp. |
-15 °C to +50 °C |
|
Environment humidity |
≤ 90 % Non-condensing |
|
Accuracy |
± 2°C |
|
Thermal sensitivity |
≤ 0.1C @ 30 °C |
|
Colour palette |
11 Changeable |
|
Laser pointer |
Class 2, 1mw/635 nm (red) |
Table 3. Specifications of battery
|
Battery Information |
Value / Details |
|
Company |
EXIDE |
|
Model |
OPZS 700 |
|
Other details |
Tubular battery with transparent SAN container |
|
Manufacturing year |
2010 |
|
Rating: |
2V, 700 AH |
|
No. of cells |
01 |
|
No. of terminals |
04 (2 positive, 2 negative) |
|
Voltage per cell |
2 volt |
-
B. Effect of temperature on solar panel and battery:
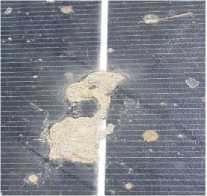
The bird droppings and cement deposit increase the temperature of solar panel, which cause heating of deposited portion. As a result performance of solar panel decreases. The heating in battery affects the efficiency and may be a reason of explosion.
The table 4 shows temperature variation of bird droppings and cement deposit with time for solar panel.
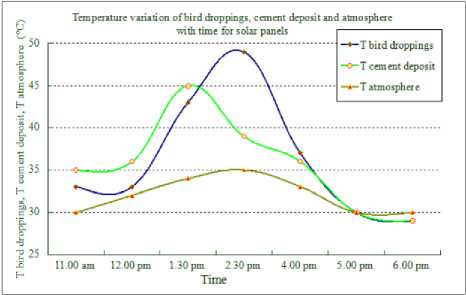
The fig. 4(a), fig. 4(b) and fig. 4(c) shows original image of bird droppings and cement deposit and graph for temperature variation of bird droppings and cement deposit with time respectively.
Table 4. Temperature variation of bird droppings and cement deposit on solar panel with time
|
T solar panel (°c) /т- Time |
T bird droppings (°C) |
T cement deposit (°C) |
T atmosphere (°C) |
|
11 am |
33 |
35 |
30 |
|
12 pm |
34 |
36 |
32 |
|
1.30 pm |
43 |
45 |
34 |
|
2.30 pm |
40 |
39 |
35 |
|
4 pm |
37 |
36 |
33 |
|
5 pm |
30 |
30 |
30 |
|
6 pm |
29 |
29 |
30 |
(a) (b)
(c)
Fig. 4
The fig. 4(c) shows that the temperature of bird droppings and cement deposit vary with atmospheric temperature. At 2.30 pm when atmospheric temperature is highest, the temperature of bird droppings and cement deposit reach at highest level. This high temperature cause heat of deposited area. As atmospheric temperature decreases both temperature of bird droppings and cement deposit fall accordingly. The table 5 shows variation of temperature in a heated battery, healthy battery with room temperature, in which batteries were placed.
Table 5. Temperature variation of heated battery, healthy battery and battery room with time
|
T battery (°C) / Time |
T heated battery (°C) |
T healthy battery (°C) |
T battery room (°C) |
|
11.00 am |
36 |
35 |
35 |
|
12.00 pm |
39 |
38 |
37 |
|
1.30 pm |
40 |
39 |
38 |
|
2.30 pm |
48 |
42 |
42 |
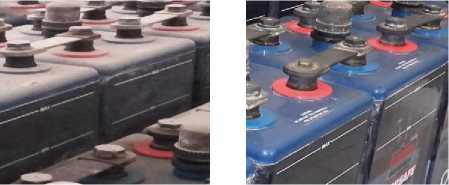
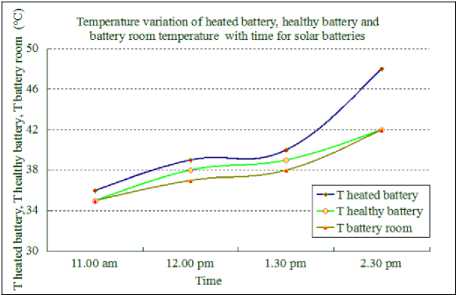
The fig. 5(a), fig. 5(b) and fig. 5(c) shows original image of heated battery, healthy battery and graph for temperature variation of batteries with time respectively.
(a) (b)
(c)
Fig. 5
The fig. 4(c) shows that as battery room temperature increases the temperature of heated battery increases rapidly. It is highest at 2.30 pm. Temperature of healthy battery vary in almost same fashion as battery room temperature.
-
C. Algorithm used
In this experiment marker based watershed transform algorithm is used for heat visualization in thermal images. As simply applying watershed transform for thermal images give over-segmentation problem, so to get better results marker based approach is used. Figure 6 shows the flowchart of algorithm used in experiment.
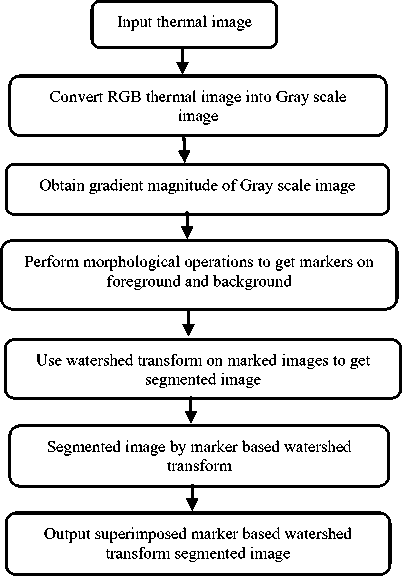
Fig.6. Flowchart of marker based watershed algorithm
The steps of marker based watershed algorithm used in experiment can be explained as:
-
1. Step 1: Input the captured thermal images from thermal imaging camera.
-
2. Step 2: Obtain Gray scale image from RGB input thermal image because watershed transform can be applied to Gray scale images only.
-
3. Step 3: Find gradient magnitude of the converted Gray scale image. If watershed transform is applied at this stage problem of over- segmentation occurs, so perform morphological operations to get marked images as given in step 4.
-
4. Step 4: Perform morphological operations to find foreground and background markers.
-
5. Step 5: Apply watershed transform on marked
-
6. Step 6: Coloured watershed transform segmented
-
7. Step 7: Finally superimposed segmented images are obtained at output.
images to get segmented image.
images are obtained at this stage.
Experimental work:
The captured thermal images for bird droppings and cement deposit shows heated area along with other unwanted objects. Marker based watershed transform helps to segment only desired heating area with a coloured image for clear view. The experimental work performed to analyse heating effects in thermal images for solar panels and battery was divided into two parts.
First part- A Heat visualization in thermal images for solar panels using marker based watershed transform
Second part- B Heat visualization in thermal images for batteries using marker based watershed transform
-
D. Heat visualization in thermal images for solar panels using marker based watershed transform:
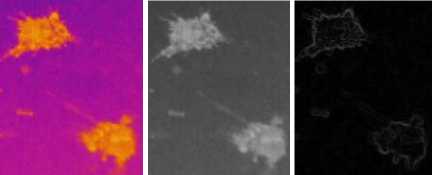
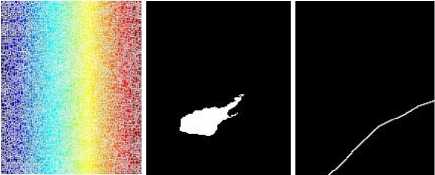
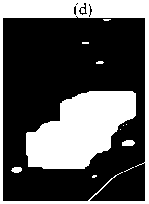
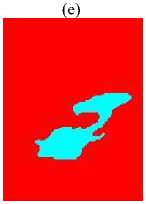
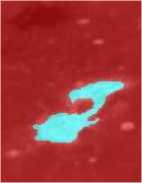
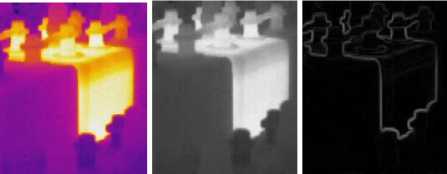
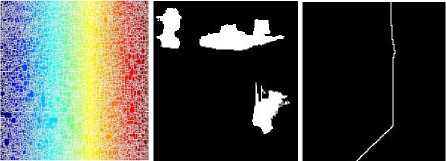
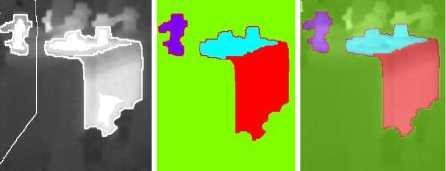
The bird droppings and cement deposits on solar panel surface cause shading and produce heating, so in this part problems of bird droppings and cement deposits on solar panel surface are selected. The original thermal image consists of two bird dropping with some small pellets and cement deposits. The object is to segment heated area of two bird dropping and cement deposits. The fig 7(a) to fig. 7(i) show heat visualization with watershed transform using marker based approach for bird droppings situated on the surface of solar panels.
(a) (b) (c)
(g) (h) (i)
Fig. 7
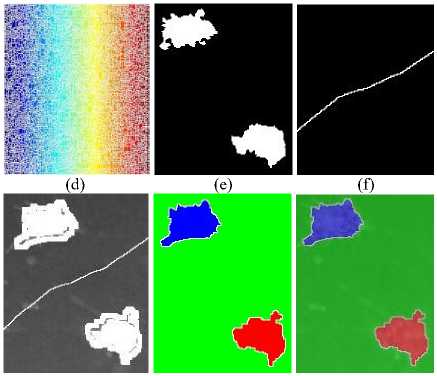
Fig. 7(a). original thermal image, fig. 7(b). Gray scale image, fig. 7(c). gradient magnitude image, fig. 7(d). over-segmentation of watershed transform, Fig. 7(e). region of maxima, Fig. 7(f). watershed ridge lines, fig. 7(g). markers and object boundaries super imposed on original thermal image, fig. 7(h). coloured segmented watershed transform, fig. 7(i). superimposed segmented image of watershed transform
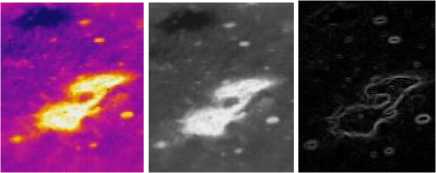
The original RGB thermal image of bird droppings obtained from a thermal camera shown in fig. 7(a) is converted into Gray scale image through Matlab function rgb2gray. The fig. 7(b) shows converted Gray scale image of droppings. After obtaining Gray scale image a gradient magnitude is calculated as a segmentation function to find images dark regions of desired bird droppings using SOBEL edge masks with IMFILTER. The fig. 7(c) shows the magnitude gradient image. When watershed transform is applied at this stage without markers on image will give over-segmentation fig. 7(d) shows watershed transform applied directly to magnitude gradient image resulting into over-segmentation. Fig. 7(e) shows image for maxima of opening-closing by reconstruction as a part of morphological operations. Fig. 7(f) shows image of watershed ridge lines. Fig. 7(g) shows superimposed image with marked objects and boundaries after applying watershed transform. Fig. 7(h) shows coloured watershed transform segmented image with desired two bird droppings only. The fig. 7(i) shows coloured watershed transform segmented superimposed image. The superimposed images of bird droppings represents the heat generated area clearly. The fig. 8(a) to fig. 8(i) shows heat visualization with watershed transform using marker based approach for cement deposits present on the surface of solar panels.
(a) (b) (c)
(f)
(g) (h) (i)
Fig. 8(a). original thermal image, fig. 8(b). Gray scale image, fig. 8(c). gradient magnitude image, fig. 8(d). over-segmentation of watershed transform, Fig. 8(e). region of maxima, Fig. 8(f). watershed ridge lines, fig. 8(g). markers and object boundaries super imposed on original thermal image, fig. 8(h). coloured segmented watershed transform, fig. 8(i). superimposed segmented image of watershed transform
Fig. 8(a) is the original RGB thermal image of cement deposit noticed on solar panel captured from a thermal imaging camera. Fig. 8(b) shows Gray scale image obtained through Matlab function rgb2gray. SOBEL edge masks with IMFILTER are used to obtain gradient magnitude of Gray scale image to find dark regions of cement deposits, as shown in fig. 8(c). Fig. 8(d) shows watershed transform applied directly to gradient magnitude image resulting into over-segmentation. Fig. 8(e) shows image for maxima of opening-closing by reconstruction as a part of morphological operations. Watershed ridge lines are shown in fig. 8(f). Fig. 8(g) shows superimposed image with marked objects and boundaries after applying watershed transform. Fig. 8(h) shows coloured watershed transform segmented image with cement deposit. The fig. 8(i) shows superimposed image for coloured watershed transform. Cement deposited area responsible for heat is superimposed on original image in last image to show a clear view of heat visualization.
-
E. Heat visualization in thermal images for batteries using marker based watershed transform:
The batteries used in solar photovoltaic system remain connected to solar panels always. As continuous charging, discharging and operation of batteries depend on load connected to solar panels. All these processes along with ambient temperature affect battery temperature and causes heating. The thermal images sense this heat through thermal imaging camera. The heated area can be visualized more clearly using marker based transform approach. Fig 9(a) to fig. 9(i) show heat visualization of batteries placed in solar battery room.
(a) (b) (c)
(d) (e) (f)
(g) (h)
(i)
Fig. 9(a). shows original thermal image, fig. 9(b). Gray scale image, fig.
9(c). gradient magnitude image, fig. 9(d). over-segmentation of watershed transform, Fig. 9(e). region of maxima, Fig. 9(f). watershed ridge lines, fig. 9(g). markers and object boundaries super imposed on original thermal image, fig. 9(h). coloured segmented watershed transform, fig. 9(i). superimposed segmented image of watershed transform
The fig. 9(a) is original thermal image and fig. 9(b) is the converted Gray scale image obtained from original RGB thermal image. Fig. 9(c) is gradient magnitude image and fig. 9(d) shows over-segmented image for watershed transform. Fig. 9(e) and fig. 9(f) shows image with maxima and watershed ridge lines. Fig. 9(g) shows markers and object boundaries superimposed on original image.
The fig. 9(h) shows segmented pseudo-coloured watershed transform image of battery showing heated area. For clear visualization the pseudo-coloured watershed transform segmented image is superimposed transparently on original image. The fig. 9(i) shows superimposed segmented image of battery using marker based watershed transform.
-
VII. Results and Discussions
The features extracted from binary image of heated portions for solar panel and battery are obtained in terms of area, perimeter, major axis length and minor axis length, which are measured in image pixels. These features are shown in table 6.
Table 6. Features of segmented image
|
Heated Portions / Values |
Area (pixels) |
Perimeter (pixels) |
Major Axis (pixels) |
Minor Axis (pixels) |
|
Bird deposits |
124.194 |
53.945 |
17.276 |
10.026 |
|
Cement deposits |
88.031 |
32.220 |
11.573 |
6.4822 |
|
Battery |
464.862 |
77.207 |
22.763 |
13.966 |
The above table 6 shows the area, perimeter, major axis and minor axis in pixels for the heated portion in segmented binary image, indicating the seriousness of heated component/ portion. Finally pseudo-colours are applied to the heated segmented area for better visualization.
-
VIII. Conclusion
This paper explains the application of image segmentation using marker based watershed transform in heat visualization of infra-red thermal images for solar panels and battery. This technique add pseudo-colours to the segmented image to present a sharp view of heated portions. Finally a superimposed image is obtained to get real visualization effect.
The first part of work focus on application of marker based watershed transform in thermal images for bird droppings and cement deposit on the surface of solar panels. The thermal images show heated area only in terms of temperature but in order to know the depth of heat image segmentation is used. When these thermal images are processed through the marker based watershed transform technique, a more clear view of heated area is obtained.
The second part of work deals with thermal image segmentation using marker based watershed transform of solar batteries. After processing of thermal image of battery the areas which have more heat as compared to rest of part is segmented. Then segmented image is applied with pseudo-colours using watershed transform clearly showing heated areas in battery with different colours. Finally feature extraction is also performed for heated areas of solar panel and heated battery. The extracted features like area, perimeter, major axis and minor axis are also calculated (in terms of image pixels)
from segmented binary image to indicate seriousness of heated portion of component.
Therefore the work done presents an efficient method to visualize heat in thermal image for solar panels and solar batteries.
References Efficient thermal image segmentation for heat visualization in solar panels and batteries using watershed transform
- Biran, D., Braunstein, A., “Solar radiation and energy measurements”, IEEE Transaction Power Apparatus and Systems, vol. 95, no. 3, pp. 791-794, 1976
- “Renewables 2015 Global Status Report”, REN 21Renewable Energy Policy Network for 21st Century, 10th Report in Series of GSR, pp. 18-174, 2015, www.ren21/status-of-renewables/global-status-report
- Jenkin, N., “Photovoltaic Systems for Small-Scale Remote Power Supply”, J. Power Engineering, IET, vol. 9, no. 2, pp. 89-96, 1995
- Mousa, K., Alzubi, H., Diabat, A., “Design of a Hybrid Solar-Wind Power Plant using Optimization”, 2nd Inter. Conference Engineering Systems Management and Its Applications (ICESMA), IEEE, Sharjah, pp. 1-6, 2010
- Davarifar, M., Rabhi, A., Hajjaji A.E., “Comprehensive Modulation and Classification of Faults and Analysis Their Effect in DC Side of Photovoltaic System”, J. Energy and Power Engineering, Scientific Research, vol. 5, pp. 230-236, 2013
- Chaudhary, A.S., Yadav, A., “An Overview of Faults and Health Monitoring Estimation of Solar Photovoltaic Power Generation”, Inter. J. Power Electronics Controllers and Converters, vol. 2, no. 2, pp. 19-23, 2016
- Chaurey, A., Daembi, S., “Battery Storage for PV Power Systems: An overview”, J. Renewable Energy, ELSEVIER, vol. 2, no. 3, pp. 227-235, 1992
- Haddad, R., Shahat , A.E., Kalaani, Y., “Lead Acid Battery Modelling for Solar Photovoltaic Applications”, J. Electrical Engineering, pp. 1-8
- Dorobantu, L., Popescu, M.O., Popescu, C.L., et. al., “Depositions Effects and Losses Caused by Shading on Photovoltaic Panels”, IEEE Conference Proceedings, 3rd Inter. Youth Conference on Energetics (IYCE), Leiria, pp. 1-5, 2011
- Aghaei, M., Gandelli, A., Grimaccia, F., et. al., “IR real- time Analyses for PV system monitoring by Digital Image Processing Techniques”, Inter. Conference Event-based Control, Communication, and Signal Processing (EBCCSP), IEEE, Krakow, pp. 1-6, 2015
- Srikanth, T., Kumar, P. P., Kumar, A., “Colour Image Segmentation using Watershed Algorithm”, Inter. J. of Computer Science and Information Technologies (IJCSIT), vol. 2, no. 5, pp. 2332-2334, 2011
- Mekhilef, S., Saidur, R., Kamalisarvestani, M., “Effect of dust, humidity and air velocity on efficiency of photovoltaic cells”, J. Renewable and Sustainable Energy Reviews, ELSEVIER, vol. 16, pp. 2920-2925, 2012
- “Hand Book for Solar Photovoltaic (PV) Systems” by Organisations-Solar Energy Research Institute of Singapore, Grenzone PTE Ltd, Phoenix Solar PTE Ltd, Singapore Polytechnic, SP Power Grid, Urban Redevelopment Authority, pp. 7-9
- Manimekalai, P., Harikumar, R., Raghavan, S., “An Overview of Batteries for Photovoltaic (PV) Systems”, Inter. J. of Computer Applications, vol. 82, no.12, pp. 0975-8887, 2013
- Shekhawat, R.S., “Infrared Thermography- A Review”, Inter. J. Engineering Trends and Technology, vol. 35, no.6, pp.287-290, 2016
- Rajmanova, P., Nudzikova, P., Vala, D., “Applications and Technology of Thermal Imaging Camera in Medicine”, Inter. Federation of Automatic Control, ELSEVIER, vol. 48, no. 4, pp. 492-497, 2015
- Kongkham, G., Santhosh Kumar, K.L., “Analysis of Image Segmentation Techniques”, Inter. Research J. of Computer Science (IRJCS), vol. 2, no. 6, pp. 45-53, 2015
- Yang, Q., Kang, W., “General Research on Image Segmentation Algorithms”, Inter. J. Image, Graphics and Signal Processing, MECS, vol. 1, pp. 1-8, 2009
- Mon, K.L., “Automatic Image Segmentation Using Edge and Marker-Controlled Watershed Transformation”, Inter. Conference Advances in Engineering and Technology (ICAET'2014), Singapore, pp. 100-104, 2014
- Mahajan, P., Madhe, S., “Morphological Feature Extraction of Thermal Images for Thyroid Detection”, Inter. J. Electronics Communication and Computer Engineering, vol. 5, no. 4, pp. 11-14, 2014
- E. Kaplani, “Detection of Detection of Degradation Effects in Field-Aged c-Si Solar Cells through IR Thermography and Digital Image Processing”, Inter. J. Photo-energy, vol. 2012, Hindawi Publishing Corporation, pp. 1-11, 2012
- Tsanakas, J.A., Ha, Long., Buerhop, C., et al., “Faults and Infra-red Thermographic Diagnosis in operating c-Si Photovoltaic Modules: A Review of Research and Future Challenges”, Renewable and Sustainable Energy Reviews, vol. 62, pp. 695-709, 2016
- Kannegulla , A., Salivahana Reddy, A., Sai Sudhir, KVR, et. al., “Thermal Imaging system for Precise Traffic Control and Surveillance”, Inter. J. Scientific & Engineering Research, vol. 4, no. 11, pp. 464-467, 2013
- Yasaswi, V., Keerthi, S., Jainab Begum, S., et. al., “Infra-red Thermal Image Segmentation for Fault Detection in Electrical Circuits Using Watershed Algorithm”, Inter. J. Engineering Trends and Technology (IJETT), vol. 21, no. 9, pp. 423-429, 2015
- Parvati,K., Prakasa Rao, B.S., Mariya Das, M., “Image Segmentation Using Gray-Scale Morphology and Marker-Controlled Watershed Transformation”, Discrete Dynamics in Nature and Society, pp. 1-8, 2008
