Email Spam Detection Using Combination of Particle Swarm Optimization and Artificial Neural Network and Support Vector Machine

Author: Mohammad Zavvar, Meysam Rezaei, Shole Garavand
Journal: International Journal of Modern Education and Computer Science (IJMECS) @ijmecs
Article in issue: 7 vol.8, 2016.
Free access
The increasing use of e-mail in the world because of its simplicity and low cost, has led many Internet users are interested in developing their work in the context of the Internet. In the meantime, many of the natural or legal persons, to sending e-mails unrelated to mass. Hence, classification and identification of spam emails is very important. In this paper, the combined Particle Swarm Optimization algorithms and Artificial Neural Network for feature selection and Support Vector Machine to classify and separate spam used have and finally, we compared the proposed method with other methods such as data classification Self Organizing Map and K-Means based on criteria Area Under Curve. The results indicate that the Area Under Curve in the proposed method is better than other methods.
Particle swarm optimization, artificial neural network, support vector machine, email, spam, classifying
Short address: https://sciup.org/15014886
IDR: 15014886
Text of the scientific article Email Spam Detection Using Combination of Particle Swarm Optimization and Artificial Neural Network and Support Vector Machine
Published Online July 2016 in MECS
Today, The letter is one of the most important and widely used for communication between people. The increasing popularity and low cost of this area has provided bases that people are sending e-mail unrelated to mass. This is a so-called spam or UCE called. Spam is a waste of time, occupation sources, and waste bandwidth and thus prolonged their relationship. Investigations have shown that about 70% of a business in today's mail, spam. So far, some anti-spam filters are supplied with two different approaches: The first approach without the use of machine learning, methods such as method of intuitive, black lists, signatures, hashing and traffic analysis provided by.
The second approach is based on machine learning. In this approach, a training set of normal and spam e-mails are needed. Each machine learning methods, trained on data collection learn. In a series of tests to determine the type of e-mail, e-mail that has been pre-determined type with a different instruction set, are used.
The success of machine learning techniques to classify texts researchers to use these methods in spam filtering has directed [1] . The spam filtering weed species based on their textual content, is a special case of classification texts where two classes are considered spam and useful mail [2] . A common problem of separation of spam so that no mistake has not set a weed is very important, and it is an important criterion in the evaluation of efficient spam filters used. Is a reminder of the cost of a normal block by mistake as a weed, it is more than the cost of a pass filters spam. As a result, these differences should both learn and test phase, to be considered [3] .
In this paper, the combined Particle Swarm Optimization algorithms and Artificial Neural Network for feature selection and Support Vector Machine to classify and separate spam used have. To assess the effectiveness of the proposed method, the standard data sets in UCI database is used. Besides, in order to review the method of Particle Swarm Optimization, Artificial Neural Network and Support Vector Machine pay and the proposed methods to identify spam, the evaluation results will be discussed.
-
II. Related Works
This section examines some of the work and research in the field of diagnosis is considered spam. Including methods for spam filtering approach to learning methods of machine learning, decision tree [4] , Naïve Bayesian [3, 5] , SVM [2, 6] or a combination of various provisions [7] mentioned.
One of the most common methods of classification of texts and e-mails is Bayesian method. This method is quick and easy learning and classification incremental learning is possible. Shamsi and colleagues[8] Bayesian classification method used to isolate a weed. Androutsopoulos and colleagues[3-5] in the proceedings, a simple Bayesian filter by Shamsi and his colleagues developed and the effect of different attributes and different sizes of the training was to evaluate the performance of the filter. At the same time, the efficiency of simple Bayesian methods were compared based on memory and the results showed that both methods are more effective than keyword-based filtering method.
Drucker and colleagues [6] of a SVM to classify content according to their use. The efficacy of the methods Ripper, Rocchio and BDT were compared. BDT and SVM methods acceptable performance in terms of accuracy and speed in the test showed. The BDT learning time is too long. Woitaszek and colleagues [9] of a SVM simple and a personal dictionary to determine the e-mails are commercially used.
Although the nearest neighbor method is one of the issues in machine learning, in the context of spam filtering, is rarely used. Trudging and Yang [10] of the method used to classify a text and have compared with other methods.
Choose a decrease of texts attribute to markets, many statistical methods have been proposed. Koprinska and his colleagues [11] have developed a method to choose the character of the TFV. This method compared to the IG that the strongest and most common methods of feature selection is considered, along with SVM has shown better performance in separate letters.
-
III. Statement of Concepts
In this section we review basic concepts of Particle Swarm Optimization and Artificial Neural Network and Support Vector Machine.
-
A. Particle Swarm Optimization
The idea Particle Swarm Optimization or PSO, first introduced by Kennedy and Eberhart in 1995 [12] . PSO, an evolutionary algorithm inspired by nature and basis of calculation is repeated. The behavior of individuals in a society where success follow a very simple pattern and put themselves and others at it, trying to improve every aspect of your. This type of community members, the main idea of collective intelligence-based optimization algorithms to find the optimal solution in a multidimensional search space.
Particle swarm algorithms, search the assistance of a group of particles, each potential solution is an optimization problem is done. This category is used as a community and particles, corresponding with the community to achieve the best questions of their data and other particles. It can thus be seen that the particles in a multi-dimensional search space flying; So that every bit of your data and neighbors are constantly changing your direction and move to the area with more appropriate solutions. In each iteration, each particle by adding a vector shift, which is called the velocity vector, the previous location of the particle to be updated.[13]
xi (t + 1) = xi (t) + V, (t + 1)
with (1)
xi ( t ) ~ u ( x min, x max)
As equation (1) shows, the velocity vector is optimal process control. The vector, a bit experimental data and exchange information with neighboring particles in it. Information and experience gained particle that is called personal factors that are its best position ever achieved particle is proportional to. Information obtained from other particles called social component that is best obtained from the population.
Particle swarm optimization algorithm is a method for finding the optimal solution of global problems using it can answer one or more points in n-dimensional space to be treated. In this way, if desired particles initially placed in the search space and define an initial velocity for each particle, defined communication channels between the particles. The particles move in the search space and the results of this move, based on a criterion of merit is calculated after each interval. Over time, the particles to the locations that have higher eligibility criteria and are in the same communication, accelerated. The main advantage of this method is based on minimization strategies is that the large number of particle swarm, the flexible approach to the problem of local minima is answered. This method is the most appropriate network routing algorithm as ants also been proposed. [14]
In general, a variety of search methods trap particles differ in defining neighborhoods and divided into two categories: global search and local search. The global version neighbor each particle, the particle population and a global social network is formed. In this model, the information society, the best place I have ever found and shown by population. Equation (2) is calculated vj(t + 1) = vij-(t)
+ c 1 r ij ( t )[ yy( t ) - x ij (t )]
+ c 2 r 2j ( t )[ y j (,t ) - x j (t )]
Where c1 and c2 constant acceleration and a uniformly distributed random values between 0 and 1.
-
B. Artificial Neural Network
Artificial Neural Network or ANN, are novel computational methods and systems for machine learning, knowledge representation, and finally apply the knowledge gained in response to higher projected output of complicated systems. The main idea of these networks inspired by the way biological nervous system function, to process data and information to the learning and knowledge creation.[15,16] The key element of this idea, the creation of new structures for information processing systems. The system of processing formed extremely large number of interconnected neurons to solve a problem with the name in unison, and data are transferred. In many complex mathematical problems to solve complex nonlinear equations leads, A Multilayer perceptron network can easily be used as weights and proper functions.[17] In this type of network to apply an input layer, a layer is hidden inputs and an output layer that finally answers the question of return, is used. An example of a network Multilayer perceptron in Fig1 is shown.
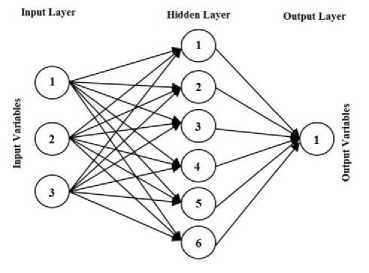
Fig.1. Multilayer Perceptron structure with hidden neurons and output neurons with linear function.
In this network, the actual output compared with the desired output and the weights by propagation algorithm, is placed under the supervision of the appropriate pattern is formed. for input pattern p, square output error for all cells output layer as follows:
s
E p = -( dP - УР) 2 = -E( d j — У Р ) 2 (3)
2 2 i = 1
In which d p the desired output for the j-th cell in the output layer, s output vector dimension, y p the real output vector and d p the vector output are desired. The total square error E to P model in equation (4):
P Ps
E = E E p = - EE ( d p - y p )2 (4)
p = 1 2 p = 1 j = 1
Weights to be adjusted the aim of reducing the cost function E, the minimum gradient downward. The equations updating the weights are as follows:
w j (t + 1) = w j (t ) + nA ws (t ) + aA (t - 1) (5)
Where dE, A„, (t) = -( p )
j d W j ( t )
П the learning factor, a factor the moment,
W y (t +1) the new weight and w ^ (t) is the previous weight. In this method, weights are repeatedly updated for all learning patterns.
The process of learning stops when the total error for pattern p less than the specified threshold, or the number of training courses to an end. It should be noted that the teaching methods, teaching methods and the potential propagation term is a moment of convergence in the local minimum to reduce propagation method.
-
C. Support Vector Machine
Support Vector Machine or SVM is principally a linear machine which the main idea is to create a super plane as levels of decision-making, so that the limit of separation can be extreme between positive and negative samples. This technique by using a method which is based on statistical learning theory achieves to the above optimization features. More precisely, SVM is an implementation of approximation of the "structural risk minimization". SVM training algorithm structure is based on a core of inner multiplication between a support vector such as x i and the vector x derived from the input space. The smallest subset of training data extracted by the algorithm is called Support Vector. Depending on how the multiplication core of the inner forms, it may be different training machines with non-relevant planes of the decision obtained [18-20] .
Consider training sample {( x , d )} N in which x i is an input algorithm for the sample n and di is the corresponding final output which is different with the input. We assume that classes displayed with a subset of d =+ 1 and d =- 1 are linearly separable. A plane of decision-making equation such as the above plane is as follows:
w T x + b = 0 (6)
Where x is an input vector, w is an adjustable weight vector and b is a Bias. The above equation can be written as follows:
w T x + b > 0 for di = + 1
wT xt + b < 0 for dt = - 1
For a given weight vector w and a bias b, the distance between the above plane defined in equation (6) and closest data point is called the resolution and it is showed with p. SVM goal is to find these unique plane which the resolution p is at its maximum. In this situation, the decision level is considered as the optimal hyperplane. Fig2 shows the geometry structure of the optimal hyperplane for a two-dimensional input space.
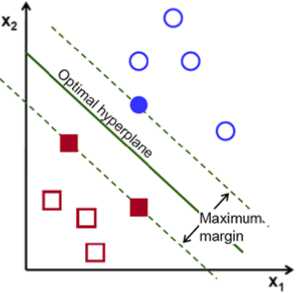
Fig.2. A view of the whole idea of an optimal hyperplane for linearly separable patterns [19] .
Now consider w and b as values to the optimal weight vector and bias. Therefore, optimal hyperplane is defined as follows:
w T x + b o = 0 (8)
The main argument of finding parameters w and b for optimal hyperplane with a set of certain training is T = {( xt , dt )} . Then, pair ( Xo , do ) must satisfy the following conditions.
wTx, + b, ^ 1 for d, = +1 oi o i wTx + bo <-1 for di=-1
Data points (x,d) which in the condition of equality for both formula (9) apply, is called Support Vector and hence they are called Support Vector Machine. These vectors play a prominent role in the performance of this type of training machines. Conceptually, backup vectors are data points that are located near the plane of making decisions, and therefore they are hardly be classified. To obtain optimal hyperplane, with the help of Lagrange multipliers and after performing calculations we will get to the following algorithm: Given the training sample {(xz,dz)}, find Lagrange coefficients {a.}N so that it maximizes the following objective function:
N NN
Q ( « ) = Z a . - 1 ZZ aa j dd j x i x j (10)
i = 1 2 i = 1 j = 1
Due to the limitations:
Where C is a positive parameter identified by the user.
-
IV. The Proposed Method
To use the letters to learn, they should be properly displayed. For this reason, the pre-processing steps and reducing attributes, done on a network and then taught. Three pre-processing operation to remove redundant words, remove the label and the roots of the words are the documents. Waste words are common words that are not containing much information, as well as in all the literature in large numbers there and did not have to distinguish text to other texts, Such as conjunctions and prepositions. Tags are similar to HTML tags and XML, that all of them can be removed from a content. In the roots, derivatives instead of a word, almost brought the root word that thus somewhat reduced the number of words of the document. There are several algorithms for this action, of which we can root out endemic porter and lemmatizer. The index is, in fact display a determined way. The most common way to use the vector space model, which is a non-sense. This means that each letter can be a vector that every element of it, the presence or absence of a word in a word or number is its weight.
Several approaches to weight to the words of the document are based on repetition. They include: binary weighting, weighting by repeating words, weighting TFIDF, weighting TFC, weighting and weighting LTC entropy [1, 22, 23] .
The next step is to reduce the dimensions of the vector corresponding to the letter. Because letters in the classification, the number of attributes, in other words, a large number of words, the size will be very large problem and working on it is time-consuming and costly. Therefore, to reduce the size of a vector, various methods can be used for text feature selection. In the feature selection methods, we try to select the best attribute so that the elimination of other attributes, the separation of letters is not changed [24] .
In this paper, to reduce the number of properties combining particle swarm optimization algorithms and artificial neural network MLP've used. The proposed method of data normalization, feature selection stage, the number of particles was 20 and their performance binary and True or False indicates they select or deselect the relevant attributes. The greatest number of repetitions to 10 and the number of features of the algorithm was considered equal to 6.. The graph in Fig3 has been shown to reduce the cost of feature selection.
N
Z a i d i = 0 (11)
i = 1
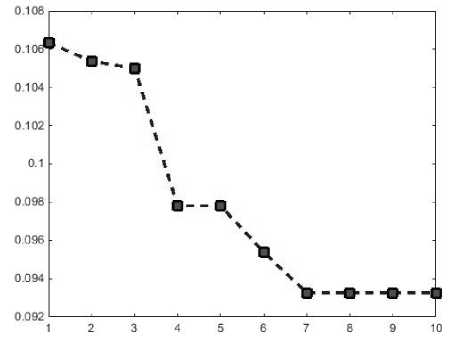
Fig.3. The cost of feature selection
Once the feature was selected, for the Classification of SVM method we have used letters.
SVM is a statistical classification which at first through some kernels maps non-linear data in a high-dimensional space and then tries to find hyperplane that data separate with maximum margin that of this hyperplane. SVM in its general form is used for issues of two classes that for the same purposes, according to research, it is responsive to our needs. From the crucial features of SVM is data classification based on minimizing data error of test sets if in the other classification such as neural networks of performance is based on data collection of educational sets. That's why in SVM, there is not another issue of concern within the local minima.
In the dataset that they will be used, the desired output at 1 and 0 are two categories. When after classification, assessment of the proposed method is performed easier we replace number 1 rather than 1 and number -1 rather than 0. Also, to work with SVM, the data should be divided into two parts to be used some parts of the data for training and some for testing the network. In this paper, 70 percent for education and 30 percent for network testing will be used. It should be noted that all input data that will be used in the education and testing, with the order that was previously said they become normal.
-
V. Evaluation Method
In this section, the results of the application of SVM-based methods are discussed, and these results with the results of SOM and K-Means methods will be compared. In this paper, the standard data sets in UCI database is used [25] . The collection includes a 4601 letter. The last column denotes whether the e-mail was considered spam (1) or not (0), i.e. unsolicited commercial e-mail. Most of the attributes indicate whether a particular word or character was frequently occuring in the e-mail. The runlength attributes (55-57) measure the length of sequences of consecutive capital letters. Here are the definitions of the attributes:
-
• 48 continuous real [0,100] attributes of type
word_freq_WORD
=percentage of words in the e-mail that match WORD, i.e. 100 * (number of times the WORD appears in the e-mail) / total number of words in e-mail. A "word" in this case is any string of alphanumeric characters bounded by nonalphanumeric characters or end-of-string.
-
• 6 continuous real [0,100] attributes of type
char_freq_CHAR[
=percentage of characters in the e-mail that match CHAR, i.e. 100 * (number of CHAR occurences) / total characters in e-mail
-
• 1 continuous real [1,...] attribute of type
capital_run_length_average
=average length of uninterrupted sequences of capital letters
-
• 1 continuous integer [1,...] attribute of type
capital_run_length_longest
=length of longest uninterrupted sequence of capital letters
-
• 1 continuous integer [1,...] attribute of type
capital_run_length_total
=sum of length of uninterrupted sequences of capital letters
=total number of capital letters in the e-mail
-
• 1nominal {0,1}10 class attribute of type spam =denotes whether the e-mail was considered spam (1) or not (0), i.e. unsolicited commercial e-mail.
In the proposed method for SVM, parameter C was considered equal to 100 and according to the data, linear function was used as the kernel of the network which in equation (13), the linear function was shown.
K ( xt , Xj ) = X T . x (13)
After completion of training, we tested the network. But the knowledge that in the learning stage model is produced must be analyzed in the evaluation stage in order to determine its value, and following it, learning algorithm efficiency of model will also be identified. These criteria can be educational for data collection in the learning stage and the trial records set at the evaluation stage. Also a condition for success in the enjoyment of data science of seeking interpretation of knowledge is evaluated and produced. One of the key criteria used to determine the performance of a classification criterion is AUC (Area Under Curve). AUC represents the level under the curve of ROC (Receiver Operating Characteristic) that the greater the value of this number related to a group, the marginal efficiency of a classifier is desirable to evaluate. UAC is calculated through the equation (14) [26] :
AUC = 1 + TPR - FPR (14)
Where
TPR =
TP
TP + FN
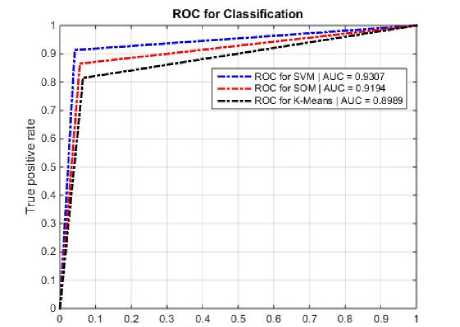
in the method of SOM is equal to 0.9194 and in K-Means method is equal to 0.8989 which these results indicate that the proposed approach in performance is better than other methods.
and
FPR =
FP
FP + TN
TP and TN are the number of data, respectively that have been correctly predicted positive and negative. FP and FN are the number of data, respectively that have been expected falsely positive and negative.
A ROC curve allows a visual comparison to a set of classifiers; also numerous points in the ROC space are significant. The lower left point (0, 0) indicates the strategy that will be generated in a positive classification. The opposite strategy, produced without condition of positive classification, is determined with top right point (1, 1). Point (0, 1) shows perfect grouping. More generally, a point in the ROC space is better than another if more space is located in the northwest. Also keep in mind that curves ROC show a classifier behavior regardless of the distribution of categories or cost of an error, therefore, performance separate classification from these factors [27]. Only when a classifier in the performance space clearly dominates the other categories, we can say that this is better than the other. For this reason, the area under ROC curve showing the AUC criterion can play a decisive role in introducing categories of supremacy clause. In Fig4 ROC curve AUC value for the proposed approach and methods of SOM and K-Means are shown.
False positive rate
Fig.4. ROC curve AUC value of the proposed method and other methods
Unlike other criteria for determining the efficiency classifier, AUC criterion is independent of decision making threshold of classifier. Therefore, this measure is an indicative of the reliability of the output of a classification specified for different data sets that this concept is not comparable by any other performance measures derived the category. As it is shown in Fig4, AUC amount is equal to 0.9307 in the proposed method,
-
VI. Conclusion
In this paper, after reviewing the classification and identification of spam, to provide PSO-ANN and ANFIS algorithm-based method for the detection and isolation of spam discussed and proposed method on standard data sets in UCI base our actions on the Original data from 70% to education and 30 percent was used for testing network. After the training network to test and evaluate it looked in the experiments, values of RMSE, NRMSE, and STD for the proposed method, respectively 0.08733, 0.0185 and 0.08742, the results show that the proposed method has good accuracy and performance for detecting spam and classify e-mail.
-
[1] Sebastiani, F., Machine learning in automated text categorization. ACM computing surveys (CSUR), 2002. 34(1): p. 1-47.
-
[2] A. Kołcz, J.A., SVM-based filtering of email spam with content-specific misclassification costs. Proc. of TextDM’01 Workshop on Text Mining, 2001.
-
[3] Androutsopoulos, I., et al., Learning to filter spam e-mail: A comparison of a naive bayesian and a memory-based approach. arXiv preprint cs/0009009, 2000.
-
[4] Androutsopoulos, I., et al., An evaluation of naive bayesian anti-spam filtering. arXiv preprint cs/0006013, 2000.
-
[5] Androutsopoulos, I., et al. An experimental comparison of naive Bayesian and keyword-based anti-spam filtering with personal e-mail messages . in Proceedings of the 23rd annual international ACM SIGIR conference on Research and development in information retrieval . 2000. ACM.
-
[6] Drucker, H., D. Wu, and V.N. Vapnik, Support vector machines for spam categorization. Neural Networks, IEEE Transactions on, 1999. 10(5): p. 1048-1054.
-
[7] Sakkis, G., et al., Stacking classifiers for anti-spam filtering of e-mail. arXiv preprint cs/0106040, 2001.
-
[8] Sahami, M., et al. A Bayesian approach to filtering junk email . in Learning for Text Categorization: Papers from the 1998 workshop . 1998.
-
[9] Woitaszek, M., M. Shaaban, and R. Czernikowski. Identifying junk electronic mail in Microsoft outlook with a support vector machine . in null . 2003. IEEE.
-
[10] Trudgian, D.C., Spam classification using nearest neighbour techniques , in Intelligent Data Engineering and Automated Learning–IDEAL 2004 . 2004, Springer. p. 578585.
-
[11] Koprinska, I., et al., Learning to classify e-mail. Information Sciences, 2007. 177(10): p. 2167-2187.
-
[12] Kennedy, J., Eberhart, R., Particle Swarm Optimization. Proceeding of International Conference on Neural Networks. Perth, Australia, 1995 IEEE, Piscataway, 1995,pp. 1942-1948., 1995.
-
[13] Jha, M.K., P. Schonfeld, and J.-C. Jong, Intelligent road design . Vol. 19. 2006: WIT Press.
-
[14] 14. Kennedy, J., et al., Swarm intelligence . 2001: Morgan Kaufmann.
-
[15] Gupta, N., Artificial neural network. Network and Complex Systems, 2013. 3(1): p. 24-28.
-
[16] Zavvar, Mohammad, and Farhad Ramezani. "Measuring of Software Maintainability Using Adaptive Fuzzy Neural Network." International Journal of Modern Education & Computer Science 7.10 (2015).
-
[17] Yetilmezsoy, K. and S. Demirel, Artificial neural network (ANN) approach for modeling of Pb (II) adsorption from aqueous solution by Antep pistachio (Pistacia Vera L.) shells. Journal of Hazardous Materials, 2008. 153(3): p. 1288-1300.
-
[18] Vapnick, V.N., The Nature of Statistical Learning Theory. Second Edition, Springer-Verlag New York Inc, 2000.
-
[19] Haykin, S., Neural Networks: A Comprehensive
Foundation. Second Edition, Prentice-Hall Inc, 1999.
-
[20] Burges, C.J., A tutorial on support vector machines for pattern recognition. Data mining and knowledge discovery, 1998. 2(2): p. 121-167.
-
[21] Melin, P., et al., A new approach for time series prediction using ensembles of ANFIS models. Expert Systems with Applications, 2012. 39(3): p. 3494-3506.
-
[22] Ass, K. and L. Eikvil, Text categorization: A survey . 1999, Technical Report. Norwegian Computing Center.
-
[23] Debole, F. and F. Sebastiani, Supervised term weighting for automated text categorization , in Text mining and its applications . 2004, Springer. p. 81-97.
-
[24] Bron, E., et al., Feature selection based on SVM significance maps for classification of dementia , in Machine Learning in Medical Imaging . 2014, Springer. p. 272-279.
-
[25] Lichma, M., Machine Learning Repository. http://archive.ics.uci.edu/ml , 2013.
-
[26] Davis, J. and M. Goadrich. The relationship between Precision-Recall and ROC curves . in Proceedings of the 23rd international conference on Machine learning . 2006. ACM.
-
[27] Fawcett, T., An introduction to ROC analysis. Pattern recognition letters, 2006. 27(8): p. 861-874.
References Email Spam Detection Using Combination of Particle Swarm Optimization and Artificial Neural Network and Support Vector Machine
- Sebastiani, F., Machine learning in automated text categorization. ACM computing surveys (CSUR), 2002. 34(1): p. 1-47.
- A. Kołcz, J.A., SVM-based filtering of email spam with content-specific misclassification costs. Proc. of TextDM'01 Workshop on Text Mining, 2001.
- Androutsopoulos, I., et al., Learning to filter spam e-mail: A comparison of a naive bayesian and a memory-based approach. arXiv preprint cs/0009009, 2000.
- Androutsopoulos, I., et al., An evaluation of naive bayesian anti-spam filtering. arXiv preprint cs/0006013, 2000.
- Androutsopoulos, I., et al. An experimental comparison of naive Bayesian and keyword-based anti-spam filtering with personal e-mail messages. in Proceedings of the 23rd annual international ACM SIGIR conference on Research and development in information retrieval. 2000. ACM.
- Drucker, H., D. Wu, and V.N. Vapnik, Support vector machines for spam categorization. Neural Networks, IEEE Transactions on, 1999. 10(5): p. 1048-1054.
- Sakkis, G., et al., Stacking classifiers for anti-spam filtering of e-mail. arXiv preprint cs/0106040, 2001.
- Sahami, M., et al. A Bayesian approach to filtering junk e-mail. in Learning for Text Categorization: Papers from the 1998 workshop. 1998.
- Woitaszek, M., M. Shaaban, and R. Czernikowski. Identifying junk electronic mail in Microsoft outlook with a support vector machine. in null. 2003. IEEE.
- Trudgian, D.C., Spam classification using nearest neighbour techniques, in Intelligent Data Engineering and Automated Learning–IDEAL 2004. 2004, Springer. p. 578-585.
- Koprinska, I., et al., Learning to classify e-mail. Information Sciences, 2007. 177(10): p. 2167-2187.
- Kennedy, J., Eberhart, R., Particle Swarm Optimization. Proceeding of International Conference on Neural Networks. Perth, Australia, 1995 IEEE, Piscataway, 1995,pp. 1942-1948., 1995.
- Jha, M.K., P. Schonfeld, and J.-C. Jong, Intelligent road design. Vol. 19. 2006: WIT Press.
- 14.Kennedy, J., et al., Swarm intelligence. 2001: Morgan Kaufmann.
- Gupta, N., Artificial neural network. Network and Complex Systems, 2013. 3(1): p. 24-28.
- Zavvar, Mohammad, and Farhad Ramezani. "Measuring of Software Maintainability Using Adaptive Fuzzy Neural Network." International Journal of Modern Education & Computer Science 7.10 (2015).
- Yetilmezsoy, K. and S. Demirel, Artificial neural network (ANN) approach for modeling of Pb (II) adsorption from aqueous solution by Antep pistachio (Pistacia Vera L.) shells. Journal of Hazardous Materials, 2008. 153(3): p. 1288-1300.
- Vapnick, V.N., The Nature of Statistical Learning Theory. Second Edition, Springer-Verlag New York Inc, 2000.
- Haykin, S., Neural Networks: A Comprehensive Foundation. Second Edition, Prentice-Hall Inc, 1999.
- Burges, C.J., A tutorial on support vector machines for pattern recognition. Data mining and knowledge discovery, 1998. 2(2): p. 121-167.
- Melin, P., et al., A new approach for time series prediction using ensembles of ANFIS models. Expert Systems with Applications, 2012. 39(3): p. 3494-3506.
- Ass, K. and L. Eikvil, Text categorization: A survey. 1999, Technical Report. Norwegian Computing Center.
- Debole, F. and F. Sebastiani, Supervised term weighting for automated text categorization, in Text mining and its applications. 2004, Springer. p. 81-97.
- Bron, E., et al., Feature selection based on SVM significance maps for classification of dementia, in Machine Learning in Medical Imaging. 2014, Springer. p. 272-279.
- Lichma, M., Machine Learning Repository. http://archive.ics.uci.edu/ml, 2013.
- Davis, J. and M. Goadrich. The relationship between Precision-Recall and ROC curves. in Proceedings of the 23rd international conference on Machine learning. 2006. ACM.
- Fawcett, T., An introduction to ROC analysis. Pattern recognition letters, 2006. 27(8): p. 861-874.
