Emotion Classification Utilizing Transformer Models with ECG Signal Data

Author: Ch. Raga Madhuri, Kundu Bhagya Sri, Kasaraneni Gagana, Tiprineni Sathvika Lakshmi
Journal: International Journal of Modern Education and Computer Science @ijmecs
Article in issue: 6 vol.16, 2024.
Free access
In recent years, there has been growing interest in leveraging physiological signals, such as Electrocardiogram (ECG) data, for emotion classification tasks. This study explores the efficacy of utilizing Transformer models, a state-of-the-art architecture in natural language processing, for emotion classification using ECG signal data. The proposed methodology involves preprocessing the ECG signals, extracting relevant features, and model architecture consists of DistilBERT model, Pooling Layer to obtain a fixed-size representation of the ECG signal, Dropout Layer to prevent overfitting, Fully Connected Layer for classification. Experiments are conducted on publicly available dataset, demonstrating the effectiveness of the proposed approach compared to traditional machine learning methods. The results suggest that DistilBERT Transformer model can effectively capture complex temporal dependencies within ECG signals, thereby achieving notable performance of 76% accuracy in emotion classification tasks. This research contributes to the growing body of literature exploring the intersection of physiological signals and deep learning techniques for affective computing applications.
Emotion Recognition, ECG Signals, Transformers, Tokenization, DistilBERT Model
Short address: https://sciup.org/15019608
IDR: 15019608 | DOI: 10.5815/ijmecs.2024.06.03
Text of the scientific article Emotion Classification Utilizing Transformer Models with ECG Signal Data
In the realm of affective computing, the quest to comprehend human emotions has long been a fascination for researchers and practitioners alike. Emotions, being integral to human experience, manifest in various forms and intensities, shaping our interactions, decisions, and well-being. Among the myriad avenues explored in emotion detection, the fusion of physiological signals and machine learning stands out as a promising frontier. Electrocardiography (ECG) signals[1], reflecting the cardiac activity of an individual, offer a rich source of physiological data for probing emotional states. Leveraging the advancements in deep learning, particularly Transformer models, presents a compelling approach to discerning nuanced emotional patterns from ECG data.
The utilization of Transformer models[2,3], originally popularized in natural language processing tasks, has witnessed a burgeoning interest across diverse domains due to their efficacy in capturing long-range dependencies and contextual information. Emotion recognition using physiological signals, particularly electrocardiograms (ECG)[4], involves analyzing heart activity to determine an individual's emotional state. ECG measures the electrical activity of the heart, providing data on heart rate variability (HRV), which is influenced by the autonomic nervous system's response to emotional stimuli. By examining patterns in HRV, such as changes in heart rate and the balance between sympathetic and parasympathetic nervous system activities, researchers can infer emotional states like stress, anxiety, happiness, or calmness.
Transformers excel in emotion classification due to their self-attention mechanism[5], which allows them to weigh the importance of different parts of the input sequence, thus capturing complex interdependencies within ECG data. Unlike traditional recurrent neural networks (RNNs) or convolutional neural networks (CNNs), Transformers do not suffer from vanishing gradient issues and can process entire sequences simultaneously rather than sequentially. This enables the model to maintain a holistic understanding of the input data, making it particularly effective for identifying temporal patterns associated with different emotional states. Additionally, the scalability of Transformers allows them to be fine-tuned on specific emotion recognition tasks, thereby enhancing their performance and making them adaptable to various datasets and conditions. These advantages make Transformer models[6] a powerful tool for advancing the field of emotion classification using physiological signals.
Furthermore, the integration of Transformer models with ECG signal processing heralds a paradigm shift in the landscape of affective computing. Potential applications include developing systems that can monitor patients' emotional states continuously and alert healthcare providers to potential issues, enabling proactive management of mental health, Improve the effectiveness of educational tools by adapting the content and teaching strategies according to the learner's emotional engagement and stress levels. Integrating emotion classification systems into smart home devices to provide personalized experiences, such as adjusting lighting, music, or temperature based on the user's mood.
In this paper, we elucidate the theoretical underpinnings of our proposed methodology, delineating the intricacies of Transformer-based emotion classification with ECG signal data. We delve into the architectural nuances of Transformer models, elucidating their efficacy in capturing temporal dynamics and contextual dependencies inherent in ECG waveforms. Subsequently, we expound upon the preprocessing steps and feature extraction techniques tailored for ECG data, ensuring compatibility with Transformer architectures[7]. Through empirical evaluations and comparative analyses, we demonstrate the efficacy and robustness of our approach across diverse emotional contexts, underscoring its potential for real-world applications in healthcare, affective computing, and beyond.
2. Literature Review
Nita, Sihem, et al. [8] In this study, a novel convolutional neural network (CNN) architecture is introduced for human emotion recognition based on electrocardiogram (ECG) signals, utilizing the DREAMER dataset. The proposed approach focuses on augmenting the ECG dataset by generating a substantial number of diverse ECG samples through a randomized, concatenated, and resampled process, mimicking realistic ECG episodes. Subsequently, a seven-layer CNN classifier is proposed to detect human emotions in terms of valence, arousal, and dominance levels. Experimental results conducted on the DREAMER database using the proposed data augmentation strategy demonstrate promising accuracy rates of 95.16% for valence detection, 85.56% for arousal detection, and 77.54% for dominance detection. The CNN classifier exhibits superior performance across all emotion dimensions. However, training CNN models for emotion detection using ECG signals necessitates a considerable amount of ECG data.
Cui, Lei, et al.[9]The authors discussed the use of Emotion recognition through wearable devices utilizing ECG signal capture. They proposed a deep convolutional neural network equipped with attentional mechanisms, notably the Convolutional Block Attention Module (CBAM), to address individual differences in emotion recognition tasks. CBAM integrates channel attention and spatial attention to enrich the representation of ECG features from various channels and regions, respectively. Results demonstrated superior performance compared to conventional methods. In the realm of ECG-based emotion recognition, channel attention in CBAM allocates weights to different ECG feature channels, while spatial attention assigns weights to different regions within each channel. Leveraging publicly available datasets (WESAD, DREAMER, and ASCERTAIN), the study achieved state-of-the-art results in both multi-class and two-category classification tasks. By incorporating attention mechanisms in channel and spatial dimensions, the model can effectively emphasize relevant features, potentially enhancing classification accuracy. However, the utilization of deep convolutional neural networks with attention mechanisms and large convolutional kernels may entail higher computational demands, which could limit their applicability in real-time or resource-constrained scenarios.
Habib, AKM Ahasan, et al.[10] This study presents a unimodal emotion classifier system utilizing electrocardiogram (ECG) signals, acquired through a capacitive sensor-based non-contact ECG belt system. The research outlines the application of this system to capture emotional responses across various age groups. Machine learning classifiers, specifically Support Vector Machine (SVM) and Random Forest (RF), were trained and evaluated using 10-fold cross-validation on three distinct sets of ECG data collected from 45 subjects, with 15 subjects per age group. The ECG signals underwent preprocessing, and ten features were extracted from each sample interval. The developed SVM and RF classifiers exhibited high classification accuracy, indicating the potential of ECG signals for rapid and reliable detection of emotional states. The minimum classification accuracies attained were 86.6% for SVM and 98.2% for RF models. By utilizing a non-contact capacitive ECG belt system, the study eliminates the need for conventional ECG electrodes, offering a more comfortable and user-friendly experience. However, the inclusion of only 15 subjects per age group may raise concerns regarding the generalizability of the results due to the relatively small sample size.
Li, Yang, et al. [11] The authors emphasized the significance of emotion detection and the development of systems capable of responding to an individual's emotional state, which can enhance user experiences across various applications. This study enhances the accuracy of emotion recognition from ECG signals by employing wavelet transform for signal analysis. Features extracted from the ECG signal are obtained from the AMIGOS database using a wavelet scattering algorithm, enabling the capture of signal characteristics at different time scales. These features serve as inputs for various classifiers to assess their performance. Results indicate that the proposed feature extraction and classification algorithm achieve an accuracy of 88.8% for valence, 90.2% for arousal, and 95.3% for two-dimensional classification, surpassing previous studies' performance. This algorithm holds promise for emotion classification using wearable devices. The wavelet scattering algorithm enables simultaneous analysis of the ECG signal across different temporal scales and in both time and frequency domains. However, the method's validation was limited to classifying emotions in two dimensions only.
3. Methodology
3.1 Proposed Model
Reda, Haftu Tasew, et al.[12] The authors introduces a novel emotion detection algorithm that leverages newly generated time-series data from the Poincaré map of RR, QT, and ST intervals, alongside a genetic algorithm feature selection method and p-value criteria feature reduction. The algorithm employs MLP, KNN, and sum classifiers to discriminate between high/low arousal, positive/negative valence, and stress/non-stress states using only ECG signals from the MOHNOB-HCI and WESAD datasets. Results indicate the superior performance of the extracted time-series data from the Poincaré map of RR, QT, and ST intervals compared to traditional ECG and HRV signals. The study demonstrates the effectiveness of SVM classifier in minimizing experimental error and improving machine learning generalization, albeit at the cost of complex and time-consuming computational requirements.
Ashrafuzzaman, Mohammad, et al.[13] This review encompasses recent research and applications of emotion recognition and assessment based on individual EEG, EDA, ECG, and EMG signals, both individually and in combination. These psychological signals find utility in various applications, including CAD activity monitoring, cognitive assessment, driving stress detection, and evaluation of driver mentality. While EEG is commonly utilized independently, EDA and ECG are frequently employed in multimodal scenarios, with pulse wave signals less commonly utilized. Machine learning and deep learning techniques are commonly applied for emotion recognition and classification across diverse fields. However, psychological signals possess unique properties, such as temporal and spatial dimensions, necessitating the exploration of more suitable approaches for emotion recognition. Notably, an experiment involving 150 participants yielded an accuracy of 91.8% through an application integrating ECG, EMG, respiration, and skin temperature data. Establishing models and systems capable of meeting user needs often requires a diverse array of physiological signals.
Han, Yinghua, et al.[14] The paper discusses a novel approach for classifying emotions based on physiological signals, particularly ECG and GSR data, using Continuous Wavelet Transform (CWT) and deep learning techniques. The study focuses on utilizing Russell's two-dimensional circumplex model to classify emotions based on valence and arousal. ECG signals were recorded using the Shimmer 2R5 platform, while GSR recordings were obtained from participants watching short videos. The signals were processed using CWT to generate scalograms, which were then converted into images for classification using Convolutional Neural Network (CNN) models. The research aims to enhance emotion classification accuracy and explores group emotion elicitation scenarios. Overall, the study contributes to the field of human-computer interaction based on emotional intelligence.
Hegazy, Hanem I., et al.[15] The paper focuses on objectively measuring pain by analyzing electrocardiogram (ECG) responses under neutral and fear emotional contexts. Pain classification achieved up to 97.4% balanced accuracy using combined emotional data and up to 97.7% using an emotionally independent approach. Participant-independent pain classification reached a balanced accuracy of up to 94.9%, employing a leave-one-out cross-validation strategy. Random Forest outperformed other models. The findings indicate The potential for recognizing pain via ECG responses despite varying emotional contexts and autonomic nervous system perturbations. Achieving high balanced accuracy rates (up to 97.7%) in classifying pain under different emotional contexts. Understanding ECG features in pain classification is limited, hindering translation and clinical comprehension of findings. While our model's accuracy is slightly lower, it benefits from the Transformer's ability to capture long-range dependencies and contextual nuances within the ECG signal data, offering a robust alternative to CNN-based approaches.
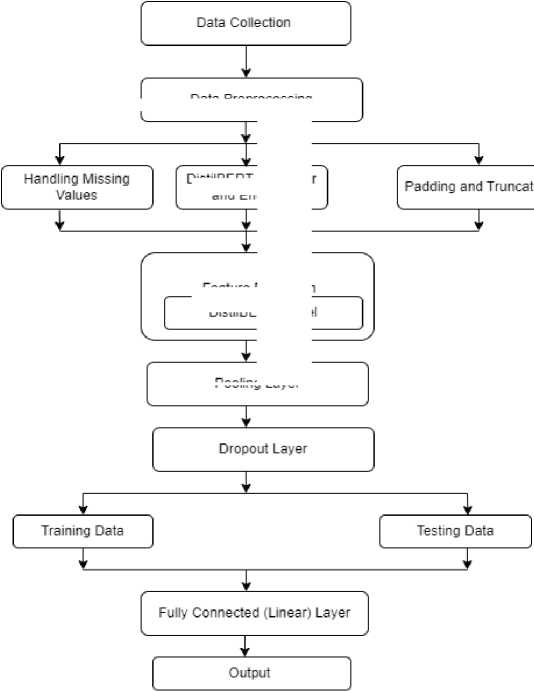
The first stage is gathering data. Apply preprocessing techniques to the data that was obtained. Categorical values are transformed into numerical values via label encoding. The text data is tokenized and encoded[16] using the DistilBERT tokenizer. This tokenizer converts the input text into tokens, which are numerical representations suitable for feeding into the neural network. The required features are obtained using recursive feature elimination. Divide the data into training and testing data after using the feature extraction technique. Utilise training data to develop the DistilBERT model[17]. Utilise testing data to evaluate the model’s performance after it has been trained. after which you should deploy the model.
Data Preprocessing
DistilBERT Tokenizer and Encoder
Feature Extraction
DistilBERT Model
Pooling Layer
Fig. 1. Flow Diagram of Proposed Model
Figure 1 describes the flow of steps takes place in classification of emotions initializing from data collection, Handling Missing Values, Tokenization and Encoding , Padding and Truncation for data preprocessing, DistilBERT Model for feature extraction, pooling layer is then applied to these embeddings to aggregate them into a fixed-size representation for the entire input sequence, the dropout layer serves as a regularization method employed to mitigate overfitting, and then data is splitted into training and testing. Fully Connected (Linear) Layer is used for classification of emotions and the logits are the final output of the model, representing the model's predictions for each input sequence. These logits can be converted to probabilities using a softmax function, and the class with the highest score can be selected as the predicted label.
-
3.2 Data Collection
Source of Dataset:
The data is collected from the Dataset named “Young Adult's Affective Data (YAAD) Using ECG and GSR Signals”.
Description:
The dataset comprises three components: raw data, extracted ECG features, and self-annotation labels. Raw data includes both multimodal and single modal data in .mat format. Multimodal data encompasses ECG and GSR recordings for 12 participants, along with 21 stimulus videos divided into three sessions. Similarly, single modal data consists of ECG recordings from an additional 13 participants. These physiological signals correspond to six basic emotions (surprise, anger, fear, happiness, sadness, disgust) along with a neutral state. Participants performed selfannotation for these emotional states and provided scores for valence, arousal, and dominance. Seven emotion-related features were extracted from each ECG sample and are available as supplementary material for further analysis.
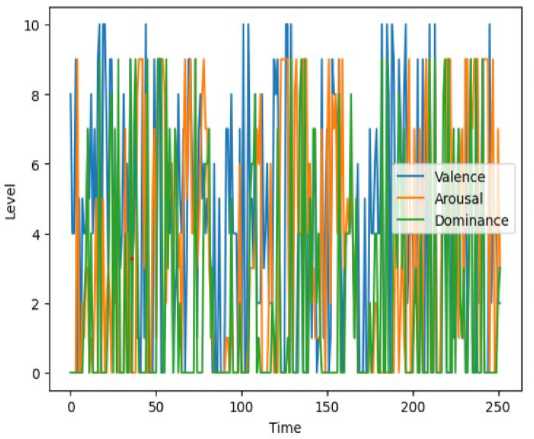
Fig. 2. Line chart of valence, arousal, and dominance over time
The graph in fig. 2 represents three variables—Valence, Arousal, and Dominance—measured over time.
-
• Valence : Typically indicates the emotional value associated with a stimulus, with higher values representing
more positive emotions.
-
• Arousal : Reflects the level of alertness or stimulation caused by a stimulus, where higher values suggest
greater excitement or activity.
-
• Dominance : Often relates to the degree of control or influence one feels in a situation, with higher values indicating a stronger sense of control.
-
3.3 Data Preprocessing
Each variable is tracked on a scale from 0 to 10 and plotted against time, which extends from 0 to 250 units. The bars’ heights at each time point reflect the level of each variable, with blue for Valence, green for Arousal, and orange for Dominance. This type of graph is useful for observing how emotional responses or perceptions change over a period.
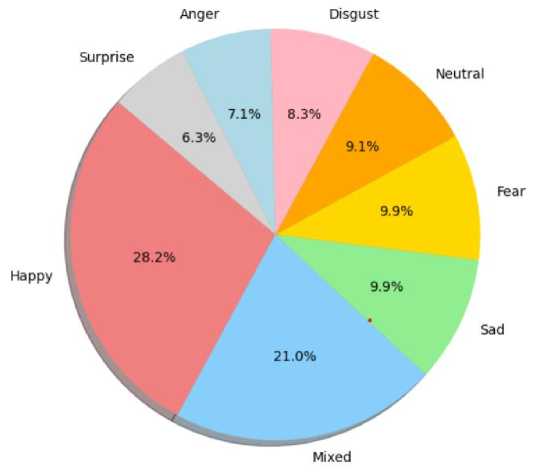
Fig. 3. A Pie Chart Analysis of Varied Emotions
Fig. 3 describes the pie chart that represents the distribution of various emotions with corresponding percentages. Each emotion is color-coded, making it easy to distinguish between them. The ‘Happy’ section is the largest at 28.2%, colored in red, followed by ‘Mixed’ emotions at 21.0% in blue. Other emotions like ‘Sad’, ‘Fear’, and ‘Disgust’ each constitute 9.9% and are colored in green, yellow, and orange respectively. ‘Anger’ takes up 7.1% of the chart in pink, ‘Surprise’ is at 6.3% in grey, and the smallest section is ‘Neutral’ at 8.3%, colored in light blue.
Data preprocessing is a fundamental and integral phase in the data analysis and machine learning workflow, focusing on refining raw datasets for optimal utilization in modeling and analysis. A key aspect of this process involves data cleaning, where techniques are employed to handle missing values and identify and address outliers that could potentially distort analytical results.
-
a. Tokenization and encoding
Tokenization and encoding are critical steps in transforming the raw text data into a format suitable for input into the DistilBERT model. Tokenization involves splitting the text into smaller units called tokens, which are typically words or subwords, using the DistilBERT tokenizer[18]. This step converts the textual data into a list of tokens that the model can understand. Encoding follows tokenization, where these tokens are mapped to their corresponding numerical IDs as defined in DistilBERT's vocabulary. Additionally, the encoding process handles padding and truncation to ensure all input sequences are of uniform length, as required by the model. The `tokenizer` method returns these token IDs along with attention masks, which indicate the actual tokens versus the padding tokens. The attention masks are essential for the model to differentiate between meaningful tokens and padding during processing. By converting the raw text into token IDs and attention masks, tokenization and encoding bridge the gap between human-readable text and the numerical input that the DistilBERT model requires for training and inference.
-
b. Padding and Truncation
-
3.4 Feature Extraction
Padding and truncation are essential steps in preprocessing the text data to ensure it conforms to the fixed input size required by the DistilBERT model. The tokenizer converts the text into token IDs and manages the length of the sequences. Since input sequences can vary in length, padding and truncation standardize them to a consistent length, specified by max_length, which is set to 128 in this case. Padding adds special [PAD] tokens to shorter sequences until they reach the maximum length, ensuring uniformity across the batch. Truncation, on the other hand, shortens sequences that exceed the maximum length by discarding the tokens beyond this limit. These processes are crucial for efficient batch processing and to ensure the model operates correctly, as DistilBERT and other transformer models require inputs of the same length. By managing the input sequence lengths, padding and truncation facilitate the efficient and effective training and evaluation of the model.
DistilBERT, a type of transformer-based model[19,20], is used as a feature extractor in this process. DistilBERT stands for "Distilled BERT," which means it is a compressed version of BERT that retains most of its performance while reducing its size and computational requirements. It transforms the raw text data into fixed-size feature vectors, which are then fed into a classifier (e.g., a fully connected layer) for emotion prediction. The feature extraction step involves leveraging Utilize the pre-trained language model to acquire contextualized representations of the input text, capturing semantic and syntactic information essential for effective classification.
DistilBERT, created by Hugging Face, is a condensed iteration of the BERT (Bidirectional Encoder Representations from Transformers) model. It aims to provide a smaller, faster, and more memory-efficient version of BERT while retaining most of its performance. Here's an overview of the pretrained DistilBERT model:
-
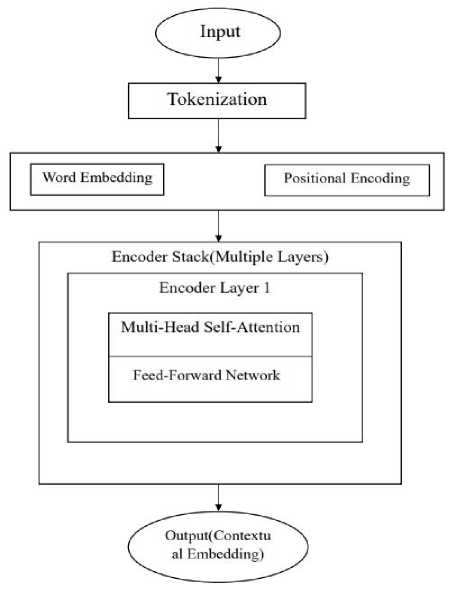
1. Architecture : DistilBERT follows the same Transformer-based architecture as BERT, consisting of multiple layers of encoder blocks. However, it employs a simplified version of BERT's architecture by reducing the quantity of layers, hidden units, and attention heads.
Fig. 4 represents the architecture of DistilBERT model which involves the following steps:
-
i. Input: The input to DistilBERT is tokenized text, which is typically represented as a sequence of word or subword tokens.
-
ii. Tokenization: The input text is tokenized into word or subword tokens using the DistilBERT tokenizer.
-
iii. Word Embedding + Positional Encoding: Each token is embedded into a high-dimensional vector space, and
positional encodings are added to account for the order of tokens in the sequence.
-
iv. Encoder Stack: The core of the DistilBERT architecture comprises numerous stacked encoder layers. Each encoder layer contains the following sublayers:
-
a. Multi-Head Self-Attention: This mechanism enables each token to attend to other tokens in the input sequence, capturing contextual relationships.
-
b. Feed-Forward Network: This sublayer applies a simple fully connected feed-forward neural network to each token's representation independently.
-
v. Output: The output of the encoder stack is a set of contextualized embeddings for each token in the input sequence. These embeddings encapsulate the contextual information regarding of each token based on its surrounding tokens.
-
2. Distillation Process: The DistilBERT model is trained using a process called knowledge distillation. This process entails training a compact model (DistilBERT) to emulate the functionality of a larger, more intricate model (BERT). The training objective includes not only minimizing the traditional cross-entropy loss but also minimizing the difference between the predictions of the two models.
-
3.5 Pooling Layer
-
3.6 Dropout Layer
-
3.7 Fully Connected(Linear) Layer
Fig. 4. Architecture of DistilBERT Model
In the proposed architecture, the pooling layer[21] follows the DistilBERT model's output. Its main purpose is to condense the information extracted from the input text sequences into a fixed-length representation that can be easily processed by subsequent layers. Pooling is implicitly performed using the hidden state of the [CLS] token from the DistilBERT model. It takes the representation of the first token ([CLS]) from the last layer's hidden states produced by the DistilBERT model. The output given by this pooling mechanism is a single, fixed-size vector that encapsulates the aggregate information of the entire input sequence. This selected representation is then passed through a dropout layer for regularization.
The Dropout layer[22] is a regularization technique frequently employed in neural networks to mitigate overfitting and enhance the model's generalization capability. During the training phase, it functions by randomly deactivating a portion of input units, setting them to zero, effectively "dropping out" some neurons. After extracting the representation of the first token ([CLS]) from the last hidden states of the DistilBERT model, this representation is passed through a dropout layer before being fed into the fully connected (linear) layer for classification. The dropout layer, defined with a dropout rate of 0.1, randomly sets 10% of the elements in the input tensor to zero during each training iteration. This stochastic process helps in preventing the model from relying too heavily on any individual neurons, thus encouraging it to learn more robust and generalized features. By introducing this regularization technique, the model is less likely to overfit the training data and can generalize better to unseen data, ultimately improving its performance on the test set.
The fully connected (or linear) layer is commonly referred to as the output layer when it is the last layer of a neural network, particularly in classification tasks. In a fully connected layer[23,25], each neuron or node it is linked to every neuron in the preceding layer, creating a dense network of connections. The input to the fully connected layer is the pooled output from the DistilBERT model. This pooled output is derived from the last hidden state of the first token of the sequence, which is intended to capture the aggregated information from the entire sequence. This output is passed through a dropout layer for regularization before being fed into the fully connected layer. It then processes this input by applying a linear transformation, which projects the high-dimensional input into a lower-dimensional space with a size equal to the number of classes. The output from the fully connected layer, referred to as ‘logits’, is a set of raw scores corresponding to each class label. During training, the logits are passed directly to the cross-entropy loss function, which internally applies the softmax operation to convert these scores into probabilities and computes the loss against the true labels. During evaluation, the model uses these logits to determine the predicted class by selecting the class with the highest logit score for each input in the batch.
The loss function and optimizer are crucial components in training a neural network model.
-
1) Loss Function (CrossEntropyLoss):
-
• The loss function measures the difference between the model's predicted output and the actual desired target labels.
-
• The formula for the Cross-Entropy Loss function, also known as Logarithmic Loss or Negative Log Likelihood, is typically defined as:
CrossEntropyLoss(y,ŷ)=- i ∑ L [ yt (log(̂ i ))+(1- yt )log(1 - ̂ i )] (1)
Equation-(1) y is the ground truth label (typically represented as a one-hot encoded vector for multi-class classification). ŷ is the predicted probability distribution over the classes and N is the number of samples in the dataset.
-
• Cross-EntropyLoss is commonly employed for tasks involving multi-class classification like the above proposed model.
-
• It computes the negative log likelihood loss between the predicted probability distribution and the true probability distribution of the classes.
-
• By optimizing this loss function, the model learns to produce probability distributions that are closer to the ground truth labels.
-
2) Optimizer (Adam):
-
• The optimizer is responsible for updating the parameters of the model (e.g., weights and biases) during training to minimize the loss function.
-
• Adam is a popular optimization algorithm that combines ideas from adaptive methods and momentum-based methods.
-
• Adam optimizer[24] updates the weights of the neural network parameters using the following formulas:
mt = .( mt-l )+(1-Л). gt (2)
Vt = .( vt-l )+(1- ^2 ). 9t (3)
mt
̂ •£ =
Л Vt
̂ £ =
6t+l = - √̂ ^ (̂ •£)
Equation- (2),(3),(4),(5),(6) represents
-
• Where m t and vt are the first and second moment estimates (mean and uncentered variance) of the gradients, respectively.
-
• gt represents the gradient of the loss function with respect to the parameters at time step ‘t’.
-
• β1 and β2 are the decay rates for the first and second moment estimates, typically set to 0.90. and 0.999, respectively.
-
• ̂ ^t and ̂f are bias-corrected estimates of the first and second moments, respectively.
-
• *1 is the learning rate.
-
• 6 is a small constant added to the denominator for numerical stability.
-
• ^t+ 1 are the updated parameters at time step ‘t+1’.
The above formulas outline the adaptive learning rate method of the Adam optimizer, which efficiently adjusts the learning rates for each parameter based on the estimated moments of the gradients.
• It maintains adaptive learning rates for each parameter, allowing different parameters to update at different rates based on the magnitude of their gradients.
• Adam also uses momentum, which helps accelerate the convergence of the optimization process by accumulating past gradients.
4. Experimental Work
4.1 Correlation Matrix0.291-0.471 0.296 0.193 0.260 0.095 0.255 0.109 0.101-0.857 0.035-0.740
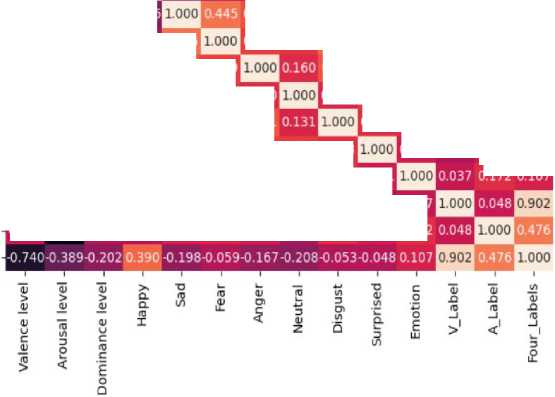
A correlation matrix is a square matrix that exhibits the correlation coefficients between pairs of variables within a dataset. Each cell in the matrix represents the correlation coefficient between two variables, with values spanning from -1 to 1.
Valence level -1.000
-0.041
Arousal level
-0.041
1.000
0.130 0.054 -0.164-0.183-0.116 0.043 -0.166-0.066-0.158-0.007-0 884-0.389
Dominance level
Happy
0.291 0.130
0.082 -0.078 0.107 -0.171 0.102 -0.189 0.158 -0.207-0.047-0.202
0.148-0.065 0.459 -0.033 0.390
-0.4710.054-0.
-0.276-0.146-0.174-0.02 5-0.220
0.296 0.164 0.082-0.276
0.314 0.160
0.403
0.221-0.004-0.2 78 0.108-0.198
0.239 0.211
0.405
0.22 6 0.163-0.134 0.138-0.059
0.331 0.239
0.072 -0.233 0.089-0.167
0.131
0.239
-0.208-0,187-0.101-0.208
0.178 0.172 -0.143 0.168-0.05 3
0.081-0.088 0.069-0.048
0.172 0.107
Sad
Fear
Anger
Neutral
Disgust
Surprised
Emotion
V Label
A Label
Four Labels
0.193 -0.183-0.078-0.146 0.445
0.260 -0.116 0.107 -0.174 0.314 0.239
0.095 0.043-0,171-0.025 0.160 0.211 0.160
0.255 -0 166 0.102-0.220 0.403 0.405 0.331
0.109-0.066-0.189 0.148 0.221 0.226 0.239 0.239 0.178
0.101-0.158 0.158-0.065-0.004 0.163 0.072 -0.208 0.172 0.081
-0.857-0.007-0.207 0 459 -0.278-0.134-0.233-0.187-0.143-0.088 0.037

- 1.00
-0.75
-0.50
-0.25
- 0.00
- -0.25
- -0.50
■ -0.75
Fig. 5. Correlation Matrix of the Proposed Model
In Fig. 5 it describes the correlation matrix of the proposed model. The numerical values in the heatmap range from -1.00 to 1.00, with:
-
i. indicating a perfect positive correlation (as one variable increases, so does the other).
-
ii. -1.00 indicating a perfect negative correlation (as one variable increases, the other decreases).
-
iii. Values close to 0 indicating no correlation.
-
4.2 AUC-ROC Curve
The colours correspond to these values, with darker reds indicating higher positive correlations and darker purples indicating higher negative correlations. The diagonal, which shows a correlation of 1.00 for each variable with itself, is expectedly dark red. Each cell represents the correlation between the emotional states indicated by the row and column. For example, a cell intersecting the row for “Valence level” and the column for “Happy” would show how the valence level (overall positivity or negativity of an emotion) correlates with the frequency or intensity of happiness.
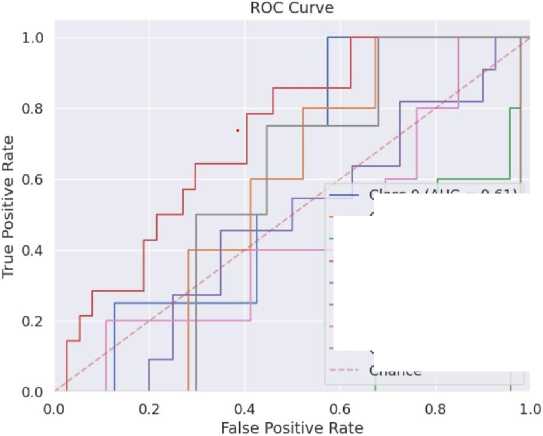
Fig. 6 represents the AUC-ROC Curve of the proposed model. The graph depicting the Receiver Operating Characteristic (ROC) Curve for multiple classes from 0 to 7 which represents the classes of emotions.
-
• ROC Curve : It’s used to evaluate the effectiveness of a classification model by plotting the true positive rate (TPR) against the false positive rate (FPR) at various threshold settings.
-
• AUC Values : The Area Under the Curve (AUC) indicates the model's capacity to differentiate between classes. Higher AUC values mean better model performance.
-
• Class Performance : Each class is represented by a different colored line with its AUC value. Class 0 has an AUC of 0.95, indicating a fair ability to distinguish it from other classes.
-
4.3 Confusion Matrix
Class 0 (AUC = 0.61)
Class 1 (AUC = 0.57)
- Class 2 (AUC = 0.16) --- Class 3 (AUC = 0.72) --- Class 4 (AUC = 0.47) --- Class 5 (AUC = 0.03)
Class 6 (AUC = 0.43)
Class 7 (AUC = 0.57) Chance
Fig. 6. AUC-ROC Curve
Fig. 7 shows the DistilBERT Model confusion matrix when used on the test data. Each cell in the matrix represents the number of instances where the corresponding true label (Y-axis) was classified as the predicted label (X-axis). The intensity of the color indicates the count of instances. Darker colors represent higher counts, while lighter colors represent lower counts.
• True Label (Y-axis): The actual labels from the test dataset.
• Predicted Label (X-axis): The labels predicted by the model.
• Numbers in the cells are the actual counts of instances for each pair of true and predicted labels.
5. Result and Discussion
This section describes the result
of DistilBERT Model Transformer using precision, recall, f1-score, support.
The confusion matrix shows that the model has varying performance across different classes. Class 3 has the highest correct predictions (12 times). Class 6 shows some confusion with class 4 and class 6 itself. Misclassifications are highlighted in cells that are off the diagonal. The confusion matrix presented provides a comprehensive overview of the classification performance of a DistilBERT model on a multi-class classification task.
Confusion Matrix
|
o - |
3 |
0 |
0 0 |
0 0 |
1 2 |
0 0 |
0 0 |
0 0 |
- - 10 |
||
|
r^ “ |
0 |
3 |
|||||||||
|
|
0 |
0 |
4 |
0 |
1 |
0 |
0 |
0 |
- 8 |
||
|
(D ru |
m - |
0 |
0 |
0 |
12 |
2 |
0 |
0 |
0 |
-6 |
|
|
- |
- |
1 |
0 |
0 |
0 |
10 |
0 |
0 |
0 |
||
|
tn - |
0 |
0 |
0 |
0 |
0 |
3 |
0 |
0 |
- 4 |
||
|
Ю “ |
0 |
0 |
0 |
0 |
3 |
0 |
2 |
0 |
-2 |
||
|
- |
0 0 |
0 1 |
0 2 |
0 1 3 4 Predicted Label |
1 5 |
0 6 |
2 7 |
- 0 |
|||
Fig. 7. Confusion Matrix of Proposed Model
Table 1. Classification Report of DistilBERT Model for Different Emotion Classes
|
Emotion Class |
Precision |
Recall |
F1-score |
Support |
|
Class 0 (Anger) |
0.75 |
0.75 |
0.75 |
4 |
|
Class 1 (Disgust) |
1.00 |
0.60 |
0.75 |
5 |
|
Class 2 (Happy) |
1.00 |
0.80 |
0.89 |
5 |
|
Class 3 (Fear) |
1.00 |
0.86 |
0.92 |
14 |
|
Class 4 (Neutral) |
0.50 |
0.91 |
0.65 |
11 |
|
Class 5 (Surprised) |
0.75 |
1.00 |
0.86 |
3 |
|
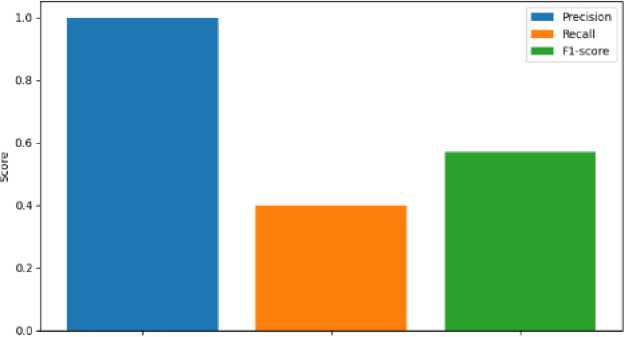
Class 6 (Sad) |
1.00 |
0.40 |
0.57 |
5 |
|
Class 7 (Mixed) |
1.00 |
0.50 |
0.67 |
4 |
Table 2. Macro avg and Weighted avg of the Proposed Model
|
Precision |
Recall |
F1-score |
Support |
|
|
Macro avg |
0.88 |
0.73 |
0.76 |
51 |
|
Weighted avg |
0.86 |
0.76 |
0.77 |
51 |
Table. 1 represents classification report .This represents a classification report from a machine learning model, showing performance metrics for each class (0-7).where these classes represents the different emotions. Table. 2 represents the macro-average and weighted average.
-
• Precision : Indicates the precision of positive predictions for each class.
-
• Recall : Measures the ability of the model to find all the relevant cases within a class.
-
• F1-Score : Combines precision and recall into a single metric that balances both.
-
• Support : The number of actual occurrences of the class in the dataset.
-
• Macro-average: Calculates the average AUC score across all classes without considering class imbalance.
-
• Weighted-average: Aggregates the contributions of all classes equally, which is suitable for imbalanced datasets.
For example, Class 1 has a precision of 1.00, meaning all predictions for this class were correct, but a recall of 0.60, indicating that the model missed 40% of actual Class 1 instances. The f1-score of 0.75 for Class 1 is the harmonic mean of precision and recall, reflecting both metrics. The model's overall accuracy stands at 0.76, indicating it accurately predicted 76% of all classes. The macro average assigns equal importance to each class, whereas the weighted average considers the support of each class. These averages offer insight into the model's overall performance across all classes.
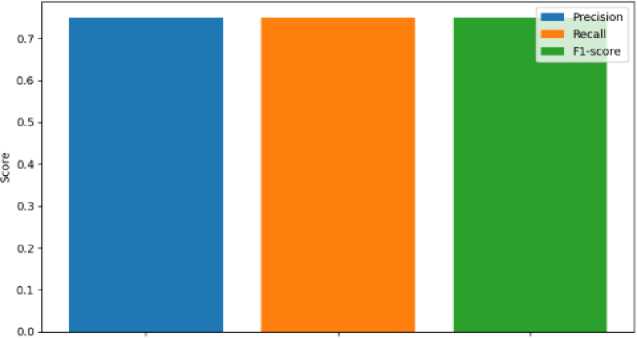
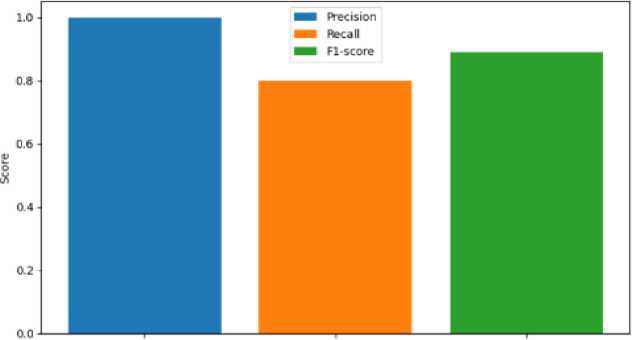
The following figures represents the precision, recall, f1-score of each Emotions separately.
Class ■ Anger
Precision Recall Fl-score
Metric
Fig. 8. Metric Representation of Anger
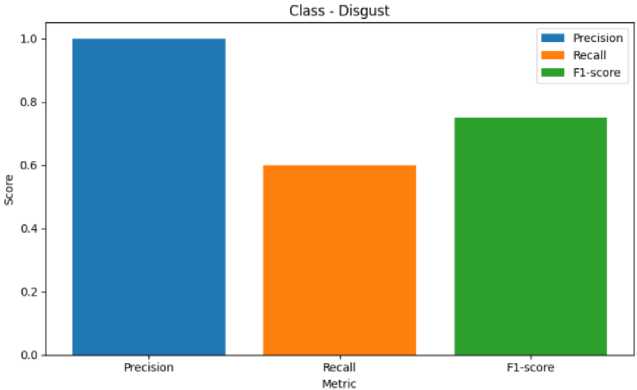
Fig. 9. Metric Representation of Disgust
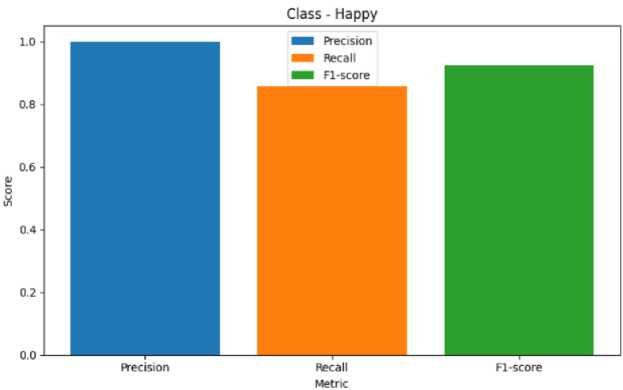
Fig. 10. Metric Representation of Happy
Class ■ Fear
Precision Recall Fl-score
Metric
Fig. 11. Metric Representation of Fear
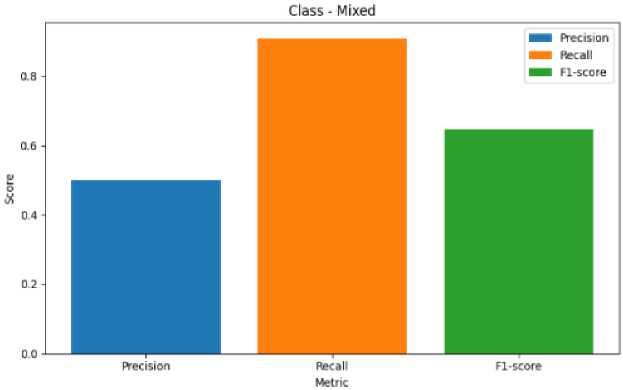
Fig. 12. Metric Representation of Mixed
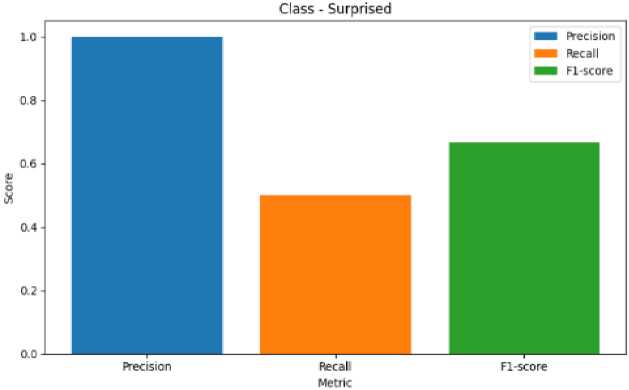
Fig. 13. Metric Representation of Surprised
Class - Sad
Precision Recall Fl-score
Metric
Fig. 14. Metric Representation of Sad
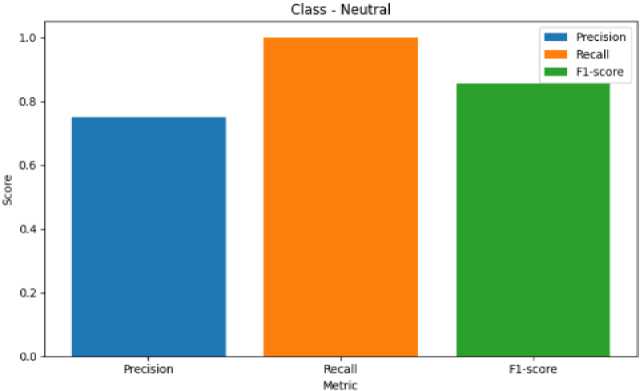
Fig. 15. Metric Representation of Neutral
Fig. 8 represents the precision, recall, F1-score of Anger Emotion. Similarily Fig. 9 represents the metrics of Disgust emotion, Fig. 10 represents the evaluation metric of Happy emotion, Fig. 11 represents the metrics of Fear ,Fig. 12 represents the precision,recall, F1-score of Mixed Emotion,Fig. 13 represents the evaluation metric of Surprised Emotion, Fig. 14 represents the precision,recall, F1-score of Sad Emotion,Fig. 15 represents the precision recall, F1-score of Neutral emotion.
6. Conclusion and Future Work
In the pursuit of advancing emotion classification utilizing Transformer models with ECG signal data, our proposed approach has yielded promising results, achieving an accuracy of 76%. Through a meticulously designed methodology encompassing tokenization, encoding, padding, and truncation for data preprocessing, coupled with the integration of the DistilBERT model for feature extraction, we have demonstrated the efficacy of leveraging deep learning techniques for discerning emotional states from physiological signals. The application of Transformer architectures, renowned for their ability to capture long-range dependencies and contextual information, has empowered our model to distill nuanced emotional patterns embedded within ECG waveforms. By aggregating token embeddings via a pooling layer and incorporating dropout regularization to mitigate overfitting, we have ensured the robustness and generalizability of our emotion classification framework. The utilization of fully connected (linear) layers for classification, culminating in an output layer for interpreting learned features, underscores the translational potential of our approach in real-world applications. While achieving a 76% accuracy signifies a notable advancement in emotion classification, there remain avenues for further enhancement and refinement. Future endeavors may explore ensemble techniques or fine-tuning strategies to bolster model performance and generalize across diverse demographic cohorts or emotional contexts. Additionally, the integration of multimodal data fusion, incorporating complementary physiological signals or contextual information, holds promise for enriching the fidelity and interpretability of emotion detection systems.
References Emotion Classification Utilizing Transformer Models with ECG Signal Data
- Hasnul, Muhammad Anas, Nor Azlina Ab. Aziz, and Azlan Abd. Aziz. "Augmenting ECG data with multiple filters for a better emotion recognition system." Arabian journal for science and engineering 48.8 (2023): 10313-10334.
- Vaswani, Ashish, et al. "Attention is all you need." Advances in neural information processing systems 30 (2017).
- Wei, Yi, et al. "TC-Net: A Transformer Capsule Network for EEG-based emotion recognition." Computers in biology and med-icine 152 (2023): 106463.
- Zheng, Wei, and Bo Pan. "A spatiotemporal symmetrical transformer structure for EEG emotion recognition." Biomedical Signal Processing and Control 87 (2024): 105487.
- Gong, Linlin, et al. "EEG emotion recognition using attention-based convolutional transformer neural network." Biomedical Signal Processing and Control 84 (2023): 104835.
- Ma, Hui, et al. "A Transformer-Based Model With Self-Distillation for Multimodal Emotion Recognition in Conversations." IEEE Transactions on Multimedia (2023).
- Devika, R., et al. "A deep learning model based on BERT and sentence transformer for semantic keyphrase extraction on big social data." IEEE Access 9 (2021): 165252-165261.
- Nita, Sihem, et al. "A new data augmentation convolutional neural network for human emotion recognition based on ECG signals." Biomedical Signal Processing and Control 75 (2022): 103580.
- Fan, Tianqi, et al. "A new deep convolutional neural network incorporating attentional mechanisms for ECG emotion recognition." Computers in Biology and Medicine 159 (2023): 106938.
- "Design and Development of a Non-Contact ECG-Based Human Emotion Recognition System Using SVM and RF Classifiers." Diagnostics 13.12 (2023): 2097.
- Sepúlveda, Axel, et al. "Emotion recognition from ECG signals using wavelet scattering and machine learning." Applied Sciences 11.11 (2021): 4945.
- Baghizadeh, Maryam, et al. "A new emotion detection algorithm using extracted features of the different time-series generated from ST intervals Poincaré map." Biomedical Signal Processing and Control 59 (2020): 101902.
- Lin, Wenqian, and Chao Li. "Review of Studies on Emotion Recognition and Judgment Based on Physiological Signals." Applied Sciences 13.4 (2023): 2573.
- Dessai, Amita, and Hassanali Virani. "Emotion Classification Based on CWT of ECG and GSR Signals Using Various CNN Models." Electronics 12.13 (2023): 2795.
- Silva, Pedro, and Raquel Sebastião. "Using the Electrocardiogram for Pain Classification under Emotional Contexts." Sensors 23.3 (2023): 1443.
- Fang, Ancheng, et al. "ECG-based emotion recognition using random convolutional kernel method." Biomedical Signal Processing and Control 91 (2024): 105907.
- Sanh, Victor, et al. "DistilBERT, a distilled version of BERT: smaller, faster, cheaper and lighter." arXiv preprint arXiv:1910.01108 (2019).
- Diwakar, and Deepa Raj. "DistilBERT-based Text Classification for Automated Diagnosis of Mental Health Conditions." Mi-crobial Data Intelligence and Computational Techniques for Sustainable Computing. Singapore: Springer Nature Singapore, 2024. 93-106.
- Silva Barbon, Rafael, and Ademar Takeo Akabane. "Towards transfer learning techniques—BERT, DistilBERT, BERTimbau, and DistilBERTimbau for automatic text classification from different languages: a case study." Sensors 22.21 (2022): 8184.
- Dogra, Varun, et al. "Analyzing distilbert for sentiment classification of banking financial news." Intelligent Computing and In-novation on Data Science: Proceedings of ICTIDS 2021. Springer Singapore, 2021.
- Bahaa, Ahmed, et al. "DB-CBIL: A DistilBert-Based Transformer Hybrid Model using CNN and BiLSTM for Software Vulner-ability Detection." IEEE Access (2024).
- Liu, Tianrui, et al. "Spam detection and classification based on distilbert deep learning algorithm." Applied Science and Engineering Journal for Advanced Research 3.3 (2024): 6-10.
- Ong, Kah Liang, et al. "MaxMViT-MLP: Multiaxis and Multiscale Vision Transformers Fusion Network for Speech Emotion Recognition." IEEE Access (2024).
- Putri, Farica Perdana. "DistilBERT with Adam Optimizer Tuning for Text-based Emotion Detection." IJNMT (International Journal of New Media Technology) 10.1 (2023): 30-34.
- Wagner, Johannes, et al. "Dawn of the transformer era in speech emotion recognition: closing the valence gap." IEEE Transactions on Pattern Analysis and Machine Intelligence (2023).
