Emotion recognition method using entropy analysis of EEG signals

Author: Seyyed Abed Hosseini, Mohammad Bagher Naghibi-Sistani
Journal: International Journal of Image, Graphics and Signal Processing(IJIGSP) @ijigsp
Article in issue: 5 vol.3, 2011.
Free access
This paper proposes an emotion recognition system using EEG signals, therefore a new approach to emotion state analysis by approximate (ApEn) and wavelet entropy (WE) is described. We have used EEG signals recorded during emotion in five channels (FP1, FP2, T3, T4 and Pz), under pictures induction environment (calm-neutral and negative excited) for participants. After a brief introduction to the concept, the ApEn and WE were extracted from two different EEG time series. The result showed that, the classification accuracy in two emotion states was 73.25% using the support vector machine (SVM) classifier. The simulations showed that the classification accuracy is good and the proposed methods are effective. During an emotion, the EEG is less complex compared to the normal, indicating reduction in active neuronal process in the brain.
Approximate Entropy, EEG signals, Emotion recognition, Wavelet Entropy.
Short address: https://sciup.org/15012180
IDR: 15012180
Text of the scientific article Emotion recognition method using entropy analysis of EEG signals
Published Online August 2011 in MECS
Emotion assessment has recently attracted the attention of many researchers from different fields. When thinking about emotion recognition system one application that generally comes to mind is the lie detector, but lie detector is just the top of the iceberg and that many more applications can be targeted by research on emotion assessment [1]. Emotions are complex phenomena that play a significant role in the quality of human life. A major problem in understanding emotion is the assessment of the definition of emotions. In fact, even psychologists don’t agree on what is considered an emotion and how many types of emotions exist. Kleinginna gathered and analyzed 92 definitions of emotion from literature present that day. They conclude that Emotion is a complex set of interactions among subjective and objective factors, mediated by neural/hormonal systems, which can: 1. give rise to affective experiences such as feelings of arousal, pleasure/displeasure; 2. generate cognitive processes such as emotionally relevant perceptual effects, appraisals, labeling processes; 3. activate widespread physiological adjustments to the arousing conditions; 4. lead to behavior that is often, but not always, expressive, goal directed, and adaptive [2]. Emotions are part of any natural communication between humans, generally as non-verbal cues. Emotion is psychology condition, which affects the central nervous system. In recognition of emotions, brain activity plays a central role. Emotion plays a major role in motivation, perception, cognition, creativity, attention, learning and decision-making. Brain is a highly complex system and understanding the behavior and dynamic of billions of interconnected neurons from the brain signal, requires different signal processing techniques. The measurement of electrical activity of human brain scalp through electrodes is called as Electroencephalogram (EEG), which is the reflection of brain activity and is widely used in clinical diagnosis and biomedical researches. However, the analysis of the EEG signal and extraction of features from it has been a challenging task due to the complexity and variability.
Regarding applications, emotion assessment can lead to the integration of emotions into human-machine interaction (HCI) systems. A lot of research has been undertaken in assessment of emotion and stress over the last years. In other related studies, different emotion recognition systems based on brain signals [1-6] and the application of entropy in biosignal processing have already been studied [7-9].
The layout of the paper is as follows: Section II presents briefly the data acquisition protocol and preprocessing. Section III presents the features extracted from the entropy parameters and the classification system. The results are covered in section IV. Finally, our conclusions based on our results are discussed in section V.
-
II. Data Acquisition and Pre-processing
A. Data Acquisition
The first step towards emotion recognition is the recording of emotional data. Every standard test in emotion and stress states assessment has its own advantages and disadvantages [4]. Most experiments that measure emotion from EEG signals use pictures from the International Affective Picture System (IAPS). The IAPS evaluated by several American participants on two dimensions of nine points each (1-9). The use of IAPS allows better control of emotional stimuli and simplifies the experimental design [2]. In this study, we chose the picture presentation test, base on the closeness of its assessment to our aims. The stimuli to elicit the target emotions (calm-neutral and negatively excited) were some of the pictures.
We have used EEG signals recorded in five channels during emotion sessions in Islamic Azad University Mashhad Branch [3,4]. Fifteen healthy volunteered subjects were right-handed males between the age of 20 and 24 years. Most subjects were students from biomedical engineering department of Islamic Azad University in Mashhad Branch. Each participant was examined by a dichotic listening test to identify the dominant hemisphere [4]. All subjects had normal or corrected vision; none of them had neurological disorders. All participants gave written informed consent. Then each participant was given a particulars questionnaire.
During the pre-test, several questionnaires have been evaluated in order to check the best psychological input to start the protocol phase; this test is State-Trait Anxiety Inventory (STAI). At the end of the experiment, participants were asked to fill in a questionnaire about the experiment and give their opinions. Because, it is possible that the emotion that a participant experiences differs from the expected value. For that reason, the participant is asked to rate his emotion on a selfassessment. Schematics of data acquisition as shown in Fig. 1.
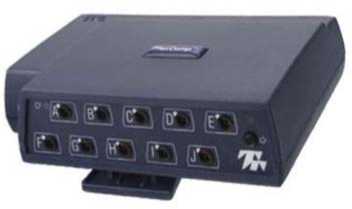
Figure 1. Schematics of EEG acquisition
We used a 10 channel Flexcom Infiniti device, with 14-bit resolution for data acquisition . It is connected to a PC using the USB port. An optical cable connects to device, to prevent any electrical charge from reaching the participant. The Flexcom Infiniti hardware only worked well with the accompanying software. Two programs were available, Biograph Infiniti Acquisition and ezscan. The central activity is monitored by recording EEGs. EEG was recorded using electrodes placed at 5 positions (FP1, FP2, T3, T4 and Pz), as defined by the international 10-20 system (Fig. 2). The sample rate of the EEG signal acquisition was 256 Hz. Each recording lasted about 3 minutes.
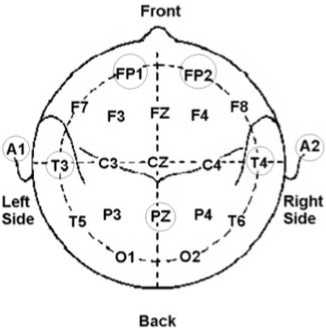
Figure 2. EEG electrode locations
The participant sits in front of a portable computer screen in a bare room relatively, the images to inform him about the specific emotional event he has to think of. Each experiment consists of 8 trials. Each stimulus consists of a block of 4 pictures, which ensures stability of the emotion over time. In addition, each picture is displayed for 3 seconds leading to a total 12 seconds per block. Prior to displaying images, a dark screen with an asterisk in the middle is shown for 10 seconds to separate each trial and to attract the participant’s attention. The detail of each trial is shown in Fig. 3.
Dark Screen with cross
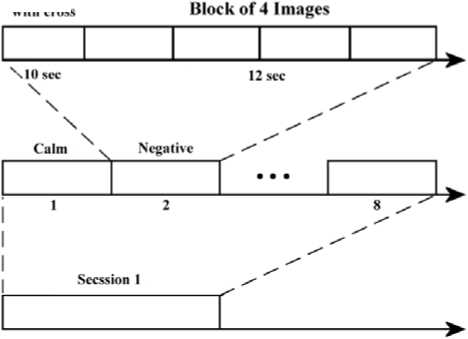
Figure 3. The protocol of data acquisition
This epoch duration was chosen because to avoid participant fatigue. In Fig. 4, each presentation cycle started with a black fixation cross, which was shown for ten seconds. After that pictures were presented for twelve seconds.
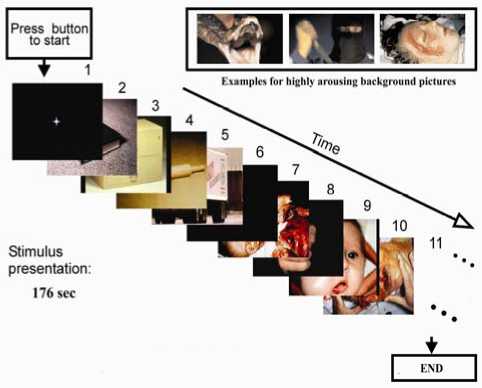
Figure 4. The protocol of data acquisition
B. Pre-processing
Raw EEG data is generally a mixture of several things: brain activity, eye blinks, muscle activity, environmental noise etc. Many noises that are present in the EEG signals can be removed using simple filters. Before analysis, we first remove the data segment, which contains obvious eye blinking. We need to pre-process EEG signals in order to remove environmental noises and drifts. The data was filtered using a band pass filter in the frequency band of 0.2~35 Hz. frequency bands of interest to interpret EEG signals: delta (1-4 Hz), theta (4-8 Hz), alpha (8-13 Hz) and beta (13-30 Hz). The signals were filtered using the “filtfilt” function from the signal processing in MATLAB toolbox, which processes the input signal in both forward and reverse directions.
-
III. Analysis of EEG Signals
Feature extraction is the process of extracting useful information from the signal. In this research, we use a set of feature values for brain signals.
A. Quality aspect
First time, phase space introduced by W. Gibbs in 1901, that in this space all possible states of a system are represented, with each possible state of the system corresponding to one unique point in the phase space. In fact, all these unique points will make direction of trajectory. A sketch of the phase portrait may give qualitative information about the dynamics of the system. The method is based on the operated result numerically in the EEG dynamics system, the phase trajectory portrait is drawn out in the phase space with the time variance, and the course portrait of the state variables is drawn out with the time [10]. The chaotic phenomena and the solution fraction are decided through comparison, analysis and integration. In the phase space, the close curve is corresponding to the periodical motion, while the chaotic motion is corresponding to the ever-non-close trajectory (strange attractor), which diverges randomly in some area, the corresponding figure is as following Fig. 5.
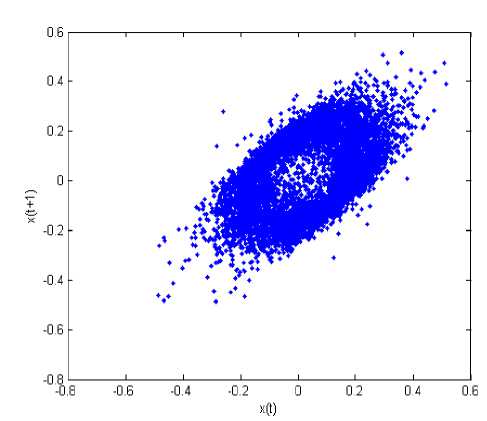
Figure 5. Phase space state portraits for T3 channel in negative emotion state
If a signal is periodical, the curve in the phase space graph is non-close. While a signal is chaotic, the curve in the phase space graph is non-close, and from the above figure, the normal EEG signal is chaotic.
B. Entropy Analysis
Entropy is a thermodynamic quantity describing the amount of disorder in the system. From an information theory perspective, the above concept of entropy is generalized as the amount of information stored in a more general probability distribution. The theory was supported by the contributions of Shannon, Renyi and Kolmogorov. In this study, some related entropy families have been used that are:
• Approximate Entropy
Pincus introduced the first idea of approximate entropy (ApEn) in 1991, and it is a useful complexity measure for biological time series data [9]. ApEn is originated from nonlinear dynamics. ApEn is a statistical instrument initially designed to be applied to finite length and noisy time series data, it is scale invariant and model independent, evaluates both dominant and subordinate patterns in data, and discriminates series for which clear feature recognition is difficult [9]. Notably it detects changes in underlying episodic behavior not reflected in peak occurrences or amplitudes. To understand the concept of ApEn better, we describe the definition step by step as follows: Let the original data be
Xm(i) = {x(i),x(i +1),...,x(i + m -1)} i = 1,2,..., N - m +1 (1)
The quantity is calculated (2).
number of such j that d [ X m ( i ), X m ( j )] < r f
Ci (rf )= ------------------------------------------------------------- f N - m + 1
i * j , j = !,2,-, N — m + 1
Where the distance between the vectors and is defined as (3).
d [ X m ( i ), X m ( j )] = , max (| x ( i + k ) - x ( j + k )|)
k = 1,2,..., m + 1 1 1 (3)
Next, the quantity is calculated as (4).
N - m + 1
^ " ( r f ) =
N - m + 1
I LnC m ( r f )
i = 1
Increase the dimension to m+1. Repeat steps (1)~(4) and find ф ™ + 1 ( r f ) . Finally, the ApEn is defined as (5).
ApEn ( m , r f ) = N im( ф m ( rf ) - Ф ™ + 1( r f )) (5)
In actual operation, the number of data point is limited when the data length is N and the result obtained through the above steps is the estimate of ApEn, which can be denoted as (6)
ApEn ( m , rf , N ) = ф ™ ( rf ) - ф ™ + 1( rf )
Obviously, the value of the estimate depends on m and r f . The parameter r f corresponds to an a priori fixed distance between the neighboring trajectory points; therefore, r f can be viewed as a filtering level and the parameter m is the embedding dimension determining the dimension of the phase space. As suggested by Pincus, r f is chosen according to the signal’s standard deviation (SD) [9]; in this paper we use the values r f =0.2 SD and m =2 with SD taken over the signal segment under consideration.
• Wavelet Entropy
Wavelet entropy (WE), a method of complexity measure for non-stationary signals, was used to investigate the dynamic features of human EEGs under two emotion states. In the following expressions, s is the signal and ( si ) i the coefficients of s in an orthonormal basis.
The entropy E must be an additive cost function such that E (0)=0 and
E ( s ) = I E ( 5 , ) i
The (non normalized) Shannon entropy is defined as
E 1( s ) = - E ^; 2 log( s^
With the convention 0log(0) = 0.
The concentration in |p norm entropy with 1 ≤ p.
E2( s) = Is,Г
E 2( s ) = E I s l ' =1 H I P
The log energy entropy is defined as
E 3( s,) = log( s,2)
E 3( s ) = S log ( s , 2 )
With the convention log(0) = 0.
The threshold entropy is defined as
E 4( s,) J1 H> :so
|0 elsewhere
E 4( s ) = #{i such that |s , |> : }
Is the number of time instants when the signal is greater than a threshold p.
The Stein’s Unbiased Risk Estimate (SURE) entropy is defined as
E 5( s ) = n - # { i such that |s , |< p }
+ ^ min( s 2, p 2 ) (12)
C. Normal zat on
In order to normalize the features in the limits of [0,1], we used (13).
Y norm
''
s s min
''
s max s min
Here Ynorm is the relative amplitude.
D. Class f cat on
After extracting the desired features, we still have to find the related emotion state in the EEG. A classifier is a system that divides some data into different classes, and is able to learn the relationship between the features and the different emotion states. The classifier is a Support Vector Machine (SVM) [11]. Nonlinear support vector machine maps the input space to a high dimensional feature space, and then constructs a linear optimal hyperplane in the feature space, which relates to a nonlinear hyper-plane in the input space. There are several approaches to apply the SVM for multi-class classification [12]. In this study, the one-vs.-all method was implemented. Two SVMs that correspond to each of the two emotions were used. The th SVM was trained with all of the training data in the th class with calm labels, and the other training data with negative labels. In the emotion recognition process, the feature vector was simultaneously fed into all SVMs and the output from each SVM was investigated in the decision logic algorithm to select the best emotion. In the SVM classifier, was used a Gaussian Radial Basis function (RBF) as a kernel function. RBF projects the data to a higher dimension [13]. The L bSVM toolbox was used as an implementation of the SVM algorithms [11].
-
IV. Result
We apply a 512-point window on the pre-processed EEG signal of each channel to calculate the running ApEn and WE. We used around 70% of the data for the training, and 20% of the data for testing whether the learned relationship between the EEG signals and emotion is correct and the last 10% was used for validating the data, because it is important that the training set contain enough instances. On the other hand, it also important that the test set contains enough samples to avoid a noisy estimate of the model performance. This is particularly true in our case since the number of emotional stimulations is limited by the duration of the protocols, which should not be too long to avoid participant fatigue as well as elicitation of undesired emotions. Cross-validation methods help to solve this problem by splitting the data in different training/test sets so that each sample will be used at least once for training and once for testing. The two well-known crossvalidation methods are the k-fold and the leave-one-out. The system was tested using the 4-fold cross-validation method. This method divides the training data into four parts. One of the parts is used for testing the classifier, and the three others are used for training. The process was repeated four times, every time with another part of the data. This method reduces the possibility of deviations in the results due to some special distribution of training and test data, and ensures that the system is tested with different samples from those it has seen for training. By using this method, four accuracies are obtained from the four test sets so that it is possible to compute the average accuracy and its standard deviation. A confusion matrix will also be used to determine how the samples are classified in the different classes. A confusion matrix gives the percentage of samples belonging to class ω and classified as class ω j . The accuracy can be retrieved from the confusion matrix by summing its diagonal elements P , weighted by the prior probability p ( ω ) of occurrence of the class ω . The results are the accuracy of 73.25% for two categories
(calm vs. negative exited), using the EEG signals. As can be seem from the confusion matrices across participants using EEG signals of Table 1.
TABLE I. Average confusion matrices across participants using EEG signals using RBF kernel of SVM
|
Truth |
Classified with SVM |
|
|
Calm-neutral |
Negative excited |
|
|
Calm-neutral |
64% |
36% |
|
Negative excited |
17.5% |
82.5% |
Using a 4-fold cross validation error assessment for training and testing, we reached a 29.6% for the two categories of emotion states using the EEG signals.
-
V. Conclusion
The study shows clear difference in dynamical properties of electrical activity of the brain in subjects, during emotion state. Classically, the electroencephalogram has been the most utilized signal to assess brain function owing to its excellent time resolution. In this research, we propose an approach to classify emotion in the two categories (calm vs. negative exited) by using brain signals. This paper, the application of nonlinear time series analysis to EEG signals offers insight into the dynamical nature and variability of the brain signals. The reason we have chosen the EEG signals over the pure psychophysiological signals is the fact that EEG signals represent behavior directly from their source but the psychophysiological signals are secondary manifestations of the autonomic nervous system in response to emotion. Entropy is defined as a quantitative parameter to character the complexity of EEG in different brain function status. Approximate Entropy and Wavelet entropy are parameters that can give robust estimate from short data and is attractive for dynamic analysis. The results showed that, the classification accuracy was 73.25% for the two categories, using SVM classifier with RBF kernel. The result of approximate and wavelet entropy shows that brain's EEG, ApEn and WE values are a good candidate for characterizing different extents of emotion state [4]. During an emotion, the EEG is less complex compared to the normal, indicating reduction in active neuronal process in the brain. In dealing with EEG classification, an important problem is the huge number of features [14]. Results showed that, the feature reduction leads only to a slight loss of classification accuracy. Reducing the number of features contributes to a significant decrease in computation time for emotion assessment. This decrease is of great interest for systems with low computational capabilities such as ambulatory real-time HCI systems.
References Emotion recognition method using entropy analysis of EEG signals
- G. Chanel, “Emotion assessment for affective computing based on brain and peripheral signals”, Ph.D. Thesis Report, University of Geneve, 2009.
- R. Horlings, “Emotion recognition using brain activity”, Delft University of Technology, Faculty of Electrical Engineering, Mathematics, and Computer Science, Man-Machine Interaction Group, March 2008.
- S.A. Hosseini, M.A. Khalilzadeh, and S. Changiz, “Emotional stress recognition system for affective computing based on bio-signals”, International Journal of Biological Systems (JBS), A Special Issue on Biomedical Engineering and Applied Computing, World Scientific Publishing, Vol. 18, pp. 101-114, October 2010.
- S.A. Hosseini, “Quantification of EEG signals for evaluation of emotional stress level”, M.Sc. Thesis Report, Biomedical Department, Faculty of Engineering, Islamic Azad University Mashhad Branch, November 2009.
- S.A. Hosseini, M.A. Khalilzadeh, M.B. Naghibi-Sistani, and V. Niazmand, “Higher Order Spectra Analysis of EEG Signals in Emotional Stress States”, The 2nd IEEE International Conference on Information Technology and Computer Science (ITCS), Kiev, Ukraine, pp. 60-63, July 2010.
- K. Schaaff and T. Schultz, “Towards Emotion Recognition from Electroencephalographic Signals”, The 3rd International Conference on Affective Computing and Intelligent Interaction (ACII) and Workshops, pp. 1-6, 2009.
- W. Zhou, L. Zhong, and H. Zhao, “Feature Attraction and Classification of Mental EEG Using Approximate Entropy”, Proceedings of the IEEE, The 27th Annual Conference Engineering in Medicine and Biology Society (EMBS), pp. 5975 - 5978, Shanghai, China, September 2005.
- H. Bo, Y. Fusheng, T. Qingyu, Chan, Tin-cheung “Approximate Entropy and it’s Preliminary Application in the Field of EEG and Cognition”, Proceedings of the IEEE, The 20th Annual International Conference on Engineering in Medicine and Biology Society, Vol. 20, No. 4, pp. 2091-2094, 1998.
- L. Huang, Y. Wang, J. Liu, and J. Wang, “Approximate entropy of EEG as a Measure of Cerebral Ischemic Injury”, Proceedings of the IEEE, The 26th Annual International Conference on Engineering in Medicine and Biology Society (EMBS), San Francisco, USA, September 2004.
- L. Jiu-ming, L. Jing-qing, and Y. Xue-hua, “Application of chaos analytic methods based on normal EEG”, Proceedings of the IEEE, The 3rd International Conference on Computational Electromagnetics and Its Applications, pp. 426 – 429, 2004.
- C.C. Chang, and C.J. Lin, “LIBSVM: a Library for Support Vector Machines”, 2009. Software available at URL http://www.csie.ntu.edu.tw/~cjlin/libsvm/
- http://www.kernel-machines.org/software.html
- C.J.C. Burges, “A Tutorial on Support Vector Machines for Pattern Recognition”, Data Mining and Knowledge Discovery 2, pp. 121-167, 1998.
- K. Ansari-Asl, G. Chanel, and T. PunA, “Channel Selection Method For EEG Classification in Emotion Assessment Based on Synchronization Likelihood”, EUSIPCO, Poznan, pp. 1241-1245, 2007.
