Energy circuit of 1.3 MW with Brayton cycle

Author: Zhang R., Bazhanov A.
Journal: Бюллетень науки и практики @bulletennauki
Section: Технические науки
Article in issue: 6 т.10, 2024.
Free access
In this paper, a constructive scheme of the experimental device is proposed, and the principle of its operation is described in detail. The power circuit of the device has been drawn up. Complex impedance, frequency function, amplitude frequency characteristic and phase-frequency characteristic are obtained by mathematical transformation of the power circuit. The frequency response of the circuit is constructed. As a result of the calculations, we will obtain the amplitude frequency response and the phase frequency response. Using the found values of the characteristics, we will build graphs and draw conclusions about how the characteristics depend on the change in parameters and why the graph lines of the graphs are exactly the way they are.
Hydraulics, heat exchanger, heat flow
Short address: https://sciup.org/14130495
IDR: 14130495 | UDC: 621.039:620.9 | DOI: 10.33619/2414-2948/103/44
Энергетическая схема 1,3 МВт с циклом Брайтона
Предложена конструктивная схема экспериментального устройства и подробно описан принцип его работы. Составлена силовая схема устройства. Путем математического преобразования силовой цепи получены комплексный импеданс, частотная функция, амплитудно-частотная характеристика и фазо-частотная характеристика. Построена частотная характеристика цепи. В результате расчетов получим амплитудно-частотную характеристику и фазо-частотную характеристику. По найденным значениям характеристик построим графики и сделаем выводы о том, как зависят характеристики от изменения параметров и почему линии графиков именно такие, какие они есть.
Text of the scientific article Energy circuit of 1.3 MW with Brayton cycle
Бюллетень науки и практики / Bulletin of Science and Practice
UDC 621.039:620.9
In recent years, with the growth of the national economy, the continuous deterioration of the world's environmental problems and the enhancement of people's awareness of environmental protection, clean and efficient energy use technology has been developed at a high speed. With the efficiency of traditional thermal power generation approaching the technical limit, the research hotspot towards the use of new power cycle system to gradually replace the existing traditional thermal power technology. The Brayton cycle is one of the current research topics in the field of thermal engineering, with high development prospects, and its potential applications are vast, including energy, environmental protection and military fields, so it has an important research significance. The Brayton cycle with different circulating masses has been studied and applied in a large number of applications [1-8]. At present, the more widely used ones are air Brayton cycle, nitrogen Brayton cycle and supercritical carbon dioxide (S-CO2) Brayton cycle.
The operating principle of the gas turbine is largely based on the Brayton cycle. The original Brayton engines used piston compressors and piston expanders, but more modern gas turbine engines and blown jet engines also follow the Brayton cycle. Although the cycle usually operates as an open system (and indeed must if internal combustion is used), for the purposes of thermodynamic analysis it is usually assumed that the exhaust gases are reused in the intake air, and therefore the Brayton cycle, which is analysed as a closed system, consists of four processes: 1) the process of medium entropy compression (or adiabatic compression) in the compressor. 2) the process of constant pressure heating in the combustion chamber. 3) the process of medium entropy expansion (or adiabatic expansion) in the turbine. (or adiabatic expansion) process. 4) Constant pressure exothermic process in the atmosphere.
The working process of gas turbine: the compressor (i.e.compressor) continuously inhales air from the atmosphere and compresses it; the compressed air enters the combustion chamber, mixes with the injected fuel and burns to become high temperature gas; then it flows into the gas turbine and expands to do work to push the turbine impeller to rotate with the compressor impeller; the work capacity of the high temperature gas is significantly increased after heating, thus the gas turbine drives the compressor at the At the same time, there is still surplus work as the output mechanical work of the gas turbine [9-10].
The operating principle of conventional coal power steam turbine is mainly based on the Rankine cycle, an ideal cyclic process using water vapour as the work material, which mainly consists of isentropic compression, isobaric heating, isentropic expansion, and an isobaric condensation process used in the power cycle of a steam plant. The steam turbine operates in a process in which the steam generated from the boiler flows into the steam turbine, expands in the steam turbine to do work, and pushes the turbine to rotate to output mechanical work [11].
The gas turbine combusts and produces work in one unit, and its maximum output depends on the design of the unit system itself (stereotyped products and conventional configurations) and the boundary conditions external to the unit at the time of operation (the main influencing factors are the ambient atmospheric pressure, gas turbine inlet temperature, inlet humidity and fuel characteristics). Unlike conventional coal power turbine units, the gas turbine output is limited by the maximum output of the gas turbine itself, and the power available from the gas turbine will gradually decrease as the unit ages (its power supply capability is also variable with ambient temperature and fuel fluctuations). Conventional coal power units are sized according to the BMCR (Boiler Maximum Continuous Operation) operating condition due to the boiler selection stage of the main engine of the power station, which corresponds to the VWO (Valve Fully Open) operating condition of the steam turbine. The turbine VWO condition is based on the TMC (turbine maximum continuous operation) condition of the turbine, which should take into account the appropriate margin (mainly the aging of the unit). Conventional coal power units are guaranteed to have stable maximum output and power supply capacity throughout their design life (their power supply capacity is also guaranteed during ambient temperature and fuel fluctuations).
Unit Description for Simulation
The experimental setup works as follows. The hot water or steam produced by the boilers 1 and 2 reaches the hydraulic accumulator 7 through the damping valve 6, the pipe, the check valve 4 and the pump 5. When the damping valve 6 is closed at a certain moment, a wave of reverse motion is produced, which enters the hydraulic accumulator along the line of the boiler 2, the boiler 1, the pipe 3, the check valve 4 and the pump 5, and at the same time, the pressure in the hydraulic accumulator is increased, and the kinetic energy is converted into potential energy.
After injecting coolant into the circuit, pump 5 turns on. When the set flow rate is reached (more than 1 m/s), the impact valve 6 closes. With the rapid closing of the shock valve 6, the kinetic energy of the water is converted into potential energy and the pressure in front of the shock valve 6 increases (point a). Next, the pressure-increasing wave will flow in the opposite direction from point a to point B. The wave will then flow through boiler 1 and boiler 2, and it will then flow in the opposite direction. It will increase heat transfer through Boiler 1 and Boiler 2.
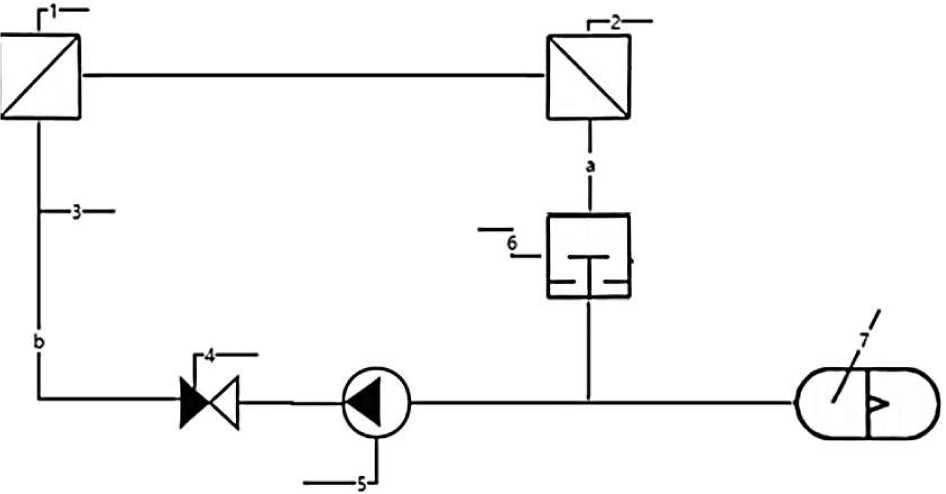
Figure 1. An experimental installation: 1 - boiler; 2 - boiler; 3 - pipeline; 4 - check valve; 5 - pump; 6 - shock value; 7 - hydraulic accumulators
In the course of the study, for a better understanding of the scheme, it was decided to study 2 characteristics of hydraulic and thermal, in order to better understand the nature of the forces arising and to more accurately determine the required parameters on the obtained model. In the first power circuit the hydraulic characteristics at the moment of closing of the shock valve is considered. This circuit contains 3 elements.
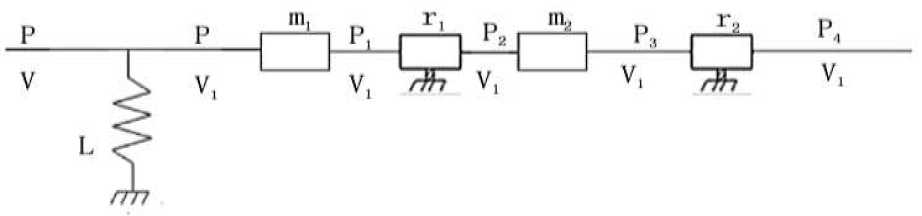
Figure 2. Hydraulic circuit
The circuit link equations:
' P = mV + rV2 + mV + rV2 + P4 \v = IP + V
Black box:
Бюллетень науки и практики / Bulletin of Science and Practice Т. 10. №6. 2024
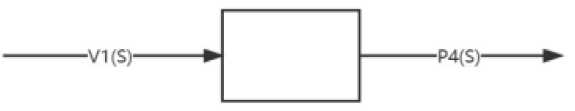
Figure 3. black box for hydraulic energy circuit
Equations for P3, P2, P i , P 4 :
|
p = p + p 4 40 + 4 |
(2) |
|
2 P 3 r2 V 1 + P 4 |
(3) |
|
2 P 1 ' 1 V 1 + P 2 |
(4) |
|
P 2 = mV + P3 |
(5) |
|
Equations for V 1 : |
|
|
V =V V I V 10 + V 1 |
(6) |
|
V * V + 2 V 10 V 1 |
(7) |
|
V 1 = VV |
(8) |
|
Equation for P: |
|
|
p = ( ' + ' 2 ) V 0 + 2( ' 1 + ' 2 ) V 0 V 1 + ( m , + m 2 ) V + P 40 + P |
(9) |
|
Equation for P : |
|
|
P = 2( I + г ^ +( m + m 2 ) V + P 4 |
(10) |
|
Equation for V: |
|
|
V = lp + V 1 = l ( m + m 2 ) V + 2 l ( ' + '2 ) VV + V + V 10 + lp |
(11) |
|
Equation for images: |
|
|
( a}s 2 + a2s + a3 ) V ( s ) = - ( bs ) P ( s ) |
(12) |
|
Complex resistance Z(s): |
|
|
x a,s 2 + a-,s + a, Z ( s ) = 1 - bs |
(13) |
|
Coefficients: |
|
|
a{ = lx ( m + m2 ) |
(14) |
|
a 2 = 2 l 1( ' 1 + r 2) V 0 |
(15) |
|
a 3 = 1 |
(16) |
|
a 4 = 2 ' 1 V 30 |
(17) |
We obtain the amplitude-frequency function of the energy circuit:
|
A (. j Q ) = jRe2( j Q ) - Im2( j Q ) |
(23) |
Get the phase-frequency function of the energy circuit:
|
^ ( j Q ) = arc tg ( j o) Re( j Q ) |
(24) |
Heat transfer energy circuit b=l
Frequency function of the circuit:
* ^ jQ, j2 =-1
z (jQ)=
- ax Q 2 + a2j Q + a3 _ ( - av Q 2 + a2j Q + a3 )bj Q
- bj Q - bj Qx bj Q
- ab Q 3 — a2bQ2 + a3bj Q b Q 2
We derive the real part of the complex resistance:
Re( j Q ) =
- a2bQ2
We derive the imaginary part of the complex resistance:
Im( j Q ) =
- a.b Q 3 + a.bQ . м/ j
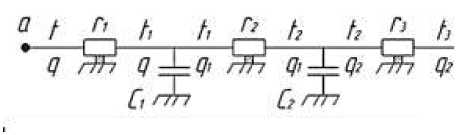
Figure 4. Heat transfer energy circuit
The circuit link equations:
^
't = rq + r2 q i + r q 2 + t 3
Black box:
q = ct + c2t 2+q
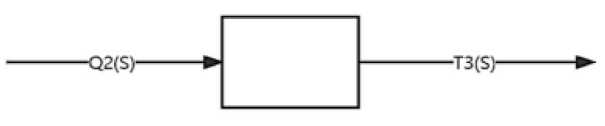
Figure 5. Black box for heat transfer
Equations for t 3 ,t 2 ,t 1 :
Бюллетень науки и практики / Bulletin of Science and Practice Т. 10. №6. 2024
|
t 3 = t 30 + t 3 |
(26) |
|
|
t 2 = r3 q2 + t 3 |
(27) |
|
|
t 1 = r 2 q 1 + t 2 |
(28) |
|
|
Equations for q 2 , q 1 : |
||
|
q 2 = q 20 + q 2 |
(29) |
|
|
q 1 = c 2 t 2 + q 2 |
(30) |
|
|
Equations for t 2 : |
||
|
t 2 = r 3 q20 + r 3 q 2 + t 30 + t 3 |
(31) |
|
|
Equations for t 2 : |
||
|
t 2 = r3 q 2 + t 3 |
(32) |
Equations for q :
q = ct + c2t2 + q2 = crqx + ct2 + c1r3q2 + ct + q20 + q2
Equations for t :
t = rq + r2qx + r3q 2 +13
= r1r2r3c1c2q 2+ ( rrc + rrc + rrc + r2r3c 2) q 2+ ( r + r 2 + r 3) q2
+ ( rr c 1 c 2 ) t 3 + ( r1 c 1 + r1 c 2 + r2 c 2 ) t 3 + t 3 + r1q 20 + r2 q 20 + r3 q 20 + t 30
Equation for images:
(bs2 + b2s+b3 Q2 (s) = -(axs2 + a2s+a3 )T3 (s)
Complex resistance Z (s') :
Z (s) = (b1s 2 + b2s+b3)
-
- ( axs 2 + a2s + a 3)
Coefficients:
ai = rrcc(37)
a2 = rc + % + % a3 = 1
b = r1r2r3c1c2
b2 = rrc + rrci + rrci. + rrc2(41)
Ьз = r + r + гз
Frequency function of the circuit:
s ^ j Q , j 2 =- 1 (43)
Z ( j Q) = b Q - j - 1^ = (44)
-
- ar Q 2 + a2j Q + a3
( - ab Q 4 + ( ab - ab ) j Q 3 + ( ab + ab - ab ) Q 2 + ( a2b3 - ab ) j Q— azb )
( - al Q 2 + a2j Q + a 3)( - al Q 2 - a2j Q + a 3)
We derive the real part of the complex resistance:
Re( j Q ) = - a i b i Q 4 + ( a i b3 + a 3 b i - a 2 b2 ) Q 2 (45)
( - al Q 2 + a2j Q+ a 3)( - al Q 2 - a2j Q + a 3)
We derive the imaginary part of the complex resistance:
Im( j Q ) = ( a i b 2 - a 2 b i ) j Q 3 + ( a 2 b 3 - a 3 b 2 ) j Q (46)
( - al Q 2 + a2j Q + a 3)( - al Q 2 - a2j Q + a 3)
We obtain the amplitude-frequency function of the energy circuit:
A ( j Q ) = 7 Re2( j Q ) + Im2( j Q )
Get the phase-frequency function of the energy circuit:
^ ( j Q ) = - arc tg
Im( j Q ) Re( j Q )
Results and discussion
The known conditions:
Table 1
CIRCUIT PARAMETERS
|
m i ,kg |
m 2 , kg |
r i , N /m • s |
r2,N/m • s |
1 1 , lit • s/kPa |
Vw, lit/s |
n o ,w |
P0,kPa |
V0, lit/s |
|
25 |
37.5 |
1080 |
1080 |
0,00022 |
0,15 |
50 |
300 |
0,167 |
|
50 |
75 |
200 |
200 |
0,0004 |
0,45 |
250 |
500 |
0,5 |
|
75 |
112.5 |
169.31 |
169.31 |
0,000367 |
0,579 |
450 |
700 |
0,643 |
Dependency graphs are plotted based on the input values. For the best perception of graphs values are taken only those that affect the dependence. The values obtained for the first stage of the energy circuit are shown in Table 2.
|
RECEIVED INFORMATION FOR HYDRAULIC |
Table 2 |
|||||
|
Ω |
A i (jO) |
V i tjty |
A2(jV) |
ФгУФ |
Аз№ |
Фз№ |
|
1 |
4487.695 |
81.69 |
2402.13 |
81.38 |
2561.34 |
81.19 |
|
2 |
2223.296 |
73.04 |
1062.83 |
70.20 |
1059.75 |
68.27 |
|
3 |
1465.01 |
63.72 |
582.81 |
51.85 |
521.78 |
41.24 |
|
4 |
1089.898 |
53.48 |
381.08 |
19.15 |
398.57 |
-10.12 |
|
5 |
875.66 |
42.20 |
381.08 |
-19.15 |
555.57 |
-45.07 |
Бюллетень науки и практики / Bulletin of Science and Practice Т. 10. №6. 2024
|
Ω |
Л 1 (Д2) |
|
A 2 (jO) |
Ч^Ж |
Аз№ |
<Рз№ |
|
6 |
721.38 |
30.08 |
490.62 |
-42.797 |
777.61 |
-57.56 |
|
7 |
680.57 |
17.62 |
630.697 |
-55.20 |
1003.39 |
-66.98 |
|
8 |
651.71 |
5.55 |
776.05 |
-62.36 |
1224.03 |
-71.30 |
|
9 |
651.59 |
-5.45 |
920.521 |
-66.98 |
1439.13 |
-74.18 |
|
10 |
671.697 |
-15.05 |
1062.83 |
-70.20 |
1649.56 |
-76.24 |
Based on the results of the calculation, the graphs of the amplitude frequency response and phase-frequency response are constructed. Further in these graphs are under construction.
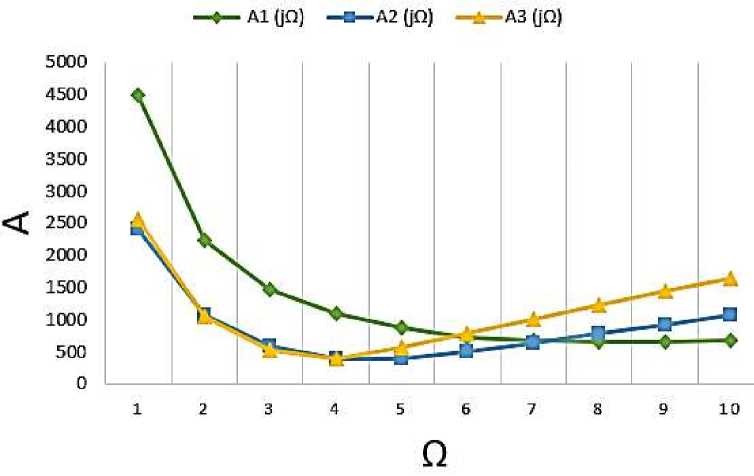
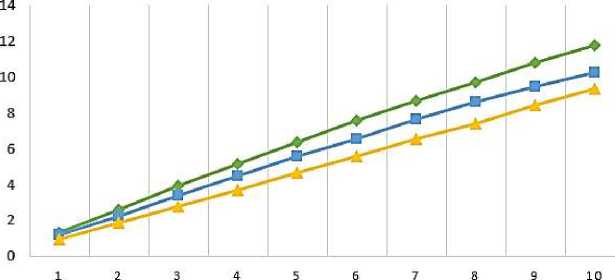
Figure 6. Amplitude frequency response
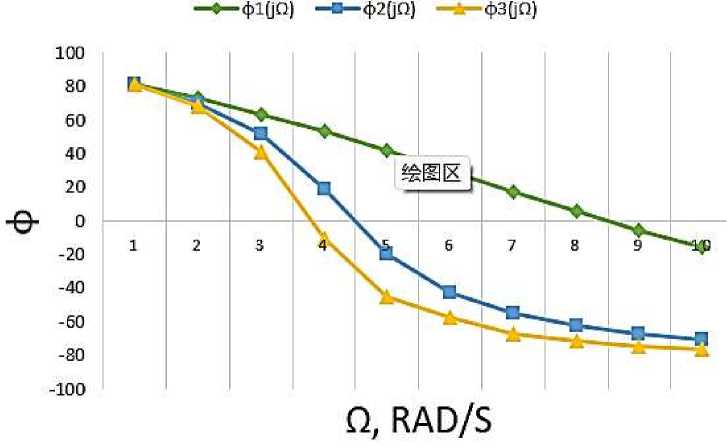
Figure 7. Phase frequency response
For power circuits of the heat transfer calculations are conducted similarly and are written in Table 4. A graphical view is presented in Figure 8, 9.
Table 3
RECEIVED INFORMATION FOR HEAT TRANSFER
Бюллетень науки и практики / Bulletin of Science and Practice
Т. 10. №6. 2024
п0, kW
ri,T2 /W
r2,X2/W r3,°C2/W
F/т
5/m
F/т
c2,W/°C2
to,C
1300
8.33
0.002174 0.417
2
0.002
0,00144
0,00144
600
2300
5.55
0.002174 0.278
3
0.003
0,00188
0,00188
700
3300
4.167
0.002174 0.208
4
0.004
0,0020625 0,0020625
800
VALUE AMPLITUDE FREQUENCY RESPONSE FOR ENERGY CIRCUIT
Table 4
Q
Л1(Д2)
—♦—Al (jQ) —О—A2 (JO) —*—A3(jO) Figure 8. Amplitude frequency response Q, RAD/S -4-ф1(|П) -о-фгця) —й—фзоо) Figure 9. Phase frequency response Q, RAD/S Conclusions A constructive scheme of the experimental device is proposed and the principle of its operation is described in detail. The power circuit of the device is drawn up, each link is explained. Complex impedance, frequency function, amplitude-frequency characteristic and phase-frequency characteristic are obtained by mathematical transformation of the power circuit. The frequency response of the circuit is constructed. The description of the experimental setup is completed, energy circuits for hydraulics and heat transfer are compiled. Energy circuits for heat transfer take into account such parameters as the mass flow rate of the medium, temperature, thermal resistance, thermal power. It was found that as the frequency increases, the frequency response of the hydraulic circuit first decreases and then slowly increases and the amplitude decreases. It is found that the frequency response of the hydraulic circuit decreases with the increase of frequency, producing a uniform pulsation. According to the resulting graphs, one can trace the relationship between two different properties. It can be seen from the graph that for a particular r value, we reach the frequency maximum faster.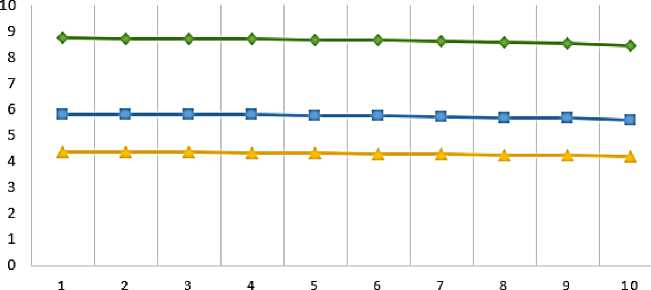
References Energy circuit of 1.3 MW with Brayton cycle
- Forsberg, C. (2007). An air-Brayton nuclear-hydrogen combined-cycle peak-and base-load electric plant. In ASME International Mechanical Engineering Congress and Exposition (Vol. 43009, pp. 561-567). https://doi.org/10.1115/IMECE2007-43907
- Forsberg, C., & Peterson, P. F. (2016). Basis for fluoride salt–cooled high-temperature reactors with nuclear air-brayton combined cycles and firebrick resistance-heated energy storage. Nuclear Technology, 196(1), 13-33. https://doi.org/10.13182/NT16-28
- Cho, J., Shin, H., Cho, J., Baik, Y. J., Choi, B., Roh, C., ... & Huh, J. (2018, June). Design, flow simulation, and performance test for a partial-admission axial turbine under supercritical CO2 condition. In Turbo Expo: Power for Land, Sea, and Air (Vol. 51180, p. V009T38A019). American Society of Mechanical Engineers. https://doi.org/10.1115/GT2018-76508
- Crespi, F., Gavagnin, G., Sánchez, D., & Martínez, G. S. (2017). Supercritical carbon dioxide cycles for power generation: A review. Applied energy, 195, 152-183. https://doi.org/10.1016/j.apenergy.2017.02.048
- Dostal, V., Hejzlar, P., & Driscoll, M. J. (2006). High-performance supercritical carbon dioxide cycle for next-generation nuclear reactors. Nuclear technology, 154(3), 265-282. https://doi.org/10.13182/NT154-265
- Tournier, J. M. P., & El-Genk, M. S. (2008). Properties of noble gases and binary mixtures for closed Brayton Cycle applications. Energy Conversion and Management, 49(3), 469-492. https://doi.org/10.1016/j.enconman.2007.06.050
- Ahn, Y., Bae, S. J., Kim, M., Cho, S. K., Baik, S., Lee, J. I., & Cha, J. E. (2015). Review of supercritical CO2 power cycle technology and current status of research and development. Nuclear engineering and technology, 47(6), 647-661. https://doi.org/10.1016/j.net.2015.06.009
- Muto, Y., Ishiyama, S., Kato, Y., Ishizuka, T., & Aritomi, M. (2010). Application of supercritical CO2 gas turbine for the fossil fired thermal plant. Journal of Energy and Power Engineering, 4(9).
- Yu, Lanlan (2016). Issledovaniya po optimizatsii proizvoditel'nosti gazovoi turbiny kombinirovannogo tsikla pri chastichnoi nagruzke, 45(4), 275-278.
- Syui, Tsyan, Sun', Bo, Tszi, Tszintszin, Tszo, Detsyuan' & Khe, Lei (2013). Metod optimizatsii gazoturbinnoi teplovoi turbin, 42(4), 229-235. (in Chinese).
- Syui, Tsyan, Sun', Bo, Tszi, Tszintszin, Tszo, Detsyuan' & Khe, Lei (2013). Metody optimizatsii dlya povysheniya proizvoditel'nosti gazoturbinnykh teplovykh turbin, 42(4), 229-235. (in Chinese).
