Energy-Efficient Traffic Management Scheme for Wireless Sensor Network

Author: Shailaja S. Halli, Poornima G. Patil
Journal: International Journal of Computer Network and Information Security @ijcnis
Article in issue: 6 vol.17, 2025.
Free access
Densely distributed nodes and high data flow rates close to sinks can cause serious problems for WSNs, especially concerning energy consumption and network complexity. As node and channel traffic management is essential for energy efficiency, not much research has been done on how to solve these problems. This paper presented a novel method that uses a Water Wave Game Theory algorithm to identify and characterize traffic areas that use less energy. Based on different network parameters, the algorithm calculates a fitness function that estimates player stability. Mobile sinks and nearby nodes are notified when the fitness level is low, anticipating energy-efficient traffic patterns and implicitly establishing an alarm threshold. Establish the LAFLC algorithm to tackle complex energy-efficient traffic scenarios. This algorithm optimizes system decisions about mobile data collectors, routing, and node mobility by dynamically learning and adapting to the characteristics of energy-efficient traffic. As a result, it eliminates the need for data rerouting and the replacement of multiple traffic nodes when mobile data collectors are in motion. The proposed approach demonstrates a superior Packet Delivery Ratio (PDR) of 99.95%, throughput of 3500bps, energy consumption of 0.39J, reliability of 98.8% and energy efficiency of 99.9% compared to existing techniques.
Wireless Sensor Networks (WSN), Energy Traffic, Water Wave Optimization, Game Theory, Fuzzy Logic Control
Short address: https://sciup.org/15020112
IDR: 15020112 | DOI: 10.5815/ijcnis.2025.06.03
Text of the scientific article Energy-Efficient Traffic Management Scheme for Wireless Sensor Network
A wireless sensor network (WSN) contains several sensor nodes that communicate, track, and collect data to a base station where users can view it. These networks can monitor a wide range of parameters, including sound, pollution, temperature, moisture, pressure, humidity, and more [1]. Many applications use WSN, and accurate transfer of data from the sensor nodes (SN) to the receiving end is required. An ideal path must be taken during the data transmission process to facilitate effective, energy-efficient data flow [2]. To efficiently gather data and carry out mission-critical tasks, WSNs are utilized in a variety of applications [3]. A vast number of tiny autonomous devices, referred to as nodes, are involved in these mission-critical tasks, which include information sensing, data processing, and establishing a communication link between nodes [4]. WSNs generally conserve more energy because of the large number of sensor nodes and the need for data processing, monitoring, and other pertinent tasks. In WSNs, nodes are battery-powered and often deployed in remote areas, making it difficult to replace or recharge their batteries [5]. With energy consumption being a critical parameter in WSNs, effective energy management is essential for network lifespan in demanding environments, as the first node failure determines the network's lifespan [6]. Numerous methods, algorithms, and protocols have been put into place to decrease energy conservation and lengthen the network's lifespan [7]. For this reason, the network must be designed so that the SNs consume the least amount of energy possible while operating, extending the network's lifespan [8]. WSNs are deployed to detect or measure environmental conditions. Traffic control, home automation, habitat or environment monitoring, and other environmental conditions are included [9]. With the many benefits that WSNs offer, it makes sense to expeditiously complete everyday tasks. Operating a network in a normal state is not necessary because the sensor nodes are involved in the infrequent detection of events and have limited energy resource availability [10]. A crucial choice regarding transmission path selection must be made, taking into account factors such as node energy levels, the shortest path to the base station, potential obstacles or delays, etc [11]. Energy limitation, coverage issues, sensor node failure, security, and design conflicts are some of the difficulties that WSN faces. Fault-tolerant networks for full coverage and sensor node failure, as well as coverage awareness, are methods to increase efficiency and prolong the life of networks [12].
Additionally, the direct transmission of data to the sink is connected to excessive energy consumption. According to an alternative perspective, unbalanced energy consumption leading to node death is the primary cause of a WSN's failure. For WSNs, numerous routing protocols have been created, with energy efficiency being a key design factor [13]. Due to the clustered topology's favorable effects on the distributed algorithm, numerous scholars from both domestic and foreign universities have studied clustered routing protocols in WSNs and presented a variety of algorithms and protocols [14]. By choosing the shortest communication path, routing maximizes information transformation and efficient energy use. It also optimizes information transmission and consumption [15]. It is anticipated that the number of nodes in WSNs will rise significantly due to increased consumption of WSNs brought about by improvements in microfabrication tools and declining sensor node costs [16]. The dissipation of energy resources in WSNs is greatly impacted by routing techniques, which can involve single or multiple hops. An NP-hard problem caused by improper routing and scheduling makes researchers reduce energy dissipation and maximize lifetime [17].
Because of concerns about energy efficiency in WSN, researchers have substantial challenges when designing protocols. Because of the restricted battery capacity of the sensor node, energy consumption is the main user's impact on sensors, data processing, and communication [18]. Clustering is the most widely used technique for boosting data transmission speed and energy efficiency. A limited trade-off between the coverage of networks and the level of energy optimization is achieved by the majority of clustering algorithms currently in use [19]. A greater amount of energy is used by the majority of these applications due to the demand for high data rates for transmission. Over time, numerous protocols have been suggested and created to achieve EE for WSN in these applications [20]. Because of the large number of sensor nodes, WSNs have energy resource issues that make routine maintenance challenging. Low Energy Clustering Hierarchy (LEACH) protocol and other energy-efficient routing protocols are required for data transmission to address this issue [21]. LEACH enables sensor nodes to form clusters, which shortens transmission distances and extends network lifetime. When communication takes place between sender and destination nodes, energy waste may arise because LEACH assumes that every node has sufficient radio energy for transmission [22]. By separating clusters into different sizes and placing larger clusters near BS and smaller clusters near BS, clustering routing protocols seek to balance CH energy consumption. However, because of the significant variation in CH loads, the traditional method is unable to address the problem of uneven energy consumption [23]. Because of the high broadcast latency at the nodes closest to the access point, multi-hop transmission can result in energy gaps in the monitoring areas [24]. Therefore, to overcome the drawbacks it is essential to evolve a framework for energy-efficient traffic management in WSN.
The motivation behind the work is as follows:
-
• A vast amount of multimedia data is accessible to a large number of internet users.
-
• Due to the increased number of internet users, this causes resource scarcity.
-
• To deal with traffic congestion, data is rerouted via an alternative path and local data to manage traffic.
The work's primary contributions are listed in the following order:
• Current studies concentrate on energy-efficient traffic on nodes and channels, ignoring complicated energyefficient traffic topologies, which result in inaccurate assessments, energy usage, and network complexity. Hence Energy efficient traffic management framework is proposed to reduce energy usage and complexity.
• Initially this proposed framework detects the traffic spot and determines the traffic nature precisely by the novel Water wave game theory algorithm.
• A novel LAFLC algorithm uses Learning Automata with Water wave game theory to handle multi-traffic spots, allowing mobile data collectors to relocate and replace nodes without data rerouting.
• The energy-efficient traffic management scheme is optimized by adding a mobile data collector node for reliable data transmission, lowering packet loss and energy usage.
2. Literature Survey
The rest of the article is structured as follows section 1 describes the introduction, section 2 reviews the existing works section 3 describes the proposed method section 4 discusses the outcomes of the proposed method, and Section 5 concludes the article.
Reddy et.al [25] described the Clustering is used by the suggested routing protocol with low energy consumption for WSN to balance Sensor Node energy consumption. Information recycling and avoiding pointless routing messages are achieved through the use of the Spider and Firefly Optimization methods. To select the best cluster heads, the algorithm takes into account variables like cluster overlaps, distances between clusters, and node remaining energy.
During clustering, parameters can be changed adaptively.
Biabaniet.al [26] Suggested EE-MSWSN is an MS wireless sensor network that uses less energy and reliably gathers data by using effective buffer management. To cover the entire network, it creates unique clustered tree-based structures and chooses each RP according to three criteria: 1) number of hops; 2) amount of data stored in each tree cluster; and 3) separation from the fixed sink.
El-Fouly et.al [27] suggested a routing algorithm that is appropriate for real-time applications and strikes a harmony between dependability and energy efficiency. Furthermore, it lessens the effects of congestion by boosting network throughput by making adequate use of the under-loaded nodes. The number of hops to the sink is taken into consideration last. The real-time routing problem is first formulated in this paper as a 0/1 Integer Linear Programming (ILP) problem to solve the optimization problem for a large-scale IWSN. Next, a Real-time Energy-Efficient Traffic-Aware approach (RTERTA) is recommended.
Samarji et.al [28] introduced ERQTM, a traffic management scheme for SDWBANs that supports QoS and is energy-efficient in routing. By creating a joint scheme, the suggested plan seeks to increase network lifetime and attain stability and reliability. Network clustering, the foundation of the framework, reduces network latency. When optimizing cluster heads in the ER scheme using a genetic algorithm, it considers factors such as residual energy, energy consumption rate, path loss model, distance to the SDN controller, and signal-to-noise ratio. To efficiently handle packets and guarantee free delay for ED transmission, the traffic management scheme gives priority to emergency data (ED). This is accomplished by giving routing, data rate, and required power high priorities.
Lu et.al [29] suggested a deep reinforcement learning-based traffic control system that views traffic management as a process of learning strategies to reduce energy usage. This approach uses a deep neural network to simulate an intelligent body that learns from the optimal path based on the condition of a wireless sensor network. The suggested approach is a suitable and workable plan to manage energy use that is minimal in a wireless sensor network and can reduce traffic.
Srivastava et.al [30] proposed a new method of traffic management based on an optimized rate to provide energyefficient transmissions. Here, energy consumption across the network is decreased by introducing the algorithm for ratebased traffic control using cluster routing. By reducing end-to-end latency, the rate control process extends the life of the network over an extended simulation period. The amalgamation of materials K-means and Greedy best-first search algorithms cluster nodes initially. The rate is then managed by employing the firefly optimization strategy, which is suitable for a high packet delivery ratio. In the end, packets are sent with the highest throughput using routing based on Ant Colony Optimization.
Soundararajan et.al [31] offered Rate Aware Congestion Control (RACC), a Modified Harris Hawks Optimization (MHHO)-based efficient traffic avoidance technique that improves network performance. The DBSCAN clustering algorithm is used to first cluster nodes. Consequently, by transmitting packets via the optimal data routing channel available for the current round, the proposed algorithm lowers node death rates, decreases hop-by-hop delays, and increases packet delivery rates, all of which eventually lengthen the lifespan and throughput of the network, respectively.
Rajeswari et.al [32] addressed the energy-aware traffic congestion detection and control mechanism, and a novel energy-efficient fuzzy-based congestion detection and control algorithm (EE-FBCDCA) has been proposed. The proposed work is divided into three stages: 1) Traffic detection based on a fuzzy inference system, 2) Traffic notification phase, and 3) Traffic management based on a fuzzy inference system. In this work, the intermediate nodes will modify their respective transmission rates to stop more packet drops as soon as they detect traffic congestion and receive the notification message. As a result, EE-FBCDCA more efficiently detects and manages traffic to enhance network quality of service.
Panimalar et.al [33] established the Energy Efficient Congestion Free Path Selection Protocol (ECFPSP) to lessen network traffic. The idea behind the ECFPSP protocol is to reduce end-to-end delay time and increase network lifetime by choosing the best main cluster head (PCH) and secondary cluster head (SCH). The recommended protocol reduced data loss and avoided hostile nodes to establish a routing protocol that offers security. It routes the nodes as well. Therefore, the ButPCNN technique offered a traffic-free Cluster Formation to lengthen the network's lifetime. This research also employed novel cluster-based WSNs to reduce packet loss and save energy.
3. Energy Efficient Traffic Management Framework
Recent research has advanced the concept of using various control schemes in networks to create alternative paths to the sink and mitigate traffic. However, there is a lack of work using mobile nodes to mitigate traffic in WSN. Existing studies focus on node and channel traffic, leading to a lack of understanding of complex energy-efficient traffic topologies. This results in unwanted usage of mobile nodes, error energy consumption, and network complexity. Previous research has only considered single-node traffic, and no methodologies focus on multi-node or multi-channel traffic in the same network area. There is a shortage of resources, such as bandwidth, as a result of the increasing number of internet users who access massive volumes of multimedia data. Conventional techniques deal with this by handling traffic by rerouting data. The energy-efficient WSN framework requires the use of local data and MDC for accurate traffic detection, enabling the system to predict network energy-efficient traffic and control and mitigate traffic loss. The proposed framework detects energy traffic spots in a network consisting of static nodes and mobile nodes near a sink. It determines the nature of traffic by utilizing a novel Water Wave Game Theory algorithm that takes into account variables like packet loss, queue size, packet delivery time, channel load, channel busyness ratio, delay, and scheduling time. Because of its capacity to manage intricate network communications dynamically, it is especially well-suited for the variable conditions found in WSNs. The player's stability over wave characteristics is determined by defining the fitness function. If fitness is low, traffic is predicted, and an implicit alert threshold is created, alerting the mobile sink and nearby mobile nodes. A novel LAFLC algorithm is employed to handle traffic scenarios with multiple nodes and channels, the LAFLC with WWGT algorithm is utilized. LAFLC incorporates learning automata, which efficiently manage the uncertainty and imprecision present in network conditions by adaptively learning the best course of action based on environmental feedback. By modifying the mobility and routing choices made by mobile data collectors, this algorithm optimizes traffic flow and permits effective relocation without requiring frequent data rerouting. Because of its adaptive learning capabilities, LAFLC is perfect for the dynamic nature of WSNs, guaranteeing energy efficiency and effective use of network resources. This framework efficiently minimizes energyefficient traffic by routing mobile data collectors and sinks, reducing energy consumption, and ensuring reliable data transmission with better energy consumption, delivery ratio, end-to-end delivery, and less packet drop. When combined, these algorithms offer a strong and complete framework for enhancing energy efficiency and traffic management in WSNs. This framework addresses congestion detection as well as traffic handling optimization in intricate network environments. The Fig. 1. depicts the architecture for the energy-efficient traffic management framework. The water wave game theory will be discussed in the below section.
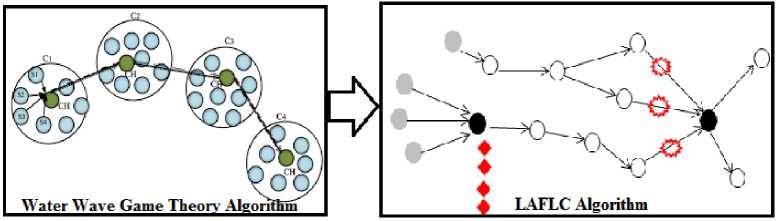
Fig.1. Architecture for the proposed framework
-
3.1. Water Wave Game Theory
The interactions and natural occurrences of water waves served as the inspiration for the WWGT algorithm. This idea compares the dynamic interactions within a network to the behavior of sea waves. Energy, frequency, and amplitude are some of the parameters that influence how waves interact when they propagate through a medium, like traffic flows do in a network. Each wave in the algorithm symbolizes a player's strategy in a game, and these wave features are used to explain the dynamics of networks. The amount of influence a particular wave (or strategy) has on the general stability of the network is represented by the fitness function, which establishes a player's stability. This is comparable to the wave's amplitude or energy. This theory is used in the context of WSNs to comprehend and forecast traffic patterns. Every node or set of nodes may be thought of as a participant in the game that the WWGT algorithm simulates when it comes to the interaction of network traffic. The objective is to improve data flow and reduce traffic congestion by adapting each player's strategy according to the interactions of the waves. The system forecasts traffic and issues an alarm when the fitness function shows poor stability (i.e., heavy congestion or the possibility of traffic bottlenecks), forcing the network to adjust.
Three different types of nodes are described by using the RPL routing protocol, the network topology: packets are forwarded to the sink and leaf nodes by the intermediate node, which is connected to other networks, and the sink (root) node itself. Think of a system that consists of one leaf node (L), one sink node (5), and several intermediate nodes (/). Assume that there is competition among a group of leaf nodes (L 1 , L2,..., Ln) with one another to transmit data packets via paths 11,12,......Ц to the sink node. To indicate a leaf node k; Vk £ N, use Lk , where N = {1,2,... ,k,... ,n}.
Furthermore, suppose that: (i) every network node can hold A packets in its buffer and (ii) the priorities of the leaf nodes varyP = {p 1 , ...,pk, ^,pm}, where pk denotes node Lk 's priority and k is a member of N. (iii) There are M applications with varying priorities hosted on each leaf node, where M = {1,2,... ,j,..., m}; symbolize by pk to the importance of the leaf node-hosted application j, Lk for all k £ N and j £ M. The user determines the priorities of leaf nodes according to the node's significance and the hosted applications. (iv) The maximum packet rate that each leaf node Lk can send is Xkmax ■ The user specifies the priority of hosted apps based on relevance and kind of application (e.g., dependable, real-time, etc.).
In WSNs, traffic is caused by the leaf nodes (L1, L2,..., Ln{ selfishly sending high-speed packet data transmission to their parent (Ц), Without taking into account the parent node's buffer usage, the accessible channel bandwidth, the parent node's forwarding (service) rate, or the sending rates of other leaf nodes, every node in the leaf network is trying to send as many packets as possible. The quality of service (QoS) aspects will suffer as a result, and network speed and throughput will decrease. Additionally, packet loss, energy consumption, and end-to-end delay will all increase. Modeling these self-centered leaf nodes and their parent would result in the non-cooperative game G = (N, (^fc)fcew, (фk)keN), were
Players: There are M players in our group (leaf nodes), L1,., Lk,... ,Ln where m is the total number of leaf nodes attached to parent / ; .
Strategies: The feasible action space for player Lk is represented by Sk; Vk В N. A minimum data rate of zero and a maximum data rate of 2 ™“ are available for each node (player) Lk Sk = [0,2 ™“ ] as a result, and SS = n k = 1 S k = [0,2 max ] x ... x [0,2^“] x ... x [0,2 max] is the strategy space for every player.
Payoff function: use Фk:SS —— R to symbolize the player's payoff function Lk ;Ук В N . The player's aim function Lk is to improve the profits by maximizing its payout function k relative to 2k over [0, 2 max ] .
Inspired by water wave theory, WWO is a heuristic algorithm for solving global optimization problems. WWO represents each solution as a "wave" with height (h) and wavelength (2), conceptualizing the outcome space as a seabed region. Each wave's fitness is determined by measuring the seabed depth; the higher the fitness, the closer the wave is to the still water level. Waves are used to describe the population of the WWO algorithm, with h max and 2 equal to 0.5 serving as representations for each wave. Three operations—propagation, refraction, and breaking—are defined in WWO to reach the global optimum at each iteration. In the propagation process, each wave (A) is multiplied by the displacement to create a new wave (A ' ), which is then added to the original wave at every dimension (d) according to Eq. (1).
A ' = A + rand(-1,1) x 2x Ld (1)
Where Ld is the search space's length for its dth measurement and rand is the random function for producing random numbers within a specified range. If the new wave (A ' )'s fitness (f (A ' )) is greater than the previous wave (A 's fitness (/(A)), replace the old wave (A) with the new wave (A ' ) and reset the height to h max ; if not, one wave height decreases.
Given that low wave heights and extended wavelengths are characteristics of deep-water waves. Short wavelengths and modest wave heights are characteristics of waves in shallow water. Therefore, the wave's wavelength decreases as it moves from deep water to shallow water. Each wave's wavelength (2) is determined by applying Eq. (2).
-(f(A)-fmin+E
2 = 2 x a(fmax-fmin+£)
Where f(A) is the fitness of wave A, the wavelength reduction coefficient parameter is denoted by a, division-by-zero is prevented by e, and the maximum and minimum fitness values in the current population are indicated by fmax and fmin . This facilitates the transmission of higher frequency waves over shorter distances and wavelengths.
As the height of the waves approaches zero, the refraction operator is applied. Utilizing a Gaussian function that is expressed in terms of mean and standard deviation, the new wave (A ' ) is computed.
A ' = Gaussian^o)
As defined by Eq. (3), ц represents the mean, while g represents the standard deviation and these are computed using Eqs. (4), (5).
_ Abestd +A d
" ~ 2
О = Abestd - Ad
Using present wave (A) and best wave (Abestd ), the mean (^) is calculated. The difference between wave (A) and the best wave (Abestd ) is the standard deviation (o). In addition, the wavelength is determined using Eq. (6) and the wave height is reset to h max .
f(A)
f(A ' )
The wavelength of the subsequent wave, denoted by A ' , the new wave's level of fitness (A ' ), the previous wavelength's and the old wave's (A) fitness, represented by 2, are all given in Eq. (6). When the breaking operator (A) in WWO reaches a better site than the best solution that is already in place (Abest ), it breaks the wave (A). Using Eq. (7), the solitary wave (A ' ) is calculated.
A ' = A + Gaussian(0,1) x 0 x Ld (7)
In Gaussian (0, 1), p represents the breaking coefficient, and the random number falls between 0 and 1. Wave A ' replaces A if it is superior to A.
The sensor node in a WSN broadcasts information to the intended location over a secure channel with a limited lifespan and minimum distance. In WSNs, securing the data channel and extending the link lifetime are major challenges. To address these problems, a secure routing protocol known as WWGT is created in this study to select the best routing route for data transfer via wireless networks. The network's active nodes are first chosen using the least distance. Using cellular automata based on game theory, the active nodes are chosen first, and then the CH. After that, the CH is routed the suggested WWGT—which was created using WWO and game theory, respectively—is used to carry out the routing procedure. Nonetheless, the parameters—such as energy, time, reliability, factor of maintainability, and factor of consistency, respectively—are used to successfully determine the best course of action. On the other hand, the suggested WWGT uses the fitness function to choose the best course using eq. (8).
F = T^Wl *t1 + №2*(1- PLi) + Ж3*Е + И/4* Dij (8)
To assess the performance or stability of nodes in a network, Fitness function F is a composite measure that combines several crucial metrics: time delay (t1), packet loss (t1), energy (E), and distance/delay (Dij). Fitness values for each node are determined by weighting (Wl, W2, W3 and W4) each metric based on its significance. It is necessary to update the wavelength following each iteration. Until the optimum route for data routing is found, the aforementioned procedures are repeated. Fig. 2. depicts the WWGT is shown below.
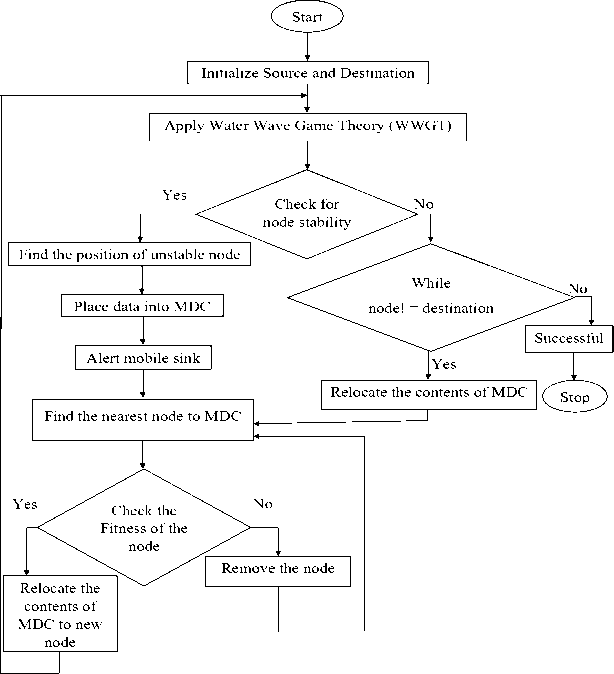
Fig.2. Flow chart for WWGT
Practical Implementation
Initialization: A collection of stationary and mobile nodes makes up the network's starting nodes. In the WWGT system, each node is given a role, and variables like channel load, packet loss, and queue size are constantly tracked.
Modeling Wave Propagation: The algorithm simulates the data flow over the network as waves. The way these waves interact with one another is a representation of how various traffic flows interact.
Fitness Function Calculation: Considering the observed parameters, a fitness function is created for every wave (or traffic flow). Each traffic flow's stability is determined by this function, and lower fitness levels suggest possible traffic congestion.
Traffic Prediction and Alerting: The WWGT algorithm forecasts traffic congestion when the fitness function falls below a certain threshold. An implicit warning threshold is established, alerting neighboring mobile nodes and the mobile sink to the impending surge in traffic.
Adaptive traffic management: The algorithm dynamically modifies mobile nodes' routing and mobility patterns to relieve anticipated load when it detects possible traffic. This action is essential to preserving network performance and avoiding bottlenecks.
Integration with LAFLC: To manage intricate traffic situations, the LAFLC algorithm collaborates with WWGT. In order to maximize traffic flow, LAFLC continually learns from the network environment and modifies the mobility and routing choices made by mobile data collectors.
Energy Efficiency Optimization: By maximizing the routes traveled by mobile data collectors and sinks, the WWGT and LAFLC architecture together reduce energy usage. This guarantees dependable data transmission with little energy consumption and packet loss.
It is possible for the system to adjust to shifting traffic patterns and sustain peak performance over time by means of constant surveillance and adaptation.
The WWGT algorithm functions as the primary mechanism in the proposed architecture for traffic detection and management in a WSN. The technique is able to anticipate traffic and take action before it affects the network's performance because it models network traffic as a sequence of interacting waves. This proactive strategy, along with the LAFLC algorithm's adaptive characteristics, guarantees that the network will continue to be reliable and effective even in the face of fluctuating and unexpected traffic situations. The WSN is a strong option for complex and dynamic network settings because of the practical use of WWGT in this situation, which enables the WSN to retain high energy efficiency, decrease packet loss rates, and assure reliable data transmission. The Learning Automata Fuzzy Logic control will be discussed in the below section.
-
3.2. Learning Automata Fuzzy Logic Control
There are numerous sensor nodes in the network. Every subsequent node can reach the sink node. There is no mobility available to the network nodes. There is geographical site-sending system on the network's regular nodes, with the exception of sink. The energy of regular nodes in a network is finite. It have decided to perform a research study using the exploratory routing approach due to its speed and dynamics, as well as the importance of various routing strategies. A structural distinction needs to be formed in order to leverage the decision-making process to assign the channel in the second phase of the project and provide routing packages to the sink in the first. Concentric circles can be used to separate the network's nodes into several groups so that the appropriate choices can be made.
In order to layer the data, the sink node must first send a signal to every other node. Depending on how far away it is from the sink, each node that receives the signal must respond to it in turn. The nodes are arranged in the proper tiers based on how far away from the washbasin they are. A node like "a," which is shown in the illustration by a different color, plans to send its data packet once the nodes have been layered. According to the suggested approach, each node first identifies its neighbors that are only in one phase. Next, it sends periodic (scheduled) messages to find out the status of the nodes that are available. Sending the packet to the lower layer is a requirement for sending it at all. The node would transfer the packet to the most qualified node within the same layer to complete the transferring task, if the lower layer node was unavailable throughout the single-phase operation. In this scenario, a node that is in the shortest time period, has the shortest distance, the shortest queue length, the greatest energy level, and the least feasible traffic load is considered to be in the ratio of qualification of a node. The suggested fuzzy logic system is used for this option. Energy, traffic load, node distance, and queue length are the inputs of the fuzzy logic system, while each node's value is the output. As a result, at this point, the network's initial node death will be delayed and interference and load increases on certain nodes are decreased.
The traditional set theory is extended by the fuzzy logic system. The primary benefit of the fuzzy method is in its ability to facilitate understanding of a system's fundamental functionality without requiring complete knowledge or a precise mathematical description of the system. In this case, the following factors determine which node in the network will send the data packet as its next step.
-
• The maximum amount of residual energy;
-
• The least amount of traffic;
-
• The node's distance; and The queue's length
-
• The node's cost is calculated using the fuzzy logic system inference system.
The following four parameters define this cost
• Remaining energy: The next node's remaining energy.
• Traffic load: The quantity of data packets sent and received from node "n" in a given amount of time determines this parameter.
• The distance from the node: The distance between two nodes is the source of this attribute.
• The queue's duration: This option describes how the node queue is being used.
• Eq. (9) yields the fuzzy logic system output that will be used to determine the node's cost, orNCn.
4. Result and Discussion
NCn-Y ^= 1UlxCl^^ = 1Ul
The shortest path taken by a node to transfer its information to the sink is the lowest step in the proposed technique called MH(n). The Eq. (10) is given as
f(n) - NCn + ^MHtji)
The following phase of a data packet requires the node to be selected with a significantly higher priority the greater the level of remaining energy. The traffic load on a network sensor node serves as the second input. A node has less priority to be chosen for the following stage the more traffic it is handling. The next set of input parameters are the queue's length and each node's distance from its neighbors. The node has a higher importance in the selection process the greater this cost. Ultimately, this result would serve as the input for the ultimate functionf(n). The outcomes of the proposed method were discussed in the below section
This section presents the results of the suggested approach, evaluation parameters, and comparative analysis.
-
4.1. Simulation Setup
The proposed energy-efficient traffic management scheme was implemented as Matlab tool with 2018a. Since MATLAB is a popular platform for developing algorithms, simulating data, and performing calculations with numbers, it is perfect for modeling WSNs. MathWorks' MATLAB R2018a Version provides a powerful simulation environment with a range of toolboxes necessary for networking and wireless communication simulations.
-
4.2. Result Obtained from the Proposed Method
-
3. depicts the original WSN is shown below.
The Intel Core i7 processor on the device used to run the simulations offered it the computational power needed to run the intricate simulations. Because the machine had 16 GB of RAM, the simulations ran smoothly, especially when handling big datasets and intricate calculations. The operating system that was utilized was Windows 10, which supports the necessary graphical and computational resources for the simulation tasks and is compatible with MATLAB R2018a. The simulation parameters are given in Table 1. Below.
Table 1. Simulation parameter
|
Parameter |
Value |
|
Total Number of nodes |
50 |
|
Deployment area |
500mx500m |
|
Total Number of relay Nodes |
5 |
|
Source node |
1 |
|
Sink Node |
1 |
|
Packet Size |
1024 bits |
|
Initial Energy |
1J |
|
Sink Speed |
(5,10,15,20,25,30)m/s |
|
Packet sending rate |
1 Packet/s |
|
Data Collection |
Mobile sink |
A strategic decision-making process for mobility and routing as well as particular selection criteria for mobile data collectors are required for the implementation of the proposed energy-efficient traffic management framework. To ensure long-term operational efficiency, mobile data collectors are chosen based on their residual energy levels, with a preference for nodes with higher remaining energy. To maximize data collection, nodes are also placed close to high-traffic areas. Availability and energy efficiency are also taken into account to prevent network outages and guarantee optimal performance. The WWGT algorithm is used to optimize routing decisions by identifying the most efficient data transmission paths through real-time traffic load analysis, dynamic path selection, and optimization. Predictions of congestion, assessments of fitness functions, and adaptive relocation techniques to preserve network equilibrium under varying circumstances all impact mobility decisions. The network with 50 nodes—5 relay nodes, 1 source node, and 1 sink node—deployed over a 500 m x 500 m area is described by the simulation parameters, which are listed in Table 1. With a packet sending rate of one packet per second and a sink node speed ranging from 5 to 30 m/s, each node begins with one joule of initial energy. A mobile sink manages the data collection, offering a thorough framework for assessing network performance and improving traffic control.
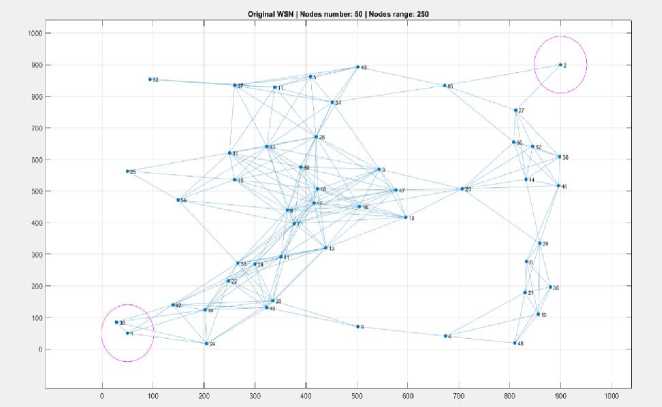
The WSN is made up of 50 nodes are randomly distributed, each of which has a communication range of 250 units and highlights the random placement of nodes and their interconnections. These nodes form a mesh network that facilitates effective data interchange and collaboration, as well as thorough coverage and environment monitoring. Fig.
Fig.3. Original WSN configuration
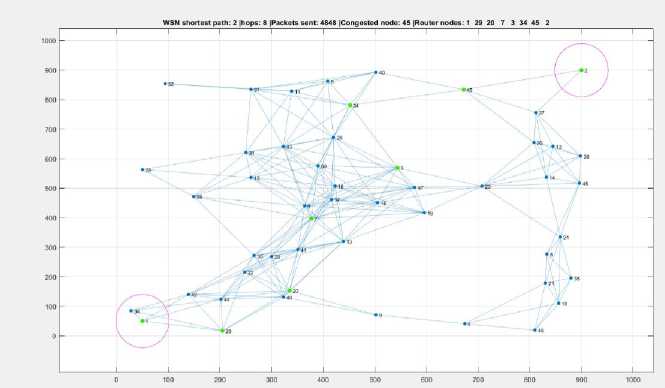
Fig.4. Output for WSN shortest path with 2 hops
The WSN is depicted in the Fig. 4, following the use of a shortest-path routing method with a maximum of two hops. Node 45 is considered congested, with 4480 packets transmitted in total. Routing is handled by the router nodes (29, 20, 7, 3, 34, 45, 2) that are highlighted. For additional study, the crowded node is highlighted, while the green nodes indicate the routers that are operating at maximum capacity. With 45 nodes, WSN uses WWGT to determine the data transmission's shortest path. The network minimizes latency and resource consumption by optimizing communication pathways. The WSN dynamically adjusts utilizing energy-efficient traffic management techniques even when it encounters traffic at 4848 nodes. Maintaining resilience in the face of traffic is made possible by the communication links that aid in traffic allocation. The number of dead sensor nodes in the algorithms rises with the number of rounds. The suggested approach greatly increases the network lifetime. It also demonstrates that the suggested method is more suited for gathering data in mobile device networks. The network's robustness and adaptability are facilitated by the 45 nodes, which provide dependable and effective data transfer.
Fig. 5. shows the performance of the WSN when the shortest-path routing method is expanded to include up to three hops. Node 44 gets crowded as more packets (9792) are sent. As seen in the image, more nodes (1, 44, 41, 16, 23, 12, 27, 2) share the routing task. Even with more hops, traffic still happens, but traffic may be distributed more widely. Through 44 congested nodes, WSN effectively relays three packets along the shortest path. The network continues to function well despite obstacles including growing data traffic and communication delays. The communication manages and distributes packets, showcasing the flexibility and efficacy of the WSN under difficult situations.
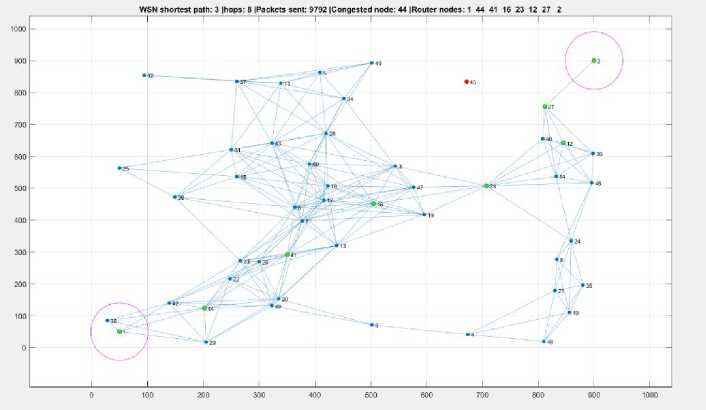
Fig.5. Output for WSN shortest path with 3 hops
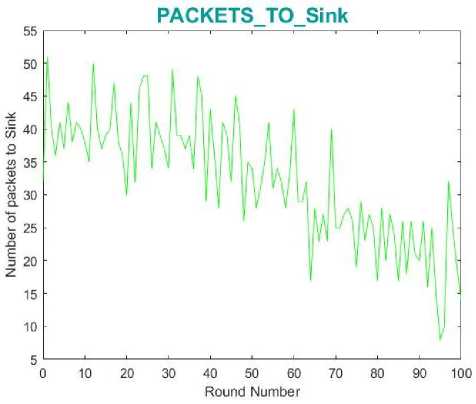
Fig.6. Number of packets transmitted to sink over time
The relationship between packets transmitted to the sink and communication rounds in the WSN is examined in the LAFLC as shown in Fig. 6. It gives administrators information on the effectiveness, stability, and responsiveness of the network, allowing them to guarantee dependable data transfer and maximize efficiency. The efficiency and performance of the network are demonstrated by the fig. 6., which shows how many packets were successfully sent to the sink node over a 100-round period. The graph initially shows about 50 packets in the early rounds, which suggests a busy network and effective data transfer. The number of packets varies from 30 to 50 throughout the first 20 rounds, with occasional increases up to 50 packets, indicating that the network is functioning at high capacity, although somewhat irregularly. There is a discernible decrease in packet transmission as the rounds go into the mid-phase (rounds 20–60), with transmission falling to about 20–35 packets each round. This suggests a decrease in network efficiency, most likely because of growing congestion or energy depletion in certain nodes. The number of packets delivered drops even more in the latter rounds (60–100), reaching as low as 5–10 packets in the final few rounds. The network's total capacity to transmit data is severely hampered by this fast reduction, which is indicative of either severe network congestion or the breakdown of several nodes.
Fig. 7. depicts the output for Number of energy-efficient traffic nodes Over Time. The adaptability and effectiveness of the WSN are demonstrated by the dynamic relationship between traffic nodes and round progression, as revealed by this analysis. Nodes with varying traffic may provide information on node density or network circumstances, which can help improve network performance and optimize WWGT. Beginning with around 200 crowded nodes, the fig. 7., shows the number of crowded nodes in the network over 100 rounds, suggesting severe traffic congestion from the onset. The number of congested nodes stays high over the first 20 rounds, declining slightly from about 200 to 190, indicating that the network is initially overloaded with traffic, resulting in high levels of congestion. Congestion starts to lessen more noticeably when the rounds move into the mid-phase (20–60), when there are about 140 crowded nodes instead of 180. This decrease might be a sign of node failures or traffic rerouting that adapts the network and lessens overall congestion. The number of congested nodes decreases dramatically in the last rounds (60–100), peaking at 80 during the hundredth round. As fewer nodes remain active, there is probably a fall in network activity as well as adaptive traffic management contributing to this significant reduction.
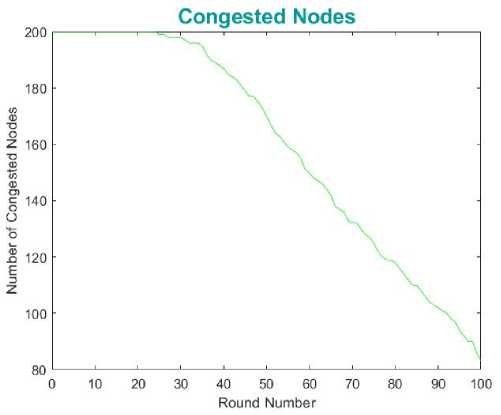
Fig.7. Output for number of energy-efficient traffic nodes over time
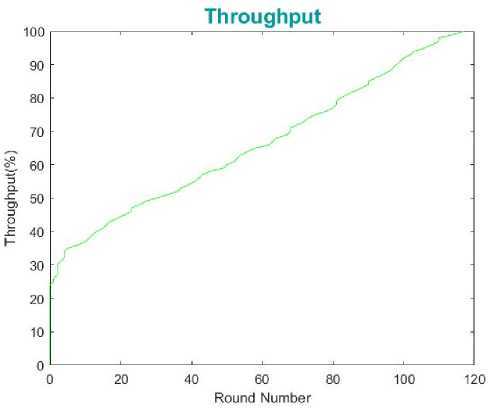
Fig.8. Throughput progression over rounds
Fig. 8. depicts the Throughput progression over Rounds. The throughput increased as the number of rounds increased by using WWGT with LAFLC. The proposed energy-efficient traffic management scheme achieved 99% of throughput. The network throughput as a percentage over 100 rounds is shown in this fig. 8., which consistently shows an increase in the efficiency of data transmission. By the 100th cycle, the graph's throughput has risen from 0% to over 100%. Throughput increases gradually from 0% to about 20% in the first rounds (1–20), most likely as a result of early network congestion or the time it takes for adaptive algorithms to settle. Throughput increases gradually from 20% to around 60% over the mid rounds (20–60), indicating the network's adaptation and optimization processes as routing and traffic management techniques become more efficient. Throughput peaks in the last rounds (60–100), going from 60% to almost 100%, proving that the network is operating at peak efficiency and that the tactics used have effectively increased the efficiency of data transmission.
Fig. 9. depicts the average energy consumption. Each network node's average energy usage offers important information on energy efficiency and management. It highlights possible areas for optimization by displaying the equilibrium in the energy distribution among nodes. A lower average energy consumption implies efficient utilization, whilst a higher consumption may indicate inefficiencies, necessitating attention to node-level energy management measures. The graph reveals the average energy of each attained 0.2 J for the low round number and for the high round number, the average energy consumption attained 0.02J.
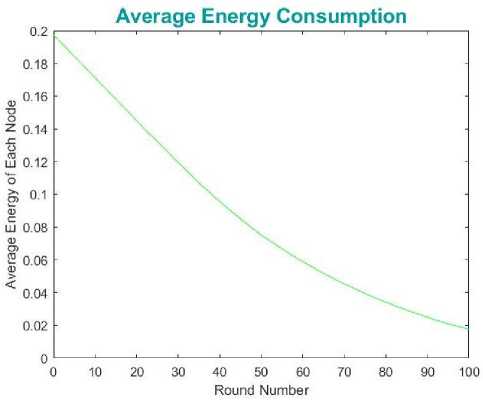
Fig.9. Average energy consumption for proposed method
-
4.3. Performance Metrics
To evaluate the performance such as Packet delivery ratio, Throughput, and energy efficiency. PDR is a critical network reliability metric that measures packet delivery without loss. A higher PDR, which is essential for data integrity and communication in WSNs, denotes a more dependable network with fewer packet losses. Network efficiency is measured by throughput, which also shows capacity and performance in different traffic scenarios. To extend node operational life, improve overall network sustainability, and assess how well the network uses its energy resources for data transmission, energy efficiency is a crucial metric for WSNs. The following metrics definitions are given below.
Energy Efficiency: The proportion of total energy sent by the network to its useful energy supplied to the network is known as the energy efficiency analysis.
Energy Efficiency =
Useful energy transferred by the network.
Total energy supp11ed to the device
Average Throughput: The correlation between the entire number of packets that the recipient has received and the process's packet transmission delay.
Average Throughput =
Number of packets Received delay
Packet Delivery Ratio: The packet delivery ratio is the proportion of total data packets sent by the transmitter to total data packets received by the recipient.
Packet Delivery Ratio
Sum of packets receied by receiver
Sum of data packets transmited by transmitter
Energy Consumption: Defined as the total of the sent energy, the number of nodes with the amount of received energy.
Energy Consumption = (recieved energy x no. of. nodes) + transmitted energy
Reliability analysis: The system lifespan is measured over a given amount of time by a quantity called reliability. The packet loss would have an inverse relationship with this metric.
reliability = 1--t----------- mean time between failure
-
4.4. Comparative Analysis
To compare measures of performance including throughput, energy efficiency, and packet delivery ratio of the proposed energy-efficient traffic management scheme with existing techniques such as Adaptive Weight Firefly congestion Control (AWFCC) [30], packet priority intimation-based congestion Control (PPI) [34], congestion detection technique for multipath routing and load balancing (CDTMRLB) [35], Feedback congestion Control (FBCC) [36], Energy efficient fuzzy based congestion detection and control algorithm (EE-FBCDCA) [32], Hierarchical Tree based congestion control using fuzzy logic (HTCCFL) [32] and Fuzzy based adaptive congestion control (FBACC) [32].
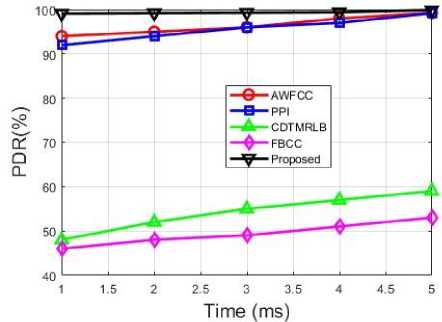
Fig.10. Comparison of packet delivery ratio
Fig. 10. depicts the Comparison of the packet delivery ratio of the proposed method with the existing technique. A transmission is considered efficient if the packet delivery ratio is high. If the packet delivery ratio reaches its highest level, the recipient can receive all information without any loss. The proposed energy-efficient traffic management scheme attained 99.95% PDR when compared to existing techniques attained PDR of 99.3% as AWFCC, 99.2% as PPI, 59% as CDTMRLB, and 53% as FBCC.
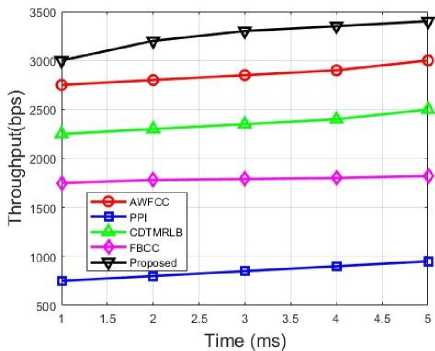
Fig.11. Comparison for throughput
Fig. 11. depicts the Comparison for throughput of the proposed method with existing technique. According to the suggested approach, for transmission to be effective, throughput needs to be high, and it is high in comparison to prior methods. Throughput is high while using the suggested task for a variety of times, and it again improves when it reaches 5ms. The proposed energy efficient traffic management scheme attained throughput as 3400 bps when compared to existing techniques attained throughput as 3000 bps for AWFCC, 950 bps for PPI, 2500 bps for CDTMRLB and 1820 bps for FBCC.
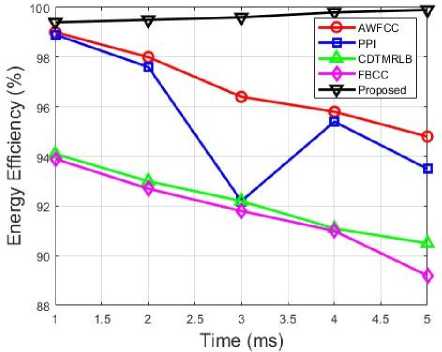
Fig.12. Comparison of energy efficiency
Fig. 12. depicts the Comparison of the energy efficiency of the proposed method with the existing technique. Energy usage is slightly higher for a given number of nodes; however, it remains relatively low in comparison with existing methodologies. To enhance communication, this energy usage should be kept to a minimum and shield the node from network failure. Keeping the source node's energy efficiency in WSNs is one of the important problems when it comes to traffic control. The energy-intensive source node during different stages of network activity. The proposed energy-efficient traffic management scheme attained an energy efficiency of 99.9 % when compared to existing techniques attained an energy efficiency of 94.8% for AWFCC, 93.5% for PPI, 90.5% for CDTMRLB, and 89.2% for FBCC.
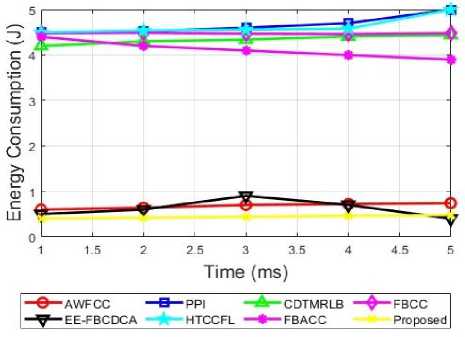
Fig.13. Comparison of energy consumption
Fig.13. displays an energy consumption comparison between traditional systems and the proposed energy-efficient traffic management scheme. Compared to existing approaches, the proposed approach yields a much reduced energy use of 0.39J. By contrast, the energy consumption of the AWFCC technique is 0.74J, PPI is 5J, and other methods like CDTMRLB, FBCC, EEFBCDCA, HTCCFL, and FBACC show 4.44J, 4.48J, 0.45J, 3.9J, and 5J, respectively. The proposed scheme's lower energy usage is essential for preserving node failure and network stability. Fuzzy-based congestion control phases, which decrease the amount of data transferred by intermediary nodes, are responsible for the lower energy consumption. The suggested technique is more efficient than the current algorithms because of this efficient congestion control, which also improves energy saving and lowers the data loss rate.
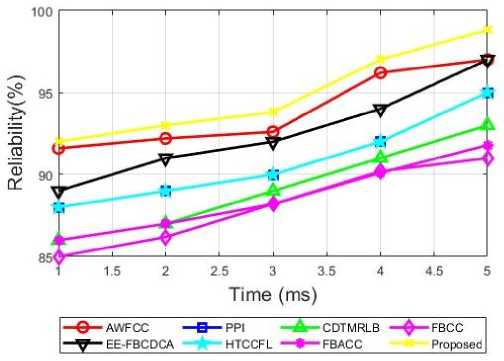
Fig.14. Comparison of reliability
Fig. 14. Depicts the Comparison of Reliability. With a reliability rate of 98.8%, the energy-efficient traffic management system that is being suggested outperforms other approaches that are existing in use, including AWFCC (97%), PPI (95%), CDTMRLB (93%), FBCC (91%), EE-FBCDCA (97%), HTCCFL (95%), and FBACC (91.8%). The scheme's excellent dependability is explained by its capacity to prevent traffic congestion by initiating the congestion notification phase, which lowers packet losses and improves network performance in general. When compared to alternative ways, the suggested method's improved dependability guarantees better network stability and lifespan. Table 2. Presents the Performance Comparison between the suggested scheme and the prevailing method.
Table 2. Performance comparison for proposed scheme with existing technique
|
Techniques |
PDR (%) |
Throughput(bps) |
Energy Efficiency (%) |
Energy Consumption (J) |
Reliability (%) |
|
AWFCC |
98 |
3000 |
94.8 |
0.74 |
97 |
|
PPI |
92 |
2500 |
93.5 |
5 |
95 |
|
CDTMRLB |
58 |
1700 |
90.5 |
4.44 |
93 |
|
FBCC |
52 |
800 |
89.2 |
4.48 |
91 |
|
EE-FBCDCA |
- |
- |
- |
0.4 |
97 |
|
HTCCFL |
- |
- |
- |
5 |
95 |
|
FBACC |
- |
- |
- |
3.9 |
91.8 |
|
Proposed |
99.95 |
3500 |
99.9 |
0.39 |
98.8 |
From the analysis, the complex traffic topologies created lead to unwanted usage of mobile nodes due to false evaluation resulting in error energy consumption and network complexity in existing research. Hence the proposed traffic management utilizes the WWGT and LAFC to overcome the complexity in the network. When compared to existing methodologies, the proposed energy-efficient traffic management strategy performs better across key parameters. It outperforms AWFCC (3000 bps) and PPI (2500 bps) in terms of throughput and achieves an impressive 99.95% Packet Delivery Ratio (PDR), which is far greater than alternatives like AWFCC (98%) and PPI (92%). Along with retaining the lowest energy consumption of 0.39J, which is lower than all other compared techniques, including EE-FBCDCA (0.4J) and AWFCC (0.74J), the approach also excels in energy efficiency, beating both AWFCC (94.8%) and PPI (93.5%). Furthermore, it guarantees continuous and reliable network performance with the greatest dependability of 98.8%.
The proposed Scheme attained high PDR, throughput, energy efficiency low energy consumption when compared to existing techniques. Thus, proposed energy-efficient traffic Management scheme outperforms better with mitigates the loss due to traffic.
5. Conclusions
This paper introduces a new method of network traffic management using a sophisticated framework that combines a group of randomly positioned static nodes with mobile nodes placed close to the sink. Using dynamic water-based properties to classify traffic types and identify traffic areas, the Water Wave Game Theory (WWGT) algorithm is an innovative part of this method. With the help of this technique, traffic conditions can be precisely analyzed, which improves network management strategy. The study's main finding is that the framework can provide important insights into energy consumption. The framework identifies areas where energy distribution can be optimized by examining the average energy consumption of network nodes. Reduced consumption suggests efficient use of energy, whereas higher consumption suggests possible inefficiencies and requires node-level energy management techniques. The performance of the framework is further improved by the addition of the Learning Automata with Fuzzy Logic Control (LAFLC) algorithm. This algorithm handles multi-traffic scenarios by combining WWGT and Learning Automata. It does this by repeatedly interacting with a dynamic environment to learn the optimal actions. It takes into account variables like cluster formation, neighbor node distances, sink distance, and clustering type (centralized or decentralized). By effectively classifying choices about the quantity, movement, routing, and transmission of mobile data collectors, the LAFLC algorithm lowers traffic levels without requiring data rerouting. The proposed scheme has impressive performance metrics, including a PDR of 99.95%, energy consumption of 0.39J, reliability of 98.8%, throughput of 3500 bps, and energy efficiency of 99.9%. These outcomes demonstrate a significant advancement over existing approaches and support the practical value of the proposed approach in controlling network traffic and maximizing energy consumption. Subsequent research endeavors ought to concentrate on augmenting Quality of Service (QoS) metrics, like lowering latency and strengthening the dependability of data transfer. A deeper understanding of the framework's resilience and adaptability can be gained by examining how it performs under various QoS restrictions and specifications. Further research into ways to enhance traffic routing and energy management techniques may also result in even higher gains in network efficiency and performance.
Conflict of Interest
They author declare that have no conflict of interest.
Ethical Approval
Institutional Review Board approval was not required.
Consent for Participate
All contributors agreed and given consent to participate.
Consent for Publication
All contributors agreed and given consent to Publish.
Data availability
No data, models, or code were generated or used during the study.
Competing interests
None
Funding
The authors state that this work has not received any funding.
Author Contribution
The authors confirm contribution to the paper as follows and all authors reviewed the results and approved the final version of the manuscript.
Acknowledgements
The authors would like to thank the Deanship of Visvesvaraya Technological University for supporting this work.
