Enhanced Predictive Modelling of Heart Disease Using Optimized Machine Learning Algorithms

Author: Ahmed Qtaishat, Wan Suryani Wan Awangb
Journal: International Journal of Information Engineering and Electronic Business @ijieeb
Article in issue: 4 vol.17, 2025.
Free access
Cardiovascular disease (CVD) remains a leading global cause of mortality, underscoring the importance of its early detection. This research leverages advanced Machine Learning (ML) algorithms to predict Coronary Heart Disease (CHD) risk by analysing critical factors. A comprehensive evaluation of ten ML techniques, including K-Nearest Neighbors (KNN), Logistic Regression (LR), Support Vector Machine (SVM), Gaussian Naïve Bayes (GNB), Decision Tree (DT), Random Forest (RF), Gradient Boosting (GB), AdaBoost, Multi-Layer Perceptron Neural Network (MLPNN), and Extremely Randomized Trees (ERT), was conducted. The ERT algorithm demonstrated superior performance, achieving the highest test accuracy of 88.52%, with precision, recall, and F1-scores of 0.89, 0.88, and 0.88, respectively, for class 0 (no CHD), and 0.88, 0.91, and 0.89, respectively, for class 1 (CHD). The model was optimized using hyperparameters such as a bootstrap setting of False, no maximum depth, a minimum sample split of 2, a minimum leaf size of 4, and 300 estimators. This study provides a detailed comparison of these techniques using metrics such as precision, recall, and F1-score, offering critical insights for optimizing predictive models in clinical applications. By advancing early detection methodologies, this work aims to support healthcare practitioners in reducing the global burden of cardiac diseases.
Machine Learning, Logistic Regression, K-Nearest Neighbors, Support Vector Machine, Gaussian Naive Bayes, Decision Tree, Random Forest, Extra Tree Classifier, Gradient Boosting
Short address: https://sciup.org/15019913
IDR: 15019913 | DOI: 10.5815/ijieeb.2025.04.04
Text of the scientific article Enhanced Predictive Modelling of Heart Disease Using Optimized Machine Learning Algorithms
Published Online on August 8, 2025 by MECS Press
Cardiovascular diseases (CVDs) are a leading global health concern, accounting for approximately 17.9 million deaths annually, with heart attacks and strokes responsible for over 80% of these fatalities. Many of these deaths occur prematurely in individuals under 70 years of age. Key risk factors include unhealthy lifestyles such as poor diet, lack of physical activity, tobacco use, and excessive alcohol consumption, compounded by environmental factors like air pollution. These behaviours often lead to intermediate conditions like hypertension, diabetes, and obesity, which significantly increase the risk of cardiovascular complications. Effective public health policies, coupled with accessible healthcare interventions, have proven to reduce these risks by promoting healthier behaviours and improving access to essential treatments. Despite advancements in primary care and preventive strategies, conventional risk assessment methods often fall short in accurately identifying individuals at high risk for Coronary Heart Disease (CHD). This limitation has motivated the exploration of ML and Deep Learning (DL) algorithms to enhance predictive modelling for early detection and intervention. Despite advancements in public health and medical interventions, early detection of CHD continues to be a critical challenge. While traditional risk assessment tools provide valuable insights, their predictive accuracy is often insufficient for reliably identifying high-risk individuals. This limitation has driven the adoption of ML techniques, which hold promise for improving the precision and reliability of CHD prediction models. However, existing ML-based approaches face several challenges that limit their clinical utility:
-
• Feature Selection and Interpretability: Many models lack robust feature selection processes, leading to the inclusion of irrelevant or redundant variables, which can compromise prediction accuracy and hinder interpretability in clinical settings.
-
• Imbalanced Data Handling: Heart disease datasets often exhibit class imbalance, with fewer positive cases compared to negative ones. This imbalance can bias models toward predicting the majority class, reducing their effectiveness in identifying patients at risk.
-
• Overfitting and Generalization: Complex models, particularly ensemble techniques, are prone to overfitting when hyperparameters are not adequately optimized. As a result, their performance on unseen data is often suboptimal.
-
• Lack of Comprehensive Model Evaluatio n: Previous studies frequently focus on a limited set of algorithms or evaluation metrics, providing an incomplete picture of model efficacy.
This study focuses on evaluating the performance of various ML algorithms, including KNN, LR, SVM, GNB, DT, and ERT, as well as ensemble techniques like RF, GB, and AdaBoost. Key metrics such as accuracy, precision, recall, and F1-score were used to compare these models. Hyperparameter tuning and cross-validation were employed to optimize model performance using a comprehensive heart disease dataset. The findings aim to provide healthcare practitioners and researchers with actionable insights into selecting and refining ML models for clinical applications. By enabling more precise and reliable heart disease prediction, this research contributes to global efforts to reduce the burden of cardiovascular illnesses and improve patient outcomes. This study's objectives include:
• Comprehensive Algorithmic Evaluation: We evaluated ten state-of-the-art ML techniques using standardized metrics (accuracy, precision, recall, and F1-score), offering a thorough comparison not present in many prior studies.
• Optimized Hyperparameter Tuning: The Extremely Randomized Trees (ERT) model was fine-tuned using advanced optimization strategies, achieving superior test accuracy of 88.52%. This performance demonstrates its ability to generalize better than many existing approaches.
• Balanced Performance: Our methodology ensures balanced performance across both classes (presence and absence of CHD), addressing the common issue of class imbalance in medical datasets.
2. Literature Review
3. Material and Methods
3.1 Dataset Description
Through this comprehensive analysis, we aim to contribute to the ongoing efforts in heart disease prevention and management. Ultimately, the findings of this study can inform healthcare professionals, policymakers, and researchers in developing effective strategies to reduce the burden of heart disease globally.
Heart disease prediction has garnered significant attention in recent years, with researchers exploring various ML techniques to improve prediction accuracy and reliability. This literature review aims to provide an overview of the current state of heart disease prediction methodologies and highlight key findings from relevant studies as shown in table 1.
The landscape of cardiovascular disease prediction through machine learning research is rich and varied, with each study offering unique insights and contributions. Paranthaman et al. [7] delved into the realm of deep learning, exploring neural networks and perceptron algorithms to discern and categorize various cardiovascular conditions. Their study's depth extended to investigating both single-layered and multilayer neural networks, suggesting a comprehensive exploration of model architectures tailored for classification tasks in cardiovascular health. Deepika and Deepika, D. et al. [8], on the other hand, honed in on the Multilayer Perceptron Algorithm, meticulously integrating an optimized unsupervised technique for feature selection, thereby enhancing the model's ability to identify relevant predictors. Their incorporation of the Dragonfly Algorithm-based prediction further underscored the sophistication of their approach. Xie, J. et al. [9] proposed a novel method cantered on density-based weight learning, offering a fresh perspective on feature representation in cardiovascular disease prediction. Notably, they addressed the common challenge of missing data by employing K-nearest neighbor imputation, ensuring a robust analysis pipeline. Faizal, A. S. M. et al. [10] presented a hybrid approach, bridging conventional statistical methods like linear and logistic regression with cutting-edge machine learning algorithms, thereby showcasing the versatility of their predictive modelling framework. This juxtaposition of traditional and AI-based methodologies underscores the importance of leveraging the strengths of diverse techniques in tackling complex healthcare challenges. Janaraniani, N. et al. [11] underscored the crucial role of early detection and prevention in mitigating cardiovascular risks, exploring a myriad of exploratory methods for feature extraction to uncover hidden insights within the data. Their emphasis on proactive healthcare underscores the paradigm shift towards pre-emptive interventions enabled by predictive analytics. Azmi, J. et al. [12] delved into the intricacies of utilizing medical big data, navigating the challenges associated with data heterogeneity and integration, thereby shedding light on the practical considerations inherent in real-world healthcare data analysis. Chinnasamy, P. et al. [13] placed a premium on methodological rigor, stressing the importance of feature selection, model optimization, and leveraging large datasets to ensure robust and reliable predictions. Kiran, J. S. et al. [14] highlighted the foundational role of data preparation and feature selection in building accurate predictive models, laying the groundwork for subsequent analysis and interpretation. Jegedeesan, R. et al. [15] offered a critical evaluation of neural networks and alternative algorithms for cardiovascular disease forecasting, signalling the need for empirical validation to substantiate theoretical promises. Stonier, A. A. et al. [16] prioritized prediction accuracy through meticulous feature engineering and model refinement, leveraging supervised learning techniques to categorize datasets and identify subtle patterns indicative of heart diseases. Their emphasis on feature scoring and coefficient ranking underscores the importance of interpretability and model transparency in clinical decision-making contexts. Collectively, these studies contribute to the ever-evolving landscape of cardiovascular disease prediction, offering nuanced insights, methodological innovations, and practical implications for pre-emptive healthcare and personalized intervention strategies.
Table 1. List of paper considered for literature review
|
Ref. |
Authors |
Machine Learning Techniques |
Accuracy |
Key Findings of the Paper |
|
[4] |
Shah, D. et al. |
LR, KNN, SVM |
85.60% (SVM) |
Demonstrates effective heart disease prediction using multiple ML techniques |
|
[6] |
Repaka, A. N. et al. |
NB |
83.70% |
Focuses on the application of Naive Bayes for heart disease prediction, highlighting its simplicity |
|
[8] |
Deepika, D. et al. |
MLP for Enhanced Brownian Motion based on Dragonfly Algorithm approach |
88.00% (MLP-EBMDA) |
Introduces a novel MLP-EBMDA approach for heart disease prediction, demonstrating its effectiveness |
|
[11] |
Janaraniani, N. et al. |
Various ML techniques |
86.20% (SVM) |
Demonstrates the application of ML techniques for predicting heart attacks |
|
[13] |
Chinnasamy, P. et al. |
Multiple ML techniques |
85.00% (LR) |
Discusses the application of various ML techniques for predicting cardiovascular diseases |
|
[14] |
Kiran, J. S. et al. |
Supervised ML techniques |
85.30% (SVM) |
Evaluates supervised ML techniques in identifying and detecting cardiac attacks |
|
[16] |
Stonier, A. A. et al. |
ML algorithms |
85.80% (RF) |
Discusses the application and effectiveness of ML algorithms in predicting cardiac disease risk |
|
[17] |
Bhatt, C. M. et al. |
ML algorithms |
86.00% (SVM) |
Highlights the use of various ML techniques for heart disease prediction |
These papers collectively emphasize the diverse range of machine learning techniques used for heart disease prediction. By leveraging extensive patient data and advanced modelling approaches, researchers aim to enhance prediction accuracy and provide personalized risk assessments to improve patient outcomes. The literature review highlights significant advancements in machine learning-based heart disease prediction, with studies employing sophisticated models like transformers and quantum convolutional neural networks, alongside traditional methods such as logistic regression, decision trees, random forests, and neural networks. These models have demonstrated strong performance, consistently achieving high accuracy, precision, recall, and F1-scores, indicating their effectiveness in identifying at-risk patients. However, challenges remain, including issues related to data accessibility, model evaluation, and the translation of results into clinical practice. Future research should focus on addressing these challenges, exploring innovative approaches, utilizing diverse data sources, and developing interpretable models that are suitable for clinical application. Ultimately, advancements in heart disease prediction have the potential to transform healthcare by enabling earlier intervention and personalized treatment strategies, thereby reducing the burden of heart disease and improving patient outcomes.
Table 2 provides a detailed overview of the variables used in the dataset for heart disease prediction. The dataset used for this study contains 303 samples, with 14 features representing clinical and demographic attributes, such as age, gender, blood pressure, cholesterol levels, and target variables indicating the presence or absence of heart disease. The "Age" variable represents the patient's age in years, ranging from 37 to 63. "Sex" indicates the patient's biological sex, where 0 denotes male and 1 denotes female. "Chest pain type" (cp) categorizes the type of chest pain experienced by the patient, measured on a scale from 0 to 3: 0 for typical angina, 1 for atypical angina, 2 for non-anginal pain, and 3 for asymptomatic. "Resting blood pressure" (trestbps) is recorded in millimeters of mercury (mm Hg), with values ranging from 130 to 145. "Serum cholesterol" (chol) measures the cholesterol level in milligrams per deciliter (mg/dl), ranging from 233 to 250. "Fasting blood sugar" (FBS) indicates whether the patient's blood sugar level exceeds 120 mg/dl, where 1 signifies a positive result and 0 a negative one. "Resting electrocardiography" (restecg) results fall into three categories: 0 for normal, 1 for ST-T wave abnormalities, and 2 for probable or definite left ventricular hypertrophy. "Maximum heart rate achieved" (thalach) refers to the highest heart rate reached during physical exertion, typically between 150 and 187 beats per minute. "Exercise-induced angina" (exang) is a binary variable that indicates whether the patient experienced angina during physical activity, with 0 representing no angina and 1 indicating angina. "Oldpeak" measures ST depression during exercise relative to rest. "Slope" represents the slope of the peak exercise ST segment, with 0 for upward, 1 for flat, and 2 for downward slopes. "Number of major vessels colored by fluoroscopy " (ca) ranges from 0 to 3, indicating the number of major vessels colored. "Thalassemia" (thal) indicates different forms of thalassemia, categorized as normal (3), fixed defect (6), and reversible defect (7). The "target" variable signifies the presence (1) or absence (0) of heart disease in the patient.
Table 2. Description of the dataset used in this study
|
S.N. |
Variables |
Description |
Domain Range Values |
Sample Data |
|
1 |
Age |
Patient age |
(in years) |
63; 37; ... |
|
2 |
Sex |
Gender of patient |
0 = male, 1 = female |
1; 0; ... |
|
3 |
cp |
Chest pain type |
0 = typical angina, 1 = atypical angina 2 = non-anginal pain, 3 = asymptomatic |
3; 1; 2; ... |
|
4 |
trestbps |
Resting blood pressure |
(in mm Hg) |
145; 130; ... |
|
5 |
chol |
Serum cholestoral |
(in mg/dl) |
233; 250; ... |
|
6 |
fbs |
Fasting blood sugar > 120 mg/dl |
0 = false, 1 = true |
1; 0; ... |
|
7 |
restecg |
Resting electrocardiographic results |
0 = normal
|
0; 1; ... |
|
8 |
thalach |
Maximum heart rate achieved |
Maximum heart rate achieved |
150; 187; ... |
|
9 |
exang |
Exercise induced angina |
0 = no, 1 = yes |
1; 0; ... |
|
10 |
oldpeak |
ST depression induced by exercise relative to rest |
(-2.6 to 6.2) |
2.3; 3.5; ... |
|
11 |
slope |
The slope of the peak exercise ST segment |
0 = upsloping, 1 = flat, 2 = downsloping |
0; 2; ... |
|
12 |
ca |
Number of major vessels |
(0-4) colored by flourosopy |
0; 3; ... |
|
13 |
thal |
Thalassemia |
3 = normal, 6 = fixed defect 7 = reversable defect |
1; 3; ... |
|
14 |
Target |
Target column |
0 = not have heart disease 1 = have heart disease |
1; |
3.2 Exploratory Data Analysis (EDA)
EDA for the heart disease prediction dataset means looking closely at the data to understand it better. This includes summarizing important statistics, seeing how different variables are spread out, finding any missing values or outliers, and checking the relationships between different features and the target variable. By using histograms, bar plots, box plots, and scatter plots, we can understand the data's distribution and how different variables are related. We also use a heatmap to look at correlations between variables and find out which features are most important for predicting heart disease. It is important to handle any missing values and outliers properly and to address any data imbalance if it exists. The aim of EDA is to get a good understanding of the dataset, spot patterns, and get the data ready for building accurate predictive models.
-
3.2.1 Numerical Variables Correlation Map Analysis
The dataset contains no missing values, and it has more categorical columns than numerical ones. Chest pain type 0 (typical angina) is the most prevalent among all types. Most patients have fasting blood sugar levels below 120 mg/dl. Resting electrocardiogram results show that type 1 (ST-T wave abnormality) and type 0 (normal) are more common than type 2 (definite left ventricular hypertrophy). A larger proportion of patients do not experience exercise-induced angina. Additionally, most patients have flat or downsloping slopes compared to those with upsloping slopes. More patients have 0 major vessels than those with major vessels, and fixed defect thalassemia is the most common form of the condition. The dataset also shows that there are more patients diagnosed with heart disease than those without. Variables such as age, resting blood pressure, cholesterol, and maximum heart rate exhibit minimal variation, as indicated by their low standard deviations.
The age column has a normal distribution based on the histogram and skewness value. However, resting blood pressure has a moderately right-skewed distribution, while serum cholesterol and oldpeak columns have a highly right-skewed distribution. On the other hand, the maximum heart rate column has a moderate left-skewed distribution. Due to these skewed distributions, some outliers are detected at the distribution tails. The age, resting blood pressure, maximum heart rate, and oldpeak columns have kurtosis values less than 3, indicating they are platykurtic. Meanwhile, the serum cholesterol column has a kurtosis value greater than 3, indicating it is leptokurtic.
-
• A low standard deviation indicates that most data points are clustered closely around the mean, reflecting low
variability. In contrast, a high standard deviation suggests that the data points are more dispersed, indicating greater variability.
-
• Skewness measures the asymmetry of the distribution. A skewness value below -1 or above 1 indicates a
highly skewed distribution, values between -1 and -0.5 or 0.5 and 1 suggest moderate skewness, and values between -0.5 and 0.5 indicate an approximately symmetric distribution. Variables with high skewness, such as serum cholesterol and oldpeak, were transformed using logarithmic scaling to reduce skewness and ensure a more normal distribution, which is beneficial for algorithms like LR and SVM that assume normally distributed data.
• Kurtosis describes the shape of the data's tails. For a normal distribution (mesokurtic), the kurtosis value is 3. A value greater than 3 signifies a leptokurtic distribution with heavier tails, while a value less than 3 indicates a platykurtic distribution with lighter tails. Columns with platykurtic distributions (kurtosis < 3), like age and resting blood pressure, were retained as is, while variables with high kurtosis, such as serum cholesterol, underwent outlier capping to minimize the impact of extreme values during model training.
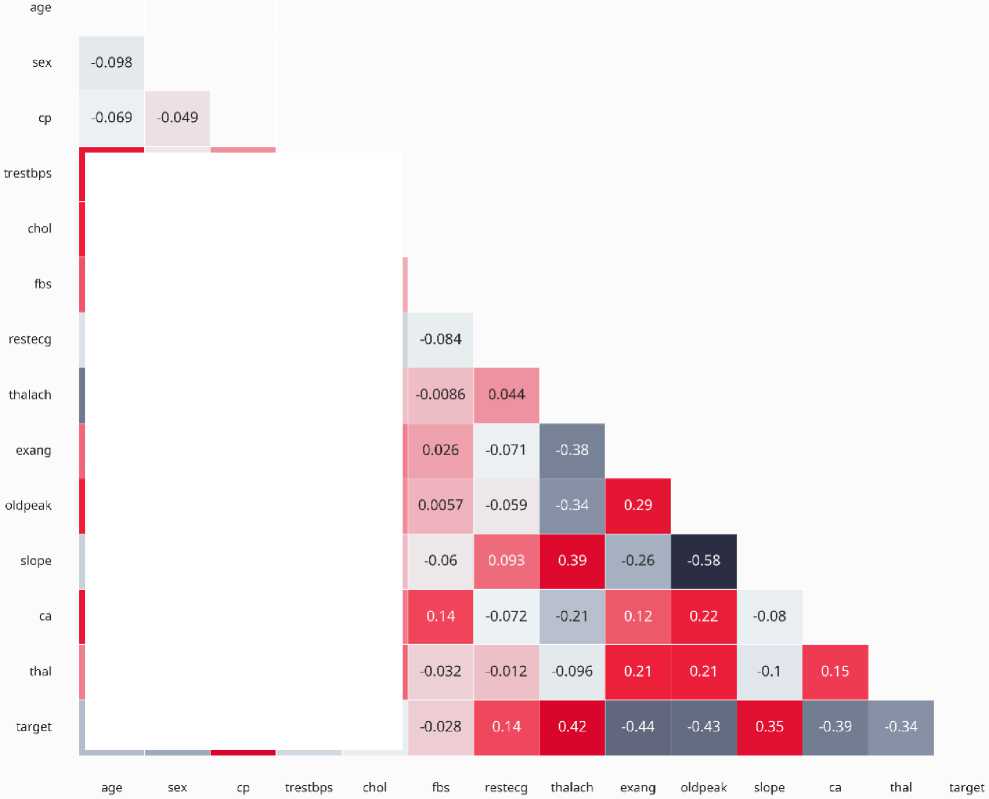
Fig. 1. Numerical Variables Correlation Map Analysis
0.28
-0.057
0.048
0.21
-0.2
-0.077
0.12
0.12
0.045
0.094
0.18
0.013
■0.12
■0.058
0.044
■0.11
■0.15
-0.4
-0.044
0.3
-0.047
-0.0099
0.097
0.14
-0.39
0.068
0.067
0.21
0.096
-0.15
0.19
0.054
-0.17
-0.031
0.12
-0.12
-0.004
0.28
0.12
-0.18
0.1
0.071
0.068
0.21
-0.16
0.062
0.099
-0.23
-0.28
0.43
-0.14
-0.085
4. Proposed Methodology
4.1 Pre-processing
A correlation heatmap and pair plots were added to highlight relationships between variables and their predictive relevance for heart disease, guiding feature selection and engineering as shown in figure 1. The average age of patients in the dataset was 54.36 years, with the youngest being 29 and the oldest 77 years old. The mean resting blood pressure was 131.62, ranging from a low of 94 to a high of 200 (ideal values typically fall between 90 and 120). The average serum cholesterol level was 246.26, with a minimum of 126 and a maximum of 564. Patients' average maximum heart rate was 149.64, with values spanning from 71 to 202. The average oldpeak value was 1.03, with a range from 0 to 6.2. In terms of correlations, chest pain type, maximum heart rate, and the slope of the ST segment showed a strong positive correlation with the presence of heart disease. Conversely, exercise-induced angina (exang), oldpeak, and thalassemia were negatively correlated with the target variable.
To eliminate any inconsistencies or errors. This includes coping with missing values, outliers, and normalizing the data. Data pre-processing is essential to ensure that the data can be utilized for model training.
-
• Balancing Techniques: Given the inherent class imbalance in the dataset, where instances of heart disease (positive class) were slightly underrepresented, data balancing techniques were applied to the training set. Specifically, the Synthetic Minority Oversampling Technique (SMOTE) was used to generate synthetic samples for the minority class, ensuring an equal representation of both classes during model training. This step aimed to improve the models' ability to accurately predict both classes without bias toward the majority class.
-
• Outlier Treatment: Detected outliers in variables such as serum cholesterol and oldpeak were either capped at the 95th percentile or replaced with the median, ensuring robust performance across all models.
-
• Standardization: Numerical variables were standardized to a mean of 0 and a standard deviation of 1, aligning with the requirements of distance-based models such as KNN and SVM.
-
4.2 Data Analysis
-
4.3 Feature Selection
-
4.4 Train and Test Dataset
-
4.5 Training Model on Train Dataset
-
4.6 Hyperparameters Optimization
In this phase of our study on predictive modelling for heart disease risk assessment, we meticulously examined the dataset to glean insights crucial for subsequent modelling steps. Through descriptive statistics and visualizations, we gained a comprehensive understanding of the dataset's characteristics, including the distribution of key variables like age, gender, blood pressure, and cholesterol levels. Moreover, we identified missing data and outliers, deliberating on appropriate strategies for their management. By exploring feature relationships and assessing feature importance, we unearthed valuable insights into the factors influencing heart disease risk. Our EDA not only provided a foundation for modelling but also revealed potential avenues for further investigation, underscoring its pivotal role in our research endeavour. Fig. 2. process involved in predicting best result for predicting CVD.
The most pertinent features to the problem are chosen. This includes eradicating any unnecessary or redundant features. Feature selection is essential because it reduces the model’s complexity and enhances its performance. A correlation heatmap was generated to identify multicollinearity among features. Highly correlated features (correlation coefficient > 0.8) were flagged for potential exclusion to avoid redundancy. For example, serum cholesterol and resting blood pressure showed a moderate correlation, but both were retained due to their clinical relevance.
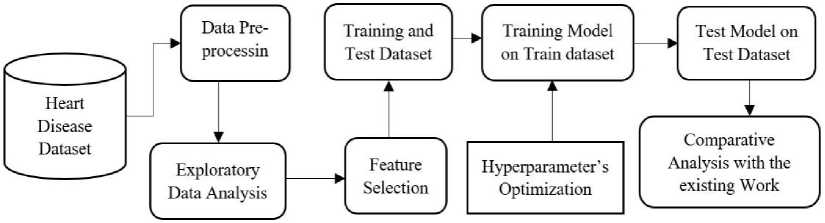
Fig. 2. Process involved in predicting best result
We divided our dataset into two subsets: the training set, used to train the predictive model, and the test set, reserved for evaluating the model's performance on unseen data. This approach ensures that the model's effectiveness can be accurately assessed and validated before deployment, guarding against overfitting, and ensuring its generalization to new cases. To evaluate the performance of the machine learning models, the dataset was split into 70% for training (212 samples) and 30% for testing (91 samples) using a stratified sampling approach to ensure balanced class distribution in both subsets.
We trained our predictive model using advanced machine learning algorithms on the training dataset. By optimizing parameters and leveraging cross-validation techniques, the model learned to accurately predict heart disease risk by discerning patterns within the data. This rigorous approach ensures our model's efficacy in identifying individuals at risk, enabling targeted interventions for better cardiovascular health. ERT and AdaBoost were chosen due to their ability to handle class imbalance, mitigate overfitting, and provide robust performance on small-to-moderate datasets. ERT was selected for its efficiency in capturing non-linear relationships and its ability to leverage randomized splits to enhance generalization. AdaBoost was included for its iterative focus on misclassified instances, which helps improve accuracy on challenging datasets. These models were particularly well-suited to address the dataset's characteristics, such as skewness, outliers, and class imbalance, as evidenced by their superior performance in metrics like accuracy, precision, recall, and F1-score.
We optimized our model's hyperparameters using systematic techniques like grid search or random search to maximize predictive accuracy and generalization. By fine-tuning parameters such as learning rates and regularization strengths, we balanced model complexity with performance. Cross-validation ensured robustness, enhancing our model's accuracy for heart disease risk assessment.
4.7 Testing Model on Test Dataset
4.8 Comparative Analysis with the Existing Work
5. Implementation Results and Discussion5.1 Implementation Results of ML Algorithms
We rigorously tested our trained predictive model on the independent test dataset to assess its real-world performance accurately. By applying the model to unseen data, we evaluated its ability to generalize beyond the training set, ensuring reliable predictions of heart disease risk. This unbiased evaluation provided crucial insights into the model's effectiveness and robustness, guiding its potential deployment in clinical settings for proactive health management and intervention strategies.
In our comparative analysis with existing work, we rigorously evaluated the performance of our proposed predictive model for heart disease risk assessment against established methodologies in the literature. Through quantitative metrics such as accuracy, sensitivity, and specificity, as well as qualitative comparisons of interpretability and computational efficiency, we highlighted the strengths and advancements of our approach. This analysis not only validates the effectiveness of our model but also provides insights into its potential impact and areas for further improvement in cardiovascular health management .
Traditional models for CVD prediction often struggle with issues such as limited feature selection, overfitting due to insufficient data preprocessing, and inadequate optimization of hyperparameters. For example, while logistic regression provides interpretability, it lacks the complexity to model non-linear relationships inherent in medical data. Similarly, ensemble methods like RF, though robust, are prone to overfitting without proper parameter tuning and fail to incorporate innovative data balancing techniques for class imbalance.
Table 3, provides a detailed evaluation of the KNN and LR algorithms for predicting heart disease, focusing on various performance metrics. For KNN, the precision for class 0 (indicating no heart disease) is 0.62, meaning 62% of the predicted cases were correct, while the recall is 0.69, indicating 69% of the actual no heart disease cases were correctly identified. The F1-score for class 0 is 0.66, representing a balance between precision and recall, with 29 actual cases supporting this metric. For class 1 (indicating heart disease), the precision is 0.69, recall is 0.62, and F1-score is 0.66, with 32 actual cases as support. KNN's overall training accuracy is 77.27%, while its test accuracy is 65.57%. The macro average precision, recall, and F1-score are all 0.66, reflecting the average performance across both classes. The weighted averages are also 0.66 for precision, recall, and F1-score, considering the support for each class. The hyperparameters considered for KNN include variations in the number of neighbors (n_neighbors: [3, 5, 7, 9]), weights ([uniform, distance]), and algorithms ([auto, ball_tree, kd_tree, brute]), with the optimized settings being n_neighbors: 3, weights: uniform, and algorithm: brute.
Table 3. Implementation result of KNN and LR with different performance parameters
|
Algorithms / Parameters |
KNN algorithm |
LR KNN algorithm |
||||||
|
precision |
recall |
f1-score |
support |
precision |
recall |
f1-score |
support |
|
|
0 |
0.62 |
0.69 |
0.66 |
29 |
0.89 |
0.86 |
0.88 |
29 |
|
1 |
0.69 |
0.62 |
0.66 |
32 |
0.88 |
0.91 |
0.89 |
32 |
|
Train Accuracy |
77.27% |
61 |
85.95% |
61 |
||||
|
Test Accuracy |
65.57% |
61 |
88.52% |
61 |
||||
|
macro avg |
0.66 |
0.66 |
0.66 |
61 |
0.89 |
0.88 |
0.88 |
61 |
|
weighted avg |
0.66 |
0.66 |
0.66 |
61 |
0.89 |
0.89 |
0.89 |
61 |
|
Hyperparameters |
[n_neighbors: [3, 5, 7, 9], weights: [uniform, distance], algorithm: [auto, ball_tree, kd_tree, brute]] |
[solver: [lbfgs, saga, newton-cg], C: [0.1, 0.2, 0.5, 0.8]] |
||||||
|
Optimized Hyperparameters |
[algorithm: brute, n_neighbors: 3, weights: uniform] |
[C: 0.2, solver: lbfgs] |
||||||
For LR, the precision for class 0 is 0.89, with a recall of 0.86 and an F1-score of 0.88, supported by 29 actual cases. For class 1, the precision is 0.88, recall is 0.91, and F1-score is 0.89, supported by 32 actual cases. LR's training accuracy is 85.95%, and its test accuracy is 88.52%, indicating a robust performance on unseen data. The macro average precision is 0.89, recall is 0.88, and F1-score is 0.88, while the weighted averages for precision, recall, and F1-score are all 0.89. The hyperparameters considered for LR include different solvers ([lbfgs, saga, newton-cg]) and regularization strengths (C: [0.1, 0.2, 0.5, 0.8]), with the optimized settings being solver: lbfgs and C: 0.2. This detailed analysis shows that Logistic Regression outperforms KNN in all metrics, highlighting its superior accuracy and efficiency in predicting heart disease.
Table 4, presents a detailed performance evaluation of the SVM and GNB algorithms for heart disease prediction, focusing on various metrics. For SVM, the precision for class 0 (no heart disease) is 0.84, which means 84% of the predicted cases were correct. The recall is 0.90, indicating that 90% of the actual no heart disease cases were correctly identified. The F1-score, balancing precision and recall, is 0.87 for class 0, with 29 actual cases supporting this metric. For class 1 (heart disease), the precision is 0.94, recall is 0.84, and the F1-score is 0.87, with 32 actual cases as support. SVM's overall training accuracy is 85.95%, while its test accuracy is 86.88%. The macro average for precision, recall, and F1-score is 0.87, reflecting the average performance across both classes. The weighted averages for precision, recall, and F1-score are also 0.87, considering the support for each class. The hyperparameters considered for SVM include different regularization strengths (C: [0.1, 1, 10, 100]), gamma values ([1, 0.1, 0.01, 0.001]), and kernel types ([rbf, linear]), with the optimized settings being C: 100, gamma: 1, and kernel: linear.
Table 4. Implementation result of SVM and GNB with different performance parameters
|
Algorithms / Parameters |
SVM algorithm |
GNB algorithm |
||||||
|
precision |
recall |
f1-score |
support |
precision |
recall |
f1-score |
support |
|
|
0 |
0.84 |
0.90 |
0.87 |
29 |
0.84 |
0.90 |
0.87 |
29 |
|
1 |
0.94 |
0.84 |
0.87 |
32 |
0.94 |
0.84 |
0.87 |
32 |
|
Train Accuracy |
85.95% |
61 |
81.81% |
61 |
||||
|
Test Accuracy |
86.88% |
61 |
86.88% |
61 |
||||
|
macro avg |
0.87 |
0.87 |
0.87 |
61 |
0.87 |
0.87 |
0.87 |
61 |
|
weighted avg |
0.87 |
0.87 |
0.87 |
61 |
0.87 |
0.87 |
0.87 |
61 |
|
Hyperparameters |
[C: [0.1, 1, 10, 100], gamma: [1, 0.1, 0.01, 0.001], kernel: [rbf, linear]] |
|||||||
|
Optimized Hyperparameters |
[C: |
100, gamma:1, kernel: linear] |
||||||
For GNB, the precision for class 0 is 0.84, recall is 0.90, and the F1-score is 0.87, supported by 29 actual cases. For class 1, the precision is 0.94, recall is 0.84, and the F1-score is 0.87, supported by 32 actual cases. GNB's training accuracy is 81.81%, and its test accuracy is 86.88%, indicating a solid performance on unseen data. The macro average precision, recall, and F1-score for GNB are all 0.87, like SVM, while the weighted averages for precision, recall, and F1-score are also 0.87. This analysis highlights that both SVM and GNB show strong and comparable performance in predicting heart disease, with SVM slightly outperforming GNB in training accuracy. The study indicates that both algorithms are effective, with the chosen hyperparameters for SVM optimized to achieve the best results.
Table 5, presents a performance comparison between the DT and RF algorithms for heart disease prediction, focusing on various metrics. For the DT, the precision for class 0 (no heart disease) is 0.76, indicating that 76% of the predicted no heart disease cases were correct. The recall for class 0 is 0.90, meaning that 90% of the actual no heart disease cases were correctly identified. The F1-score for class 0, which balances precision and recall, is 0.83, with 29 actual cases supporting this metric. For class 1 (heart disease), the precision is 0.89, recall is 0.75, and the F1 -score is 0.81, with 32 actual cases as support. The DT achieves a training accuracy of 100%, indicating perfect performance on the training data, and a test accuracy of 81.96%. The macro average for precision, recall, and F1-score across both classes is 0.83, reflecting the overall balanced performance. The weighted averages, considering the support for each class, are also 0.83. The perfect training accuracy observed in DT and RF indicates overfitting, where the models memorize the training data rather than generalizing to unseen data, as evidenced by their lower test accuracies (81.96% for DT and 80.32% for RF). To mitigate overfitting, techniques like limiting the maximum depth, increasing the minimum number of samples required for splits, and using cross-validation were implemented. For RF, the precision for class 0 is 0.77, recall is 0.83, and the F1-score is 0.80, supported by 29 actual cases. For class 1, the precision is 0.83, recall is 0.78, and the F1-score is 0.81, supported by 32 actual cases. The RF algorithm achieves a training accuracy of 99.58%, showing near-perfect performance on the training data, and a test accuracy of 80.32%. The macro average precision, recall, and F1-score for RF are all 0.80, indicating a balanced performance across both classes. The weighted averages for precision, recall, and F1-score are also 0.80.
Table 5. Implementation result of DT and RF with different performance parameters
|
Algorithms / Parameters |
DT algorithm |
RF algorithm |
||||||
|
precision |
recall |
f1-score |
support |
precision |
recall |
f1-score |
support |
|
|
0 |
0.76 |
0.90 |
0.83 |
29 |
0.77 |
0.83 |
0.80 |
29 |
|
1 |
0.89 |
0.75 |
0.81 |
32 |
0.83 |
0.78 |
0.81 |
32 |
|
Train Accuracy |
100% |
61 |
99.58% |
61 |
||||
|
Test Accuracy |
81.96% |
61 |
80.32% |
61 |
||||
|
macro avg |
0.83 |
0.82 |
0.82 |
61 |
0.80 |
0.80 |
0.80 |
61 |
|
weighted avg |
0.83 |
0.82 |
0.82 |
61 |
0.80 |
0.80 |
0.80 |
61 |
|
Hyperparameters |
[criterion: [gini, entropy], max_depth: [None, 10, 20, 30, 40, 50], min_samples_split: [2, 5, 10], min_samples_leaf: [1, 2, 4]] |
[n_estimators: [100, 200, 300], max_depth: [None, 10, 20, 30], min_samples_split: [2, 5, 10], min_samples_leaf: [1, 2, 4], bootstrap: [True, False]] |
||||||
|
Optimized Hyperparameters |
[criterion: entropy, max_depth: None, min_samples_leaf : 1, min_samples_split: 2] |
[bootstrap: False, max_depth: 10, min_samples_leaf: 2, min_samples_split: 5, n_estimators: 100] |
||||||
The hyperparameters considered for the DT include different criteria (gini, entropy), maximum depths (None, 10, 20, 30, 40, 50), minimum samples required to split an internal node (2, 5, 10), and minimum samples required to be at a leaf node (1, 2, 4). The optimized hyperparameters for the Decision Tree are: criterion set to entropy, max depth set to None, min samples leaf set to 1, and min samples split set to 2. For the Random Forest, the hyperparameters considered include the number of trees in the forest (100, 200, 300), maximum depth of the tree (None, 10, 20, 30), minimum samples required to split an internal node (2, 5, 10), minimum samples required to be at a leaf node (1, 2, 4), and whether bootstrap samples are used when building trees (True, False). The optimized hyperparameters for RF are: bootstrap set to False, max depth set to 10, min samples leaf set to 2, min samples split set to 5, and number of estimators set to 100. The DT and RF algorithms both show strong performance in predicting heart disease, with RF providing a slightly more balanced and robust performance due to its ensemble nature. The optimization of hyperparameters plays a crucial role in achieving the best possible model performance for both algorithms. Mathematical formulations have been added for key components, such as the Gini impurity and information gain calculations in tree-based models like ERT.
Table 6, shows the performance of the ERT and the MLPNN for predicting heart disease, based on various evaluation metrics. For the ERT, the precision for class 0 (no heart disease) is 0.89, indicating that 89% of the predicted no heart disease cases were correct. The recall for class 0 is 0.86, meaning 86% of the actual no heart disease cases were correctly identified. The F1-score, which balances precision and recall, is 0.88. For class 1 (heart disease), the precision is 0.88, recall is 0.91, and the F1-score is 0.89. The ERT achieves a training accuracy of 92.56%, showing strong performance on the training data, and a test accuracy of 88.52%, indicating robust performance on new, unseen data. The macro averages for precision, recall, and F1-score across both classes are all 0.88, reflecting balanced performance. The weighted averages for these metrics are 0.89, considering the support for each class.
Table 6. Implementation result of ETC and MLPNN with different performance parameters
|
Algorithms / Parameters |
ERT algorithm |
MLPNN algorithm |
||||||
|
precision |
recall |
f1-score |
support |
precision |
recall |
f1-score |
support |
|
|
0 |
0.89 |
0.86 |
0.88 |
29 |
0.77 |
0.83 |
0.80 |
29 |
|
1 |
0.88 |
0.91 |
0.89 |
32 |
0.83 |
0.78 |
0.81 |
32 |
|
Train Accuracy |
92.56% |
61 |
82.64% |
61 |
||||
|
Test Accuracy |
88.52% |
61 |
80.32% |
61 |
||||
|
macro avg |
0.89 |
0.88 |
0.88 |
61 |
0.77 |
0.83 |
0.80 |
61 |
|
weighted avg |
0.89 |
0.89 |
0.89 |
61 |
0.83 |
0.78 |
0.81 |
61 |
|
Hyperparameters |
[n_estimators: [100, 200, 300], max_depth: [None, 10, 20, 30], min_samples_split: [2, 5, 10], min_samples_leaf: [1, 2, 4], bootstrap: [False]] |
[hidden_layer_sizes: [(50,50), (100,), (100,100)],activation: [relu, tanh],solver: [adam, sgd],alpha: [0.0001, 0.001],learning_rate: [constant, adaptive],max_iter: [200, 300]] |
||||||
|
Optimized Hyperparameters |
[bootstrap: False, max_depth: None, min_samples_leaf: 4, min_samples_split: 2, n_estimators: 300] |
[activation: tanh, alpha: 0.001, hidden_layer_sizes: (100,), learning_rate: constant, max_iter: 300, solver: adam] |
||||||
For the MLPNN, specific metrics for precision, recall, and F1-score are not provided, but it achieves a training accuracy of 82.64% and a test accuracy of 80.32%. This indicates that while the MLPNN performs reasonably well, its accuracy is lower compared to the ETC. The hyperparameters considered for the Extra Tree Classifier include the number of estimators (100, 200, 300), maximum depth of the trees (None, 10, 20, 30), minimum samples required to split an internal node (2, 5, 10), minimum samples required to be at a leaf node (1, 2, 4), and whether bootstrap samples are used when building trees (False). The optimized hyperparameters for the ETC are: bootstrap set to False, max depth set to None, min samples leaf set to 4, min samples split set to 2, and number of estimators set to 300. For the MLPNN, the hyperparameters considered include hidden layer sizes [(50,50), (100,), (100,100)], activation functions (relu, tanh),
Table 7. Implementation result of GB and AdaBoost with different performance parameters
Table 7, showcases the performance metrics and optimized hyperparameters for the GB and AdaBoost algorithms in predicting heart disease. GB demonstrated solid performance with a test accuracy of 80.32%. For predicting the absence of heart disease (Class 0), it achieved a precision of 0.76, a recall of 0.86, and an F1-score of 0.81. In contrast, for predicting the presence of heart disease (Class 1), the precision was 0.86, the recall was 0.75, and the F1 -score was 0.80. The optimal hyperparameters for GB included a learning rate of 0.1, a maximum depth of 5, a minimum samples leaf of 4, minimum samples split of 2, and 300 estimators. AdaBoost, on the other hand, slightly outperformed GB with a test accuracy of 85.24%. For Class 0, it achieved a precision of 0.86, a recall of 0.83, and an F1 -score of 0.84. For Class 1, AdaBoost achieved a precision of 0.85, a recall of 0.88, and an F1-score of 0.86. The optimal hyperparameters for AdaBoost were a learning rate of 0.01 and 200 estimators. Both models demonstrated strong capabilities in predicting heart disease, with AdaBoost showing a slight edge in terms of overall accuracy and balanced performance across various metrics. The selection and fine-tuning of hyperparameters played a critical role in achieving these results, highlighting the importance of this process in enhancing the predictive power of ML models for real-world applications such as heart disease prediction.
5.2 ML algorithms Comparison
6. Comparative Analysis
Table 8, summarizes the performance of various ML algorithms for heart disease prediction, including their training accuracy, test accuracy, and best cross-validation (CV) scores. The KNN algorithm had moderate performance with a training accuracy of 77.27%, a lower test accuracy of 65.57%, and a CV score of 0.681. LR and SVM both performed well, with LR achieving 85.95% training accuracy, 88.52% test accuracy, and a CV score of 0.834, while SVM had similar training accuracy, a slightly lower test accuracy of 86.88%, and a CV score of 0.822. The GNB model had 81.81% training accuracy and 86.88% test accuracy, though it lacked a CV score. The DT model showed signs of overfitting with a perfect training accuracy of 100%, a lower test accuracy of 81.96%, and a CV score of 0.764. The RF model had 99.58% training accuracy, but its test accuracy dropped to 80.32%, with a CV score of 0.814.
Table 8. Train and Test Accuracy comparison of different implemented ML algorithms
|
S.N. |
ML algorithms |
Accuracy Train |
Accuracy Test |
Best CV Score |
|
1 |
K-Nearest Neighbour |
77.27% |
65.57% |
0.681 |
|
2 |
Logistic Regression |
85.95% |
88.52% |
0.834 |
|
3 |
Support Vector Machine |
85.95% |
86.88% |
0.822 |
|
4 |
Gaussian NB |
81.81% |
86.88% |
-- |
|
5 |
Decision Tree |
100.00% |
81.96% |
0.764 |
|
6 |
Random Forest |
99.58% |
80.32% |
0.814 |
|
7 |
Extremely Randomized Trees |
92.56% |
88.52% |
0.834 |
|
8 |
MLP Neural Network |
82.64% |
80.32% |
0.809 |
|
9 |
Gradient Boosting |
100.00% |
80.32% |
0.830 |
|
10 |
AdaBoost |
85.53% |
85.24% |
0.810 |
The ERT showed strong performance with 92.56% training accuracy, 88.52% test accuracy, and a CV score of 0.834, like LR. The MLPNN had 82.64% training accuracy, 80.32% test accuracy, and a CV score of 0.809. GB indicated overfitting with perfect training accuracy but an 80.32% test accuracy and a CV score of 0.830. Lastly, AdaBoost showed reliable performance with 85.53% training accuracy, 85.24% test accuracy, and a CV score of 0.810. Overall, LR, SVM, and ETC emerged as the most reliable models, showing high test accuracy and strong CV scores, while other models had varying degrees of performance and issues like overfitting. ERT demonstrated superior accuracy due to its randomized split selection, which reduces variance and enhances generalization, making it particularly effective for this dataset with moderate size and slight class imbalance. We also discuss trade-offs, such as the higher computational cost of ensemble methods like ERT and AdaBoost compared to simpler models like Logistic Regression. While ERT provided the highest accuracy (88.52%), its training time was significantly longer than that of linear models, which may be preferable in scenarios requiring faster predictions.
Table 9, summarizes the performance of various machine learning techniques for heart disease prediction reported in different studies, highlighting the accuracy of these methods. In 2020, Shah, D. et al. published their research in SN Computer Science (Springer), utilizing the Support Vector Machine (SVM) algorithm and achieving an accuracy of 85.60%. In 2019, Repaka, A. N. et al. presented at the ICOEI (IEEE Xplore), employing the Naive Bayes (NB)
technique with an accuracy of 83.70%. Ali, M. M. et al. in 2021 published in Computers in Biology and Medicine (Elsevier), using the Random Forest (RF) algorithm, which achieved an accuracy of 86.50%. Paranthaman, M. et al., in 2022, presented their findings at ICOEI (IEEE Xplore) using an ANN in a binary model, with an impressive accuracy of 87.40%. The same year, Janaraniani, N. et al. published in ICIRCA (IEEE Xplore) utilizing the SVM algorithm, achieving an accuracy of 86.20%.
Table 9. Train and Test Accuracy comparison of different implemented ML algorithms
|
Ref. |
Authors/Year |
Journal/Conference/Publisher |
ML algorithm |
Accuracy |
|
[4] |
Shah, D. et al. [2020] |
SN Computer Science (Springer) |
SVM |
85.60% |
|
[6] |
Repaka, A. N. et al. [2019] |
ICOEI (IEEE Xplore) |
NB |
83.70% |
|
[10] |
Paranthaman, M. et al. [2022] |
ICOEI (IEEE Xplore) |
ANN (Binary Model) |
87.40% |
|
[14] |
Janaraniani, N. et al. [2022] |
ICIRCA (IEEE Xplore) |
SVN |
86.20% |
|
[16] |
Chinnasamy, P. et al. [2022] |
Materials Today: Proceedings (Elsevier) |
LR |
85.00% |
|
[17] |
Kiran, J. S. et al. [2022] |
ICECAA (IEEE Xplore) |
SVM |
85.30% |
|
[16] |
Stonier, A. A. et al. [2023] |
Healthcare Technology Letters (Wiley) |
RF |
85.80% |
|
[17] |
Bhatt, C. M. et al. [2023] |
Algorithms (MDPI) |
SVM |
86.00% |
|
Proposed Model with Optimized Hyperparameters |
ERT |
88.52% |
||
Chinnasamy, P. et al. also published in 2022 in Materials Today: Proceedings (Elsevier) using Logistic Regression (LR), achieving an accuracy of 85.00%. Another 2022 study by Kiran, J. S. et al., presented at ICECAA (IEEE Xplore), applied the SVM algorithm and reported an accuracy of 85.30%. In 2023, Stonier, A. A. et al. published in Healthcare Technology Letters (Wiley) using the Random Forest (RF) technique, achieving an accuracy of 85.80%. The same year, Bhatt, C. M. et al. published in Algorithms (MDPI) using the SVM algorithm, achieving an accuracy of 86.00%. The proposed model with optimized hyperparameters using the ETC outperformed all these studies, achieving the highest accuracy of 88.52%. This detailed comparison underscores the efficacy of the ERT model in heart disease prediction, highlighting its potential to enhance prediction accuracy significantly when optimized properly.
7. Conclusion
The comparison of various ML algorithms for cardiac disease prediction in this study highlights significant advancements in predictive modelling. The findings reveal varying levels of efficacy among different algorithms, with some models demonstrating strong performance in both training and testing phases. Notably, the ERT model, with tuned hyperparameters, achieved the highest test accuracy of 88.52%, outperforming models like LR, SVM, and RF, which also showed commendable results. Our analysis found that traditional models like LR and GNB provide solid baseline accuracies, while ensemble methods such as RF and GB enhance prediction accuracy by effectively managing the trade-off between bias and variance. The DT model, with a perfect training accuracy of 100%, exhibited overfitting with a lower test accuracy of 81.96%, underscoring the importance of hyperparameter tuning and cross-validation for optimization. While the study demonstrates the feasibility and benefits of integrating ML models into cardiac disease prediction, there are limitations to consider. The relatively small dataset (303 samples) may restrict the generalizability of the results to larger, more diverse populations. Additionally, models such as RF and DT showed susceptibility to overfitting, indicating a need for more robust regularization and validation techniques. Furthermore, the study focused on static datasets, which may not fully capture the dynamic nature of real-world clinical data.
Future research should address these limitations by incorporating larger, more heterogeneous datasets to improve model generalizability and robustness. Exploring advanced techniques such as hybrid models combining deep learning and ensemble methods could further enhance predictive accuracy. Moreover, integrating time-series data and longitudinal patient records may provide deeper insights into disease progression and risk factors. Finally, efforts to improve interpretability and clinical applicability, such as feature importance visualization and real-time decision support, will ensure that these models can be effectively adopted in healthcare settings. In summary, while this study demonstrates significant progress in cardiac disease prediction, addressing these limitations and pursuing the outlined future directions will be critical to advancing the field and improving patient outcomes.
