Enhancing Efficient Study Plan for Student with Machine Learning Techniques

Author: Nipaporn Chanamarn, Kreangsak Tamee
Journal: International Journal of Modern Education and Computer Science (IJMECS) @ijmecs
Article in issue: 3 vol.9, 2017.
Free access
This research aims to enhance the achievement of the students on their study plan. The problem of the students in the university is that some students cannot design the efficient study plan, and this can cause the failure of studying. Machine Learning techniques are very powerful technique, and they can be adopted to solve this problem. Therefore, we developed our techniques and analyzed data from 300 samples by obtaining their grades of students from subjects in the curriculum of Computer Science, Faculty of Science and Technology, Sakon Nakhon Rajabhat University. In this research, we deployed CGPA prediction models and K-means models on 3rd-year and 4th-year students. The results of the experiment show high performance of these models. 37 students as representative samples were classified for their clusters and were predicted for CGPA. After sample classification, samples can inspect all vectors in their clusters as feasible study plans for next semesters. Samples can select a study plan and predict to achieve their desired CGPA. The result shows that the samples have significant improvement in CGPA by applying self-adaptive learning according to selected study plan.
Machine Learning, Prediction, Clustering, Grade Data Patterns, Study Plan
Short address: https://sciup.org/15014949
IDR: 15014949
Text of the scientific article Enhancing Efficient Study Plan for Student with Machine Learning Techniques
Published Online March 2017 in MECS DOI: 10.5815/ijmecs.2017.03.01
Effective undergraduate education is a key component that supports the development of the national human resources in the country. Studying in undergraduate level aims to develop personnel skills and knowledge that are necessary for particular careers. Therefore, curriculums are organized with courses which are carefully designed to ensure that students are ready for their upcoming occupations. However, some undergraduate students have a failure in undergraduate studying because they have a cumulative grade point average (CGPA) lower than the defined standard. This situation of students can lead to the delay of their graduation and loss of the opportunity to find good work. Many educational institutions have wasted annual budgets to solve an increasing rate of dropout students [1]. Academic staff tries to tackle this problem by increasing student efficacy and suggesting a guideline for better study performance. Many scholars try to help to students by applying sciences, including using psychological counseling instrument [2] and statistical science to analyze learning assessment [3]. Education Data Mining techniques (EDM) apply methods and techniques from statistics, data mining, and machine learning to analyze the education data [4-5].
Recently, Machine Learning (ML) emerged and gain popularity which is a very powerful technique from computational and statistical methods used for predictions and data pattern inferences. ML can be used to solve many problems, such as problems about marketing, banking, medical, industry, agriculture, and power generation [6-10]. Furthermore, it was used in education domain for studying in higher education institution. Researchers in education mostly apply ML in two tasks. The first task is a prediction task for student performance, and the second task is a classification task which classifies students into groups based on the students’ profiles. In prediction task, several ML techniques were used in research. For example, [11] grades of students in basic engineering subjects and basic mathematics subjects were used with Neural Network to predict CGPA, and [12] grades of students in English course were used with Neural Network to find CGPA. [13-14] Various ML techniques were compared in CGPA prediction, which include Radial Basis Function Network, Neural Network, and Support Vector Machine by using grade data from basic science subjects. In classification task, some researchers use predicted CGPA to classify students into different classes. The following examples [15-16] applied Neural Network to classify groups of student achievement performance by using grade data in each semester. [17] used Decision Tree to classify grades in basic computer programming subjects into achievement classes. Although all described studies use subjects grade as input data, some studies [18-22] use both grades and students’ profiles; sex, age, high school, and parent education are used as input. In classification techniques evaluation, many ML techniques were applied [17,20-22]. In [23], evaluation was analyzed on various techniques, including Decision Tree, Neural Network, and Naïve Bayes. [24] compared between several techniques, including Decision Tree, Neural Network, Naïve Bayes, Support Vector Machine, K-Nearest Neighbour, and Linear Regression to find which is the best ML technique. According to reviewed paper, the most used data set for prediction are CGPA and internal assessment score. While the Neural Network and Decision Tree are the two methods that are mostly used by the researchers for predicting student performance [1]. Although results from these research studies are useful for self-study planning or teacher guidance to improve student’s study achievement, the particular students have to seek for help from consultants personally. Since consultants are limited in number, students found it is very hard to get help to solve their personal study problems.
In our research, we did not only apply ML techniques to predict grade results for students, but we also did two steps. Firstly, we created prediction model from graduated student data by applying Neural Network. Secondly, we classified students who had similar grade pattern in each subject into various student groups by applying the clustering technique which is called as K-means algorithm. Other subjects’ grades of students in the same student groups can be considered as a feasible study path for remaining semesters. Then, students can make decision which path to be followed or considered as study guideline for upcoming semesters. The results of our research might help students develop a good understanding of how good or how poor of his/her learning styles. Therefore, they awaken himself/herself to begin a new learning style by following feasible study path that meets their satisfied study result. By this manner, students have effective tools that guide themselves to their better lives in the future.
The remainder of this paper is organized into sections as follows. Section II is related works pertaining to a context of students’ academic performance; Section III discusses the framework of research, including data preprocessing, modeling, and performance of deployed system; Section IV shows the conclusion.
-
II. Related Works
This section discusses the prior related research on Machine Learning techniques and student performance analysis that a number of researchers worked. The details of some related works are follows:
Arsad, Buniyamin, and Ab Mana [25] proposed a neural network, based model for academic performance prediction of Electrical Engineering Degree Student. The predictor value for the neural network model is student results from fundamental subjects at the first semester to predict the expected final cumulative grade point average upon graduation. The outcomes of neural network model from the study indicates the relation between students’ results for core subjects at semester one and final academic performance. From this finding, it can be used for improving student final performance, which can be extracted from the prediction model.
Arsad, Buniyamin, and Ab Mana [26] extended their research in Electrical Engineering student performance to compare prediction efficiency between Neural Network and Linear Regression techniques. The independent value in the research also used student core subject performance in semester one and three, not only semester one as in their previous study. Model performance was measured by coefficient of Correlation R and Mean Square Error (MSE). From experiments, Neural Network yields higher predicting accuracy than Linear Regression in coefficiency of correlation, and outcomes still indicate students’ core subject performance, which strongly influences other subjects’ performance.
Tekin [27] implement several prediction techniques in data mining, including Neural Network, Support Vector Machine, and Extreme learning machine to compare student final GPAs prediction upon graduation. The data in this study were GPAs of student in computer education and instructional technology from their first, second, and third year courses between 2006 and 2011 total 127 students and 47 subjects. The study showed that all techniques gain prediction accuracy more than 90 percent.
Oyelade, Oladipupo, and Obagbuwa [28] also implemented K-means clustering algorithms and Euclidean distance measure of similarity for analyzing students’ result data. Then, academic planners can arrange effective decision. The data in the research were students’ results in semester one of university in Nigeria, totally 79 students. In the experiment, initial K was set into value 3 to 5. Then, K-means would classify groups of students according to their performance which includes Excellent, Very Good, Good, Very Fair, Fair and Poor. The outcomes show that K-means clustering technique can appropriately determine groups of students.
Nasir, Rasid, and Ahmad [29] studied in cluster analysis by comparing hierarchical clustering (single linkage, complete linkage and average linage) and K-means clustering to determine student groups which contain Excellent, Very Good, Good, Very Fair, Fair and Poor. The collected data were from five core subjects in Malaysia primary school, totally 106 students. From the experiment, the best algorithm to determine suitable groups is K-means clustering and appropriate K =5.
-
III. Framework of Research
This section will present the framework of research to construct an enhancing study achievement modeling by using prediction and clustering technique. The research framework has been illustrated in Figure 1. Three major processes in this study include (1) data preprocessing, (2) modeling, and (3) deployment. All stages will be described in the next subsections.
-
A. Data Preprocessing
The data of students in the Computer Science (CS) curriculum were supported by Faculty of Science and Technology, Sakon Nakhon Rajabhat University, Thailand. This data were recorded between 2007 and 2011. All 530 data records represent students who must enroll in various subject groups, or courses, such as the general education, major, and elective courses. Total number of subjects were 44 subjects for four years of studying. In preprocessing stage, some incomplete data, dissimilar study subjects, withdrawals, dropout, and retirement were excluded. After cleansing data, 300 instances and 34 subjects remained.
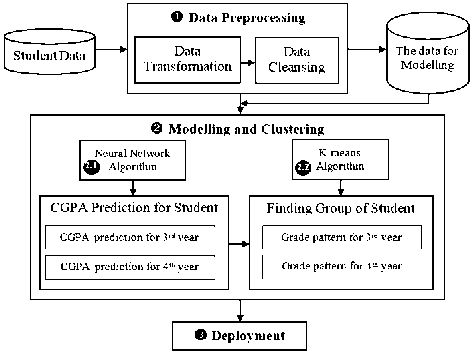
Fig.1. Enhancing study achievement system framework
Table 1 shows the used attributes, including name, description, and type of attributes. Attributes S1 to S34 are grade point for each subject; A=4.00, B+=3.50, B=3.00, C+=2.50, C=2.00, D+=1.50, and D=1.00 and S35 is CGPA that ranges from 2.00 to 4.00 (students who have CGPA below 2.00 are considered as retirement). The 300 instances were separated into two datasets for prediction and clustering. Data for CGPA prediction modeling of 3rd year students is the attributes S1 to S19 (DM3Y-19), while data for CGPA prediction modeling of 4th year students are the attributes S1 to S28 (DM4Y-28). For study pattern clustering of the 3rd year students, the researchers used S1-S19 and S35 attributes (DC3Y-20), while for study pattern clustering of the 4th year students, the researchers used S1-S28 and S35 attributes (DC4Y-29).
-
B. Modeling and Clustering
In this section, researchers implement the system by using the MATLAB 2015b platform [30] for constructing a CGPA prediction model and finding a grade point pattern. The evaluation of each technique is presented in the following sections.
-
(1) Using Neural Network for CGPA Prediction
Neural Network techniques (NN) used in this study is the Backpropagation Neural Network (BPNN) algorithm. BPNN is a collection of connected perceptron nodes.
BPNN architecture consists of three layers that are (1) Input layer representing the input variables, which use the linear transformation function, (2) Hidden layer representing the interaction among the input nodes, which use a sigmoid function as a nonlinear transformation, and (3) Output layer representing the output variables. All layers of BPNN architecture can be seen in Figure 2.
Table 1. The used attributes
|
No. |
Attributes |
Description of each attributes (Subject) |
Type of Attributes |
|
1 |
S1 |
Human Behavior for Self Development |
numeric |
|
2 |
S2 |
Fundamental Computer and Information |
numeric |
|
3 |
S3 |
Thai Society and Globalization |
numeric |
|
4 |
S4 |
Fundamental of Computer Science |
numeric |
|
5 |
S5 |
Thinking and Decision Making |
numeric |
|
6 |
S6 |
Discrete Mathematics |
numeric |
|
7 |
S7 |
Introduction to Programming |
numeric |
|
8 |
S8 |
English for Communication |
numeric |
|
9 |
S9 |
Morality for Life |
numeric |
|
10 |
S10 |
Advance Computer Programming |
numeric |
|
11 |
S11 |
Thai for Communication |
numeric |
|
12 |
S12 |
Computer Architecture |
numeric |
|
13 |
S13 |
Data Structures and Algorithms |
numeric |
|
14 |
S14 |
Calculus and Analytic Geometry I |
numeric |
|
15 |
S15 |
Reading and Writing English for General Purposes |
numeric |
|
16 |
S16 |
Object-Oriented Programming |
numeric |
|
17 |
S17 |
Concept and Management of Database System |
numeric |
|
18 |
S18 |
Computer Graphics |
numeric |
|
19 |
S19 |
Operating Systems |
numeric |
|
20 |
S20 |
Culture of Sakon Nakhon Basin |
numeric |
|
21 |
S21 |
Theory of Computation |
numeric |
|
22 |
S22 |
Systems Analysis and Design |
numeric |
|
23 |
S23 |
Numerical Methods |
numeric |
|
24 |
S24 |
Community Business Operation |
numeric |
|
25 |
S25 |
Statistics for Scientists |
numeric |
|
26 |
S26 |
Seminar in Computer Science |
numeric |
|
27 |
S27 |
Network and Security |
numeric |
|
28 |
S28 |
Object-Oriented Software Development |
numeric |
|
29 |
S29 |
Human Computer Interaction |
numeric |
|
30 |
S30 |
Elective Courses 1 |
numeric |
|
31 |
S31 |
Elective Courses 2 |
numeric |
|
32 |
S32 |
Free Elective Course |
numeric |
|
33 |
S33 |
Computer Science Project |
numeric |
|
34 |
S34 |
Professional Training in Computer Science |
numeric |
|
35 |
S35 |
The Cumulative Grade Point Average (CGPA) |
numeric |
BPNN is successful throughout the training data by adjusting the weight of connection among corresponding nodes. The weight adjustment depends on the difference between calculated output and the actual output. At the beginning, the weight of connections is randomly initiated. Then, attributes of training data are imported into input layer and pass through nodes in the hidden layer corresponding to its connection. In this hidden layer, training data are calculated by transformation functions and pass through the next nodes. The final destination of training data is nodes in the output layer. The difference between actual output and calculated output will influence weight adjustment in the previous layer, hidden layer, in the next iteration. By this way, the weight of its connection will be gradually adjusted which minimizes an output error as a result.
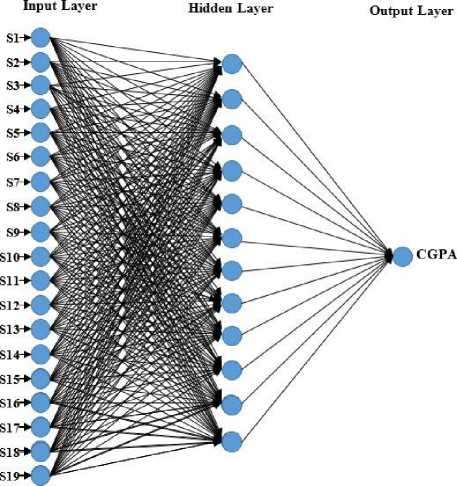
Fig.2. Architecture of the Neural Network techniques
The constructed prediction model for the 3rd and 4th year students was called MG-Junior and MG-Senior, respectively. Table 2 shows BPNN parameters for constructing both prediction models, including input layer, hidden layer, a set of nodes for hidden layer, and an output layer.
The dataset was divided into three parts, including training data for 70% (210 records), validation data for 15% (45 records), and testing data for 15% (45 records). The evaluation was done by using Mean Square Error (MSE) and the correlation coefficient (R) technique.
Table 2. Parameter definition for Neural Network algorithm
|
Parameters |
Models |
|
|
MG-Junior |
MG-Senior |
|
|
Input Layer |
19 Nodes |
28 Nodes |
|
Hidden Layer |
1 Layer |
1 Layer |
|
Hidden Node (Variety) |
6, 8, 10, 12, and 14 |
11, 13, 15, 17, and 19 |
|
Output Layer |
1 Node |
1 Node |
-
( 1.1) The MG-Junior Modeling
The comparative analysis on the performance of the Neural Network which was trained by DM3Y-19 dataset for MG-Junior model at the different hidden node is demonstrated in Table 3. It is shown that the number of hidden layer at node 12 has the best performance.
Table 3. MSE Performance of MG-Junior model
|
Model vs Number of Hidden Node |
Mean Square Error (MSE) |
Correlation coefficient (R) |
|
19:6:1 |
0.023643 |
0.95109 |
|
19:8:1 |
0.025950 |
0.94313 |
|
19:10:1 |
0.023826 |
0.94484 |
|
19: 12 :1 |
0.023563 |
0.96316 |
|
19:14:1 |
0.032069 |
0.94062 |
The best validation performance by MSE was equal to 0.023563. It was achieved at epoch 4 and stopped the training process automatically at that point that is shown in Figure 3. Scatter diagram in Figure 4 illustrates the correlation between predicted CGPA and actual CGPA. The predicted CGPA is reliable since the correlation coefficient (R) value equals 0.96316. Figure 5 shows the result of the comparison between actual (targeted) values and predicted values of MG-Junior model. Small variation was found in predicted and actual CGPA, but not in much greater number.
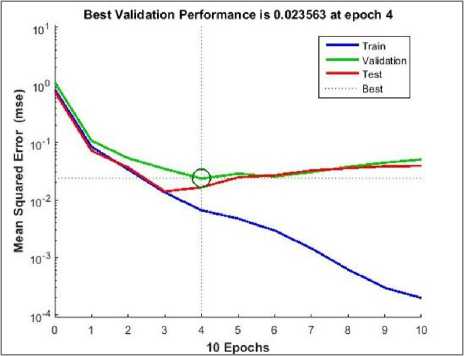
Fig.3. Best validation with MSE=0.023563 of training
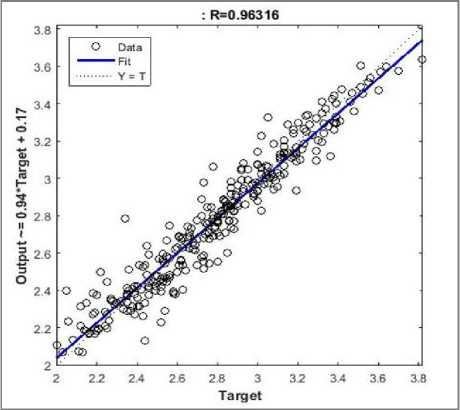
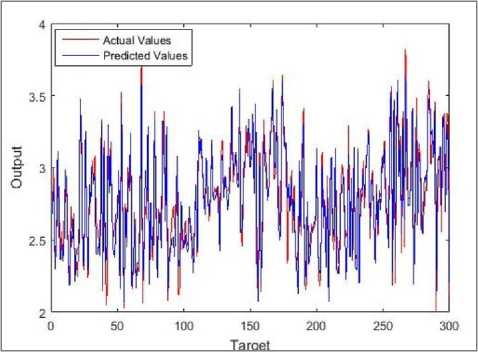
Fig.5. Comparison between actual and predicted values in training of MG-Junior model
-
(1.2) The MG-Senior Modeling
The experimental results, shown in Table 4, represents the comparative analysis on performance criteria values of the Neural Network which was trained by DM4Y-28 dataset for constructing a MG-Senior model at the different hidden nodes. The 28:13:1 model showed that 13 nodes of hidden layer showed the best performance. The MSE which equals to 0.011361 was achieved at epoch 6. At this epoch, the training process stopped automatically at the point that is shown in Figure 6.
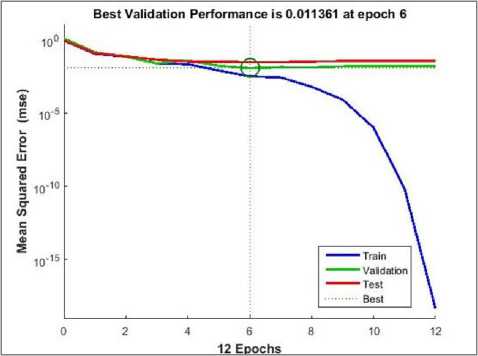
Fig.6. Best validation with MSE=0.010266 of model training
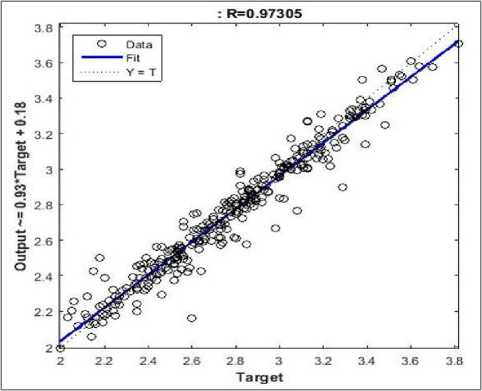
A scatter diagram in Figure 7 illustrates the correlation between predicted CGPA in the training process and actual measure. The students CGPA prediction is reliable at a correlation coefficient (R) value equals 0.97305. In Figure 8, it shows the comparison between actual values and predicted values of MG-Senior model. The difference between predicted and actual CGPA rarely occurs.
-
(2) Usi ng K-means for Finding Group of Student
Clustering methods are processes that group objects into clusters by means of similarities between objects according to its attributes. In this section, K-means algorithm was used to group students into clusters by means of similarities of their grades in each subject.
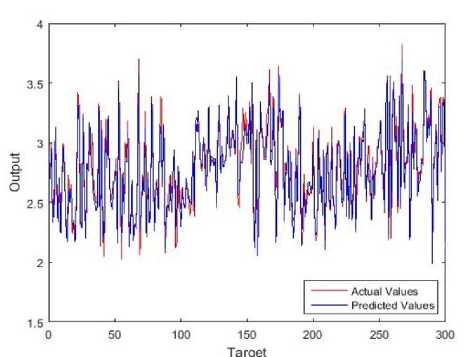
Fig.8. Comparison between actual and predicted values in training of MG-Senior model
Table 4. MSE performance of MG-Senior model
|
Model vs Number of Hidden Node |
Mean Square Error (MSE) |
Correlation coefficient (R) |
|
28:11:1 |
0.018322 |
0.97034 |
|
28: 13 :1 |
0.011361 |
0.97305 |
|
28:15:1 |
0.023126 |
0.96215 |
|
28:17:1 |
0.039255 |
0.90187 |
|
28:19:1 |
0.017255 |
0.95792 |
The K-means algorithm aims to group objects into K clusters which can be described in the following four steps. Step 1 is setting initial K value to represent the objects that are being clustered. These points are considered as a group centroids. Step 2 assigns each object to the group that has the closest centroid by using the Euclidian distance measure. Step 3 moves the positions of the group centroids to a new center of all objects in the same group. Step 4 is repeating steps 2 and 3 until there is no change in position of group center.
In this section, dataset DC3Y-20 and DC4Y-29 were used as inputs for clustering method to find data pattern of 3rd year students group and 4th year student group which are called GP-Junior and GP-Senior models, respectively. Both datasets define K equal to 7 groups according to the evaluation criteria of Sakon Nakhon Rajabhat University which include Excellent (4.00), Very Good (3.50), Good (3.00), Fairy Good (2.50), Fair (2.00), Poor (1.50), and Very Poor (1.00).
-
(2.1) The GP-Junior Clustering
In Table 5, the results of GP-Junior clustering were presented according to defined parameters that are elaborated in Section (2). For example, row one is cluster 1 that consists of 33 members (11.00%). Students in this cluster have CGPA that ranged between 2.39 and 3.20, while the average of CGPA equals to 2.75.
One of the benefits we gain by clustering particular students into their similar study patterns is discovering a feasible study path for the upcoming semester. Since members in the same group have similar study history and achievement, it means that it is possible for a specific student to get CGPA like other students in the same group. Thus, other students’ study patterns can be considered as feasible study path for a particular student.
Any students may follow others’ study paths that lead to CGPA that they expect.
Table 5. Output of GP-Junior clustering
|
Cluster Number |
Number of Students |
Percentage of students |
CGPA range |
Average value of CGPA |
|
1 |
33 |
11.00 |
2.39-3.20 |
2.75 |
|
2 |
47 |
15.67 |
3.02-3.82 |
3.35 |
|
3 |
30 |
10.00 |
2.56-3.33 |
3.00 |
|
4 |
39 |
13.00 |
2.12-3.10 |
2.63 |
|
5 |
46 |
15.33 |
2.03-2.76 |
2.36 |
|
6 |
52 |
17.33 |
2.55-3.36 |
2.96 |
|
7 |
53 |
17.67 |
2.00-2.98 |
2.50 |
All students were assigned into each cluster by the similarity of subjects (S20-S34) grades. Students have earned these grade point in 3rd and 4th year, as shown in Figure 9. All clusters have been explored their data patterns and summarized into 3 rules for the students who want to gain higher achievement in the further year until graduation. In Figure 9, an example of members in the cluster 7 can be interpreted as rules as follows:
|
No. |
S20 |
S21 |
S22 |
S23 |
S24 |
S25 |
S26 |
S27 |
S28 |
S29 |
S30 |
S31 |
S32 |
S33 |
S34 |
CGPA |
|
|
1 |
4 |
3.5 |
2.5 |
2.5 |
3 |
2 |
3 |
3.5 |
2.5 |
3 |
3 |
2 |
4 |
3.5 |
4 |
2.98 |
|
|
2 |
4 |
4 |
4 |
2 |
3.5 |
4 |
4 |
4 |
3.5 |
2.5 |
3 |
4 |
4 |
4 |
4 |
2.88 |
|
|
3 |
4 |
3.5 |
2.5 |
2.5 |
4 |
2.5 |
3 |
3 |
2 |
2.5 |
2.5 |
2 |
4 |
3.5 |
4 |
2.85 |
|
|
53 |
4 |
1.5 |
1 |
2 |
3 |
1.5 |
1.5 |
2.5 |
1 |
1 |
1.5 |
1 |
3 |
3 |
4 |
2.00 |
|
|
Avg. |
3.93 |
2.70 |
2.10 |
2.52 |
2.63 |
1.77 |
3.00 |
2.90 |
1.95 |
2.08 |
2.37 |
2.05 |
3.46 |
3.15 |
3.95 |
2.50 |
Fig.9. Example cluster 7: Data pattern of GP-Junior clustering
-
(1) If the student wish CGPA 2.50 as average CGPA for this cluster, he/she has to study in each subject not less than the average grade, as following (row of Avg.): the subjects S20 ≥ 3.93 (grade A), S21 ≥ 2.70 (grade B), S22 ≥ 2.10 (grade C+), …, and S34 ≥ 3.95 (grade A), respectively.
-
(2) If the student wish maximum CGPA in cluster, he/she has to earn grade not less than maximum CGPA that is 2.98, as following (row 1st): the subjects S20 ≥ 4 (grade A), S21 ≥ 3.5 (grade B+), S22 ≥ 2.5 (grade C+), …, and S34 ≥ 4 (grade A), respectively.
-
(3) If the student wish minimum CGPA in cluster, he/she has to gain grade not less than minimum CGPA 2.00, as following (row 53th): the subjects S20 = 4 (grade A), S21 = 1.5 (grade D+), S22 = 1 (grade D), …, and S34 = 4 (grade A), respectively.
-
(2.2) The GP-Senior Clustering
In Table 6, the results of GP-Senior clustering wew presented according to defined parameters that are elaborated in Section (2) . All students were assigned into each cluster by the similarity of subjects (S29-S34) grade point. Students have earned these grades in 4th year, as shown in Figure 10.
Table 6. Output of GP-Senior clustering
|
Cluster Number |
Number of Students |
Percentage of students |
CGPA range |
Average value of CGPA |
|
1 |
40 |
13.33 |
2.99-3.82 |
3.32 |
|
2 |
30 |
10.00 |
2.00-2.58 |
2.28 |
|
3 |
52 |
17.33 |
2.06-2.81 |
2.43 |
|
4 |
29 |
9.67 |
2.62-3.29 |
2.97 |
|
5 |
51 |
17.00 |
2.08-3.00 |
2.67 |
|
6 |
49 |
16.33 |
2.18-3.10 |
2.71 |
|
7 |
49 |
16.33 |
2.72-3.51 |
3.13 |
In Figure 10, all clusters have been explored their data patterns and interpreted as 3 rules for the students who want to gain higher achievement in graduation, as follows:
-
(1) If the student wish CGPA 2.43 as average CGPA for this cluster, he/she has to study in each subject not less than the average grade, as following (row Avg.): the subjects S29 ≥ 2.00 (grade C), S30 ≥ 2.28 (grade C+), S31 ≥ 2.13 (grade C+), S32 ≥ 3.23 (grade B+), S33 ≥ 3.10 (grade B+), and S34 ≥ 3.96 (grade A), respectively.
-
(2) If the student wish maximum CGPA in cluster, he/she has to earn grade not less than maximum CGPA that is 2.81, as following (row 1st): the subjects S29 ≥ 2
(grade C), S30 ≥ 3.5 (grade B+), S31 ≥ 3.5 (grade B+), S32 ≥ 3 (grade B), S33 ≥ 3.5 (grade B+), and S34 ≥ 4 (grade A), respectively.
-
(3) If the student wish a minimum CGPA in cluster, he/she has to gain grade not less than minimum CGPA 2.06, as following (row 52th): the subjects S29 ≥ 2 (grade C), S30 ≥ 2 (grade C), S31 ≥ 1 (grade D), S32 ≥ 3 (grade B), S33 ≥ 4 (grade A), and S34 ≥ 4 (grade A), respectively.
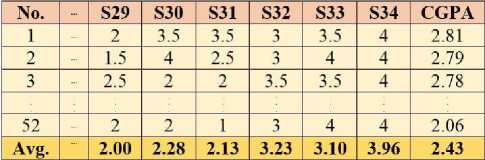
Fig.10. Example cluster 3: Data pattern of GP-Senior clustering
C. Performance of Deployed System
As prescriptive analysis, CGPA prediction model and student clustering mentioned above were implemented as "the study enhancement system." Researchers evaluated this system performance by deploying system with 37 volunteers who studied in Computer Science in 2012. The dataset and testing process were divided as following: (1) DEM3Y-19 datasets and DEM4Y-28 datasets of volunteers were used as input data for CGPA prediction by using MG-Junior and MG-Senior models, respectively, and evaluated the model effectiveness. Then, the CGPA obtained from the model was brought as a variable for clustering. (2) DEC3Y-20 and DEC4Y-29 datasets were added with predicted CGPA from the previous process and used as input of GP-Junior and GP-Junior clustering, respectively.
The results of the comparison between actual CGPA and predicted CGPA from MG-Junior model are shown in Figure 11, while the results of the comparison between actual CGPA and predicted CGPA from MG-Senior model are shown in Figure 12.
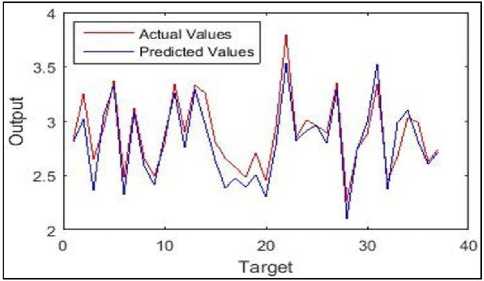
Fig.11. Comparison between actual and predicted values in testing of MG-Junior model
By deploying these models, 37 volunteer students were able to select an expected CGPA to earn in graduation. They were able to find a group of grade point that appropriated themselves by using the results of clustering in Sections (2.1) and (2.2) according to their study years. After that, they used the three rules in their own cluster to consider which study pattern should be followed for enhancing study achievement.
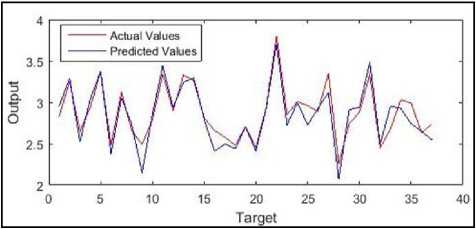
Fig.12. Comparison between actual and predicted values in testing of MG-Senior model
The experiment is using equations (1) to (3) to calculate overall percentage of 37 volunteer students that used each rule of GP-Junior and GP-Senior clustering, as follows:
OP Avg =
N
I i=1
N
I i=1
OPMax = —
N
I l=1
OPMln =
G AvgSample i G AvgMode i
G AvgModeli
1 *100
N
G Max Sample G MaxModel I
1 - 1 *100
G Max Mode l J
N
G MlnSamplei GMlnModeli L^qq
G MlnModeli J
N
When, OPAvg , OPMax , OPMin are percentage of the overall students that used each rule of GP-Junior/GP-Senior clustering. G AvgSample is CGPA average in each cluster of a representative sample. GAvgModel is CGPA average in each cluster of GP-Junior/GP-Senior clustering. G MaxSample is CGPA maximum in each cluster of a representative sample. GMaxModel is CGPA maximum in each cluster of GP-Junior/GP-Senior clustering. G MinSample is CGPA minimum in each cluster of a representative sample. GMinModel is CGPA minimum in each cluster of GP-Junior/GP-Senior clustering. N is a number of clusters.
Table 7 below shows overall percentage of each rule for all volunteers in GP-Junior model and GP-Senior model. It was found that volunteers used CGPA average and CGPA minimum rules in each cluster of both models. An overall percentage shows positive values as 2.17, 1.90 for CP-Junior model and 10.88, 8.48 for GP-Senior model. This result reflects that students possibly have better study achievement when they use these two rules for self-assessment. However, the result of using CGPA maximum rule shows a negative value as -4.44 for CP-Junior model and -2.40 for GP-Senior model. It turns out that volunteers achieved CGPA lower than rule-based CGPA. This scenario can be explained that students might want to improve themselves, they did not try enough. As a result, they were incapable to achieve maximum CGPA as the rule prescribed. The overall results reveals that 37 volunteers have been improved in study achievement by our two proposed rules as a selfassessment.
Table 7. The overall percentage of using data pattern rules of clustering
|
Cluster Number |
Percentage of Using Data Pattern Rule |
|||||
|
GP-Junior Clustering |
GP-Senior Clustering |
|||||
|
Average value of CGPA |
CGPA Maximum |
CGPA Minimum |
Average value of CGPA |
CGPA Maximum |
CGPA Minimum |
|
|
1 |
5.09 |
-3.13 |
14.23 |
4.22 |
0.79 |
1.67 |
|
2 |
2.09 |
-6.81 |
9.27 |
8.77 |
-3.88 |
24.00 |
|
3 |
1.33 |
6.31 |
5.86 |
5.76 |
2.14 |
17.48 |
|
4 |
0.38 |
-9.35 |
15.57 |
-3.70 |
-6.08 |
-6.49 |
|
5 |
0.42 |
-11.59 |
9.36 |
1.87 |
-1.00 |
18.27 |
|
6 |
0.68 |
1.19 |
-3.14 |
-2.95 |
-4.52 |
-3.67 |
|
7 |
5.20 |
-7.72 |
25.00 |
-0.64 |
-4.27 |
8.09 |
|
OP (%) |
2.17 |
-4.44 |
10.88 |
1.90 |
-2.40 |
8.48 |
-
IV. Conclusions
Our study has presented an analysis of real-world data of students in curriculum Computer Science, Faculty of Science and Technology, Sakon Nakhon Rajabhat University. Data of 300 students were used for building the study enhancement system for 3rd year and 4th year students. The data were divided into two parts, including (1) DM3Y-19 and DM4Y-28 were used as input of Neural Network algorithm for creating CGPA prediction models, and (2) DC3Y-20 and DC4Y-29 were used as input of K-means algorithm for grouping students into 7 clusters by means of grade point similarity. The results of the proposed system showed that it had high performance in CGPA prediction. Also, the founded data patterns which were interpreted as 3 rules can be considered as self-guidelines for improving a study achievement.
In addition, researchers did prescriptive analysis by deploying this system on volunteers of 37 students. The results of coefficiency of correlation analysis for prediction model of 3rd year students and 4th year students are 0.93136 and 0.93431, respectively. These results reflect that both CGPA prediction models indicate a strong prediction performance. Furthermore, 3rd year and 4th year students can find their study achievement group according to their data that are integrated from predicted CGPA and a history of study data. By exploring through their study achievement groups, students possibly bring the data patterns as rules of self-guideline to improve their learning behaviors. The experimental results of proposed system show that the students have improved their study achievement for their ideal CGPA in graduation.
Acknowledgment
The authors wish to thank the Office of Academic Promotion and Registration, Sakon Nakhon Rajabhat University, Thailand that supports the dataset. We also thank Mr. Khomyuth Chaiwong from Loei Rajabhat University of his assistance and advice for MATLAB programming. We also thank Mr. Nattapon Kumyaito from University of Phayao, and Mr. Kriangkamon Khumma for their assistance and advice on the English expression in this document.
References Enhancing Efficient Study Plan for Student with Machine Learning Techniques
- M. S. Amirah., H.Wahidah, and A.R. Nuraini, "A Review on Predicting Student's Performance using Data Mining Techniques", Procedia Computer Science, vol. 72, 2015, pp. 414 – 422.
- A. Shaterloo and G. Mohammadyari,"Students counselling and academic achievement", Procedia - Social and Behavioral Sciences, vol.30, 2011, pp.625-628.
- H. Choi and Y.Kang, "Statistical Data Analysis and Prediction Model for Learning Assessment in Korean High Schools Based on EduData", International Journal of u- and e- Service, Science and Technology, vol.9, No. 1, 2016, pp.117-122.
- A. K. Pal and S. Pal, " Classification Model of Prediction for Placement of Students", International Journal of Modern Education and Computer Science, vol. 5, No.11, 2013, pp. 49-56
- A. Mueen, B. Zafar, and U.Manzoor, "Modeling and Predicting Sudents' Academic Performance Using Data Mining Techniques", International Journal of Modern Education and Computer Science, vol.8, no.11, 2016, pp. 36-42.
- P. Flach, "Machine Learning: The Art and Science of Algorithms That Make Sense of Data". Cambridge: Cambridge University Press. http://dx.doi.org/10.1017/CBO9780511973000, 2012.
- G.Jianghua, et al., "Prediction of Power Generation in China Using Process Neural Network", International Journal of u- and e- Service, Science and Technology", vol.8, no.5, 2015, pp.141-146.
- P. Rahul, C. Pavan, and M. Abhishek, "Disease Prediction System using Data Mining Hybrid Approach Communications on Applied Electronics (CAE)", Foundation of Computer Science (FCS), New York, USA, vol. 4, no.9, 2016, pp. 48-51.
- T. T. El-Midany, M. A. El-Baz, and M. S. Abdelwahed, "Improve Characteristics of Manufactured Products Using Artificial Neural Network Performance Prediction Model", International Journal of Recent advances in Mechanical Engineering (IJMECH), vol. 2, no. 4, 2013, pp. 23-34.
- S. D. Snehal and V. R., "Agricultural Crop Yield Prediction Using Artificial Neural Network Approach", International Journal of Innovative Research in Electrical, Electronic, Instrumentation and Control Engineering, vol. 2, Issue 1, 2014, pp. 683-686.
- P. M. Arsad, N. Buniyamin, and J. A. Manan, "Neural Network Model to Predict Electrical Students' Academic Performance", International Congress on Engineering Education (ICEED), Park Royal Penang Malaysia, 2012, Dec 5-7.
- C. E. Moucary, M. Khair, and W. Zakhem, "Improving Student's Performance Using Data Clustering and Neural Networks in Foreign-Language Based Higher Education", IJJ: The Research Bulletin of Jordan ACM, V o l . 2, No. 3, 2011, pp.27-34.
- S. Huang, "Predictive Modeling and Analysis of Student Academic Performance in an Engineering Dynamics Course", All Graduate Thesis and Dissertations, 2011.
- S. Huang and N. Fang, "Predicting Student Academic performance in an Engineering dynamics course: A Comparison of Four types of Predictive Mathematical Models", Computer & Education, vol. 61, 2013, pp.133-145.
- B. Rahmani and H. Aprilianto, "Early Model of Student's Graduation Prediction Based on Neural Network", TELKOMNIKA, vol.12, no.2, 2014, pp. 465-474.
- U. B. Mat, N. Buniyamin and P. A. Arshad, "Educational Data Mining Classifier for Semester One Performance to Improve Engineering Students Achievement", Middle-East Journal of Scientific Research, vol. 24, no. 2, 2016, pp. 338-346.
- A. A. Mashael and A. Muna, "Predicting Students Final GPA Using Decision Trees: A Case Study", International Journal of Information and Education Technology, vol. 6, no. 7, 2016, pp. 528-533.
- A. Padmapriya, "Prediction of Higher Education Admissibility using Classification Algorithms", International Journal of Advanced Research in Computer Science and Software Engineering, vol.2, no. 11, 2012, pp. 330-336.
- O. C. Asogwa and A. V. Oladugba, "Of Students Academic Performance Rates Using Artificial Neural Networks (ANNs)", American Journal of Applied Mathematics and Statistics, vol. 3, no. 4, 2015, pp.151-155.
- K. Adhatrao, et al., "Predicting Students' Performance using ID3 and C4.5 Classification Algorithm", International Journal of Data Mining & Knowledge Management Process., vol. 3, no. 5, 2013, pp. 39-51.
- P. A. Kumar and S. Pal, "Analysis and Mining of Educational Data for Predicting the Performance of Students", International Journal of Electronics Communication and Computer Engineering, vol. 4, Issue 5, 2013, pp. 1560-1565.
- T. Mishra, D. Kumar, and S. Gupta, "Mining Students' Data for Performance Prediction", Fourth International Conference on Advanced Computing & Communication Technologies, 2014, pp. 255-262.
- M. Pandey and S. Taruna, "A Multi-level Classification Model Pertaining to The Student's Academic Performance Prediction", International Journal of Advances in Engineering & Technology, vol. 7, Issue 4, 2014, pp. 1329-1341.
- S. Kotsiantis, C. Pierrakeas, and P. Pintelas, "Predicting Students' Performance in Distance learning using Machince Learning Techniques", Applied Artificial Intelligence, vol. 5, 2010, pp. 411-426.
- P.M. Arsad, N. Buniyamin and J.-L.A. Manan, "Neural Network Model to Predict Electrical Students' Academic Performance", IEEE International Conference, 2012, pp. 1-5.
- P.M. Arsad, N. Buniyamin and J.-L.A. Manan, "Prediction of Engineering Students' Academic Performance Using Artificial Neural Network and Linear Regression: A Comparison", IEEE 5th Conference on Engineering Education (ICEED), 2013, pp. 43-48.
- A.Tekin, "Early Prediction of Students' Grade Point Averages at Graduation: A Data Mining Approach", Eurasian Journal of Educational Research. Issue 54, 2014, pp. 207-226.
- O. J. Oyelade , O. O. Oladipupo, and I. C. Obagbuwa, "Application of k-Means Clustering algorithm for prediction of Students' Academic Performance", International Journal of Computer Science and Information Security, Vol. 7, No. 1, 2010, pp. 292-295.
- N. A. M. Nasir, N. S. Rasid, and N. Ahmad, "Grouping Students Academic Performance Using One-Way Clustering", International journal of Science Commerce and Humanities, Vol.2, No. 3, 2014, pp. 131-138.
- MATLAB, "MATLAB Environment", from http://www.mathworks.com/products/matlab/, 2016.
