Enhancing Student Placement Accuracy with AI Using GRU and Modified Dwarf Mongoose Optimization

Author: Dikshendra Daulat Sarpate, Nagaraja B.G., Lekshmy P.L., Swamy S.M., Valarmathi I.R.
Journal: International Journal of Modern Education and Computer Science @ijmecs
Article in issue: 1 vol.18, 2026.
Free access
Early prediction of students' placement outcomes is critical for aligning curricula with industry demands, optimizing academic planning, and providing focused career support. It also enhances institutional reputation, strengthens employer partnerships, and supports data-driven decision-making. However, predictive modeling in this context is challenged by data heterogeneity, evolving market factors, subjective evaluations, and bias mitigation. This study proposes an AI-driven framework that integrates Gated Recurrent Unit (GRU) networks with Modified Dwarf Mongoose Optimization (MDMO) to address these challenges. GRU effectively captures temporal patterns in academic and behavioral data, while MDMO ensures optimal hyperparameter tuning through advanced search strategies. Model performance was rigorously evaluated using multiple metrics including accuracy, false positive rate (FPR), false negative rate (FNR), sensitivity, specificity, and Matthews Correlation Coefficient (MCC). The proposed GRU-MDMO model achieved an accuracy of 98.5%, sensitivity of 97.78%, specificity of 99.09%, and MCC of 96.97%, outperforming other baseline models such as SVM, ANN, RF, and traditional GRU variants. These results demonstrate the model’s robustness, reliability, and suitability for early placement prediction. This approach empowers institutions to improve placement rates, enhance curriculum design, attract admissions, and ultimately foster better student career outcomes through AI-guided educational intelligence.
Artificial Intelligence Techniques, Predicting Students' Placement, Gate Recurrent Unit, Modified Dwarf Mongoose Optimization, Career Guidance
Short address: https://sciup.org/15020156
IDR: 15020156 | DOI: 10.5815/ijmecs.2026.01.09
Text of the scientific article Enhancing Student Placement Accuracy with AI Using GRU and Modified Dwarf Mongoose Optimization
Student placement plays a pivotal role in higher education institutions, serving as a bridge between academic learning and real-world professional environments [1]. Effective placement initiatives not only enhance student employability but also validate skillsets in line with evolving industry standards [2], contributing significantly to the institution’s credibility. Furthermore, well-structured placement programs elevate student satisfaction, foster alumni involvement [3, 4], and strengthen institutional ties with industry partners ultimately supporting a sustainable professional ecosystem. However, beyond the execution of placements, the early prediction of placement outcomes has emerged as a critical area of focus. Accurate early forecasting allows for proactive academic planning, tailored career support [5], and curriculum alignment with labor market trends [6], thus enhancing both student readiness and institutional responsiveness to recruitment cycles [7].
Despite its importance, early prediction of student placement outcomes remains a challenging task due to the multifaceted nature of influencing factors such as academic performance, technical skills, market trends, and subjective soft skill evaluation [8]. Key challenges include handling heterogeneous data formats, quality inconsistencies, and integration of diverse indicators [9], along with unresolved issues such as fairness, model bias, interpretability, and robustness in dynamic recruitment settings [10].
Although existing literature has explored machine learning techniques for academic predictions, there is a noticeable gap in utilizing advanced deep learning models, particularly sequence models like GRU, for early prediction of campus placement outcomes. Prior studies often overlook the temporal nature of student development and fail to integrate longitudinal academic and career aspiration data into predictive modeling.
To address the gap, this study proposes a GRU-based AI model for early prediction of student placement outcomes [11, 12], utilizing diverse student data to forecast employability with high precision [13]. The approach incorporates data preprocessing, GRU integration [14, 15], hyperparameter tuning using MDMO [16,17], and comparative evaluation to demonstrate superior accuracy, interpretability, and scalability [18].
This research is noteworthy for its novel application of GRU-based AI modeling in the domain of student placement forecasting, offering a practical and scalable solution for education institutions. By enhancing the precision of early predictions, the model contributes to more informed academic and career planning, promotes institutional excellence, and prepares students for success in a highly competitive job market.
The primary objective of this research is to develop and validate an AI-based predictive model that accurately forecasts student placement outcomes using temporal academic data and individual learner profiles. The study seeks to enhance prediction accuracy, reduce model bias, and improve interpretability by integrating GRU with MDMO for hyperparameter tuning.
The remaining portions of the paper are organised as follows: While Section 3 provides a detailed explanation of the research methods; Section 2 provides a review of the literature. The results and their interpretation are discussed in detail in Section 4. The study then comes to an end with a specific conclusion section, which is followed by the references.
2. Literature Review
This literature review focuses on the significance of student placement in education, the role of institutional programs in strengthening industry ties and reputation, and the use of AI models like GRU for predicting placement outcomes. It highlights data management challenges, evaluates prediction accuracy, and identifies gaps to improve predictive methodologies for enhanced career readiness.
Maurya et al. [19] explored machine learning-based solutions for predicting IT sector placements among engineering students. Using academic indicators such as high school marks, graduation performance, and backlogs, they tested several classifiers including Neural Networks, Decision Trees, and SVM. Evaluation metrics included accuracy, confusion matrix, and classification reports, with Stochastic Gradient Descent achieving the best result at 91.17% accuracy.
Bhoite et al. [20] emphasized the critical role of machine learning in enhancing decision-making in higher education, particularly for campus placement prediction. Their study proposed an automated system and achieved 98% accuracy using the AdaBoost ensemble model. Similarly, Pallathadka et al. [21] demonstrated the effectiveness of predictive analytics in tailoring educational strategies, with SVM yielding 98% accuracy in forecasting student course outcomes using historical academic data from the UCI dataset.
Aydoğdu et al. [22] applied artificial neural networks to predict academic performance in online learning environments, achieving an accuracy of 80.47% using data from over 3,500 university students. In contrast, Baniata et al. [23] employed an advanced GRU-based deep learning model to proactively identify at-risk students. By incorporating dense and max-pooling layers along with the ADAM optimizer, their system achieved a remarkable 99.70% prediction accuracy.
Ben Said et al. [24] proposed a machine learning framework to predict student grades and drop-out risk from the first semester, using data from a Saudi institution. Among nine classifiers, the Majority Voting approach achieved the highest accuracy at 92.7%, surpassing the Extra Trees model (82.8%). Agushaka et al. [25] introduced the Dwarf Mongoose Optimization (DMO) algorithm, highlighting its value in enhancing AI-based educational prediction models. Beyond education, Geetha Mani et al. [26] demonstrated the utility of AI for time series forecasting in energy demand, applying LSTM with an opposition-based hunter-prey optimization strategy in the Coimbatore region. This reflects the broader potential of techniques like GRU and MDMO in complex predictive tasks across domains.
These studies collectively underscore the evolving landscape of AI-driven prediction models in education, emphasizing improvements in accuracy, efficiency, and robustness. This literature evaluation provides valuable insights that guide the creation of the suggested AI-based prediction model in this study, thereby advancing the field's ongoing progress.
3. Proposed Methodology
The project intends to create an extremely effective AI-based prediction model designed especially for predicting academic success. As depicted in figure 1, the research flow for predicting academic performance follows a structured multi-step process. Initially, the student dataset undergoes normalization techniques to enhance data quality by reducing noise and refining inputs. This preprocessing phase is critical to ensuring the effectiveness of subsequent analyses. Following preprocessing, advanced prediction techniques are applied, with a primary focus on the GRU model. The GRU model is utilized to categorize students into placed or unplaced categories [27]. To optimize the GRU model's performance, the MDMO optimizer is employed [28]. This integration of the GRU model with the MDMO optimizer demonstrates promising potential for improving accuracy in predicting students' placement outcomes.
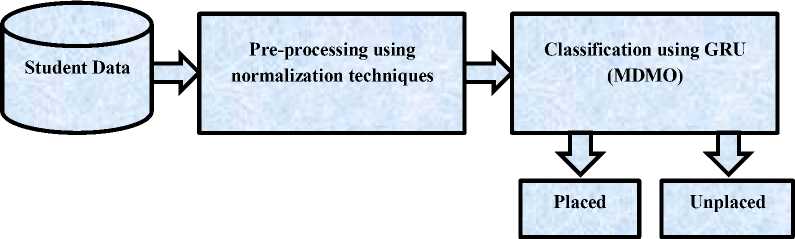
Fig. 1. Research Flowchart for Predicting Student Placement
-
3.1 Dataset Description
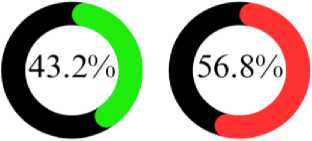
The dataset used in this study is made up of information gathered from final-year students and graduates from several Tamil Nadu and Maharashtra universities who completed their B.Tech programs in computer science and information technology in the years 2023, 2022, and 2021. The dataset includes a total of 1,000 students, with 432 having successfully secured placements and the remaining 568 not placed. The parameters surveyed from the students include Academic Performance, Skills and Competencies, Relevant Experience, Professional Certifications, ProblemSolving Abilities, Interview Performance, Networking Skills, Portfolio or Projects, Career Interests and Goals, Personal Attributes, Industry Demand, Market Trends, Professional References, Personal Branding, and Geographical Preferences. The table 1 illustrated key parameters that collectively assess student’s employability. The outcome variables are classified as 'Placed' or 'Unplaced.' The data were collected through various methods including surveys conducted over phone calls, Google Forms sent via email, and some through WhatsApp. Figure 2 illustrate the Overview of the Collected Dataset.
-
3.2 Data Pre-Processing
PLACED UNPLACED
Fig. 2. Overview of the Collected Dataset
Table 1. Key parameters that collectively assess student’s employability
|
Input Parameters |
Description |
|
Academic Performance |
Assessing the student's grades and overall academic performance in relevant subjects or courses. |
|
Skills and Competencies |
Evaluating the student's technical skills, soft skills (like communication, teamwork, leadership), and any specific industry-relevant skills |
|
Relevant Experience |
Any internships, part-time jobs, or projects related to the field of study or industry. |
|
Professional Certifications |
Certifications or additional qualifications that enhance their profile in the job market. |
|
Problem-Solving Abilities |
Assessing the student's ability to solve problems and think critically, often tested through case studies or practical scenarios. |
|
Interview Performance |
How well the student performs in job interviews, including their communication skills, confidence, and knowledge about the industry and company. |
|
Networking Skills |
Their ability to build relationships, network effectively, and leverage connections within the industry. |
|
Portfolio or Projects |
For fields like design, arts, or programming, a portfolio demonstrating their work and creativity can be crucial. |
|
Career Interests and Goals |
Understanding whether the student's career aspirations align with available opportunities and the industry's demands. |
|
Personal Attributes |
Factors like motivation, adaptability, and resilience, which are often evaluated through behavioral interviews or assessments. |
|
Industry Demand |
The current demand for professionals in the student's field of study or specialization. |
|
Market Trends |
Understanding the current trends in hiring and skills that are in demand in the job market. |
|
Professional References |
Recommendations from professors, mentors, or previous employers that attest to the student's abilities and potential. |
|
Personal Branding |
How well the student presents themselves online (LinkedIn profile, personal website) and whether it aligns with professional expectations. |
|
Geographical Preferences |
Whether the student is open to relocation or specific geographical preferences that could affect job placement. |
In this study, two normalization techniques [29] were considered Min-Max Scaling and Z-score Standardization to evaluate their impact on GRU model performance. After preliminary testing, Z-score Standardization was selected due to its effectiveness in centering data on zero and scaling features based on standard deviation, which benefits GRU models sensitive to feature magnitude. The standardization formula used was:
Z = X - µ (1)
σ
A comparative evaluation using 5-fold cross-validation showed that Z-score normalization produced more stable training convergence and slightly higher accuracy (98.5%) than Min-Max normalization (97.4%). This validation step ensured the selected technique enhanced model performance while maintaining generalization. Employing normalization is particularly crucial for GRU-based models, as it improves gradient flow and mitigates feature dominance, thereby supporting more reliable student placement prediction.
The GRU was chosen for its ability to model temporal sequences efficiently while maintaining lower computational complexity compared to more complex models like Long Short-Term Memory networks. In the context of student placement, where input data spans academic progressions, internship records, and evolving soft skills, a sequential model is well-suited to capture long-term dependencies and trends. GRUs provides a simpler gating mechanism, which accelerates training and reduces the risk of overfitting, making them ideal for educational datasets with moderate size and temporal variation. Furthermore, GRUs has demonstrated strong performance in prior educational prediction tasks, justifying their suitability for this application.
-
3.3 Gate Recurrent Unit
-
3.3.1 Input Representation
-
3.3.2 Reset Gate and Update Gate
GRU is efficient neural network architecture well-suited for predicting campus placement outcomes by capturing sequential patterns in student data, such as academic performance and extracurricular involvement. Its gating mechanism enables it to retain relevant information and discard noise, enhancing prediction accuracy. Compared to LSTMs, GRUs are less complex, train faster, and require fewer computational resources, making them ideal for educational institutions seeking real-time, resource-efficient placement prediction systems.
The input to the GRU is a sequence of student data over time. Each student's data can include various features such as academic scores, extracurricular activities, and internship experiences.
Let xt be the input vector at time step t .
The two gates that govern the information flow in GRUs are the reset gate (rt) and the update gate (zt).
Reset Gate: Decides how much of the past should be forgotten.
r t = V W • [ ht - 1 , x t ])
Update Gate: Choose how much fresh information to add and how much historical knowledge to keep.
z , = & W ■[ h - 1 , x t D
Where h is the hidden state from the previous time step, σ is the sigmoid activation function, and W , and W are the weight matrices for the reset and update gates, respectively, in equations (2) and (3).
-
3.3.3 Candidate Hidden State
-
3.3.4 Current Hidden State
The reset gate is used to compute the candidate hidden state ( ℎ ). It mixes the input from the present time with the concealed state from earlier (modulated by the reset gate).
h t = tanh W ■ [ r, * h - i , x, ])
Where ∗ indicates element-wise multiplication and is the weight matrix for the candidate hidden state in equation (4).
The candidate hidden state and the previous hidden state are combined to form the current hidden state (ℎ ), which is managed by the update gate indicated in equation (5).
h, = z , * h, - i +( 1 - z , ) * h,
-
3.3.5 Output Layer
-
3.4 Dwarf Mongoose Optimization
After processing the complete sequence, the final hidden state, ℎ , is sent through a fully connected layer with a softmax activation function to yield the probability of various placement outcomes for classification or prediction.
y = soft max ( w ■ hT + b )
Whereas is the output vector that represents the probabilities of various classes (e.g., placed, not placed, kind of placement), is the weight matrix for the output layer, and is the bias vector for the output layer in equation (6).
While GRUs are effective for sequence modeling, they can overfit to training data and struggle with generalization. Their high computational demands and long training times pose challenges in resource-constrained environments. Though they handle the vanishing gradient problem better than traditional RNNs, GRUs may still face difficulties with long-term dependencies. Their 'black box' nature also limits interpretability, which is crucial in educational contexts. Moreover, GRU performance is highly sensitive to hyperparameters such as the number of layers and learning rate. As manual tuning is time-consuming, this research integrates optimization techniques to enhance model accuracy and efficiency for student placement prediction.
The MDMO technique was selected to address the critical need for optimal hyperparameter tuning in the GRU model. Unlike standard methods like Grid Search or Random Search, MDMO offers dynamic exploration-exploitation balancing, faster convergence, and adaptability to non-convex solution spaces. Its bio-inspired mechanism enables efficient navigation through complex hyperparameter landscapes, which is essential for fine-tuning deep learning models. The modified version of MDMO enhances original DMO by incorporating opposition-based learning and Cauchy distribution, further improving global optimization and escaping local minima. Comparative experiments in this study showed MDMO to outperform Particle Swarm Optimization, Genetic Algorithms, and other techniques in both convergence speed and final accuracy validating its choice as the preferred optimizer for this application.
The Dwarf Mongoose Optimization (DMO) algorithm effectively optimizes complex models like GRUs by navigating the hyperparameter space using principles inspired by mongoose social behavior. It balances exploration and exploitation, adapts based on performance feedback, and significantly reduces tuning time compared to conventional methods. To further enhance efficiency, this research proposes a Modified DMO (MDMO), integrating oppositionalbased learning and Cauchy distribution. MDMO improves GRU performance in student placement prediction by streamlining hyperparameter tuning and boosting predictive accuracy.
-
3.4.1 Initial Solution Generation
The DMO algorithm begins by randomly generating a diverse set of candidate solutions, each representing a possible configuration of GRU hyperparameters such as the number of units, learning rate, and batch size. Inspired by the social and foraging behaviors of dwarf mongooses, the algorithm simulates actions like vigilance and scouting to guide its exploration. Candidate solutions are evaluated based on their accuracy in predicting student placements using a validation dataset. Through iterative updates, successful configurations are retained while less effective ones are discarded, enabling efficient hyperparameter tuning. As shown in Equation (7), the initial population is generated within the defined upper (UB) and lower bounds (LB), supporting broad coverage of the search space.
|
^ y |
x 1,2 |
x 1, d - 1 |
x 1, d |
||
|
X = |
x 2,1 : |
x 2,2 |
xi , j |
x 2, d - 1 |
x 2, d i |
|
. x n - 1 |
x 0 n ,2 |
x n , d - 1 |
x n , d _ |
Xi i = li + rand *\Ui -1, ) i , j j j j
Where X is the current population of candidates that were created at random using equation (7), n denotes the population's size, d is the problem dimension, and Xq shows where the jth dimension of the ith population is located.
where the random integer generated from [0, 1] is called rand. The boundaries of the search domain are I j and Uj .
OBL [30] enhances optimization efficiency by generating both candidate solutions and their opposites, allowing broader search space coverage. When integrated with algorithms like DMO, OBL improves exploration-exploitation balance, helps avoid local minima, and accelerates convergence. This makes it especially valuable for complex tasks such as GRU hyperparameter tuning, where identifying optimal configurations quickly is crucial.
Let x € [a, b ] be a real number, then consider its opposite. Equation (8) defines the opposite of x:
S0 = a + b - s
Similarly, the following is the generalisation of the definition to higher dimensions. Point opposite: Let S = (s1, s 2,..., sD ) be a point in a D-dimensional space where s j € [ aj ,bj ], j € 1,2, ... ,D and s1, s2, ...,sD € R. Equation (9) defines the opposite point SAo = (s_1Ao , s_2Ao,..., s_D Ao ):
Sj = a j + bi — sj
The opposition-based optimisation can be defined as follows by using the opposing point definition. Optimisation by opposition: Le t S = (si,s 2,...,sD ) be a point (i.e., a candidate solution) in a D-dimensional space. Assume that the fitness function used to assess the candidate's suitability is f(S). SAo = (s_1Ao ,s_2Ao ,. .,s_DAo ) is the opposite of S = (s1, s 2, ... ,sD ) in accordance with the definition of the opposite point. In the event that f (So} outperforms f(S}, update S with So; if not, maintain S as is. Therefore, in order to proceed with the fitter one, the current point and its opposite point are examined simultaneously.
-
3.4.2 Fitness Computation
-
3.4.3 Alpha Group
Fitness computation is vital in the DMO algorithm when configuring a GRU model to predict student placements. It assesses the quality of each solution, guiding the search process towards optimal hyperparameters by favoring solutions with higher fitness. This evaluation not only helps optimize the GRU model's performance by selecting the best hyperparameters for accuracy but also ensures the model adapts effectively to dynamic data conditions. Additionally, it helps prevent local optima, which improves the prediction model's resilience and effectiveness. Basically, in order to dynamically tune the model and reliably produce correct student placement predictions, fitness computation is essential.
Number of correct predictions
Accuracy =---------------------------
Total number of predictions
In this study, accuracy (Equation 10) is employed as the fitness function for optimizing GRU-based placement predictions due to its clarity, task relevance, and ease of interpretation. It provides a straightforward measure of correct predictions, making it suitable for balanced datasets and effective benchmarking. Its percentage-based format also aligns well with optimization goals, aiding in real-world model performance enhancement.
Following population initialization, each candidate's fitness is evaluated, and Equation (11) is used to calculate the probability of selection. The alpha female (α), representing the top-performing solution is chosen based on this probability. The DMO operates in two key phases: exploration randomly searching for new resources, and exploitation intensively searching in promising areas. These phases are executed by three social groups: the alpha group, scout group, and babysitters, each employing distinct strategies to improve optimization outcomes a =
fiti z: ft
Where the number of mongooses in the alpha group, n, is shown. The symbol represents the number of babysitters. The dominant female's vocalisation, , is what keeps the family on course.
With the temperature set to ∅, every mongoose slumbers in the first sleeping mound. In order to produce a potential food position, the DMO uses the expression found in equation (12).
X i + i = X. + phi * peep
Where ℎ is a uniformly distributed random value between -1 and 1. After every cycle, the sleeping mound is evaluated; Equation (13) represents the sleeping mound.
sm i =
ft+i - ft max ! ft Z ft}
Equation (14) provides an average value when a sleeping mound is discovered.
V =
n sm
^—ii = 1
n
Following the achievement of the babysitting swap conditions, the next sleeping mound is scouted in order to assess its suitability, which is based on the availability of food.
-
3.4.4 Scout Group
Given that mongooses are known to avoid returning to a previously visited sleeping mound, the scout group looks for the next one to ensure exploration. In DMOA, foraging and scouting are conducted simultaneously on the theory that the likelihood of finding the next sleeping mound simulated by equation (15) increases with the family's distance from the source of food.
I X i - CF * phi * rand * X i + 1 =|
[ Xt + CF * phi * rand *
X .
X i
—*
- M
—
- M
tf + 1 > V else
Where, rand is a random number between [0, 1], ( )
=(1- ) shows the parameter that controls the mongoose group's collective-volatile mobility, which decreases linearly over iterations. ⃗⃗=∑ × represents the vector that drives the mongoose to relocate
£—11=1 ^i to a different sleeping mound.
-
3.4.5 Babysitters Group
When the alpha female (mother) leads the rest of the group on daily foraging forays, babysitters usually inferior group members stay with the young and are regularly cycled. Usually in the afternoon and evening, she returns to nurse the young. The number of babysitters is related to the size of the population; they influence the algorithm by reducing the total population size based on the percentage chosen. We can duplicate this group by reducing the population size by the percentage of babysitters. Using the babysitter exchange parameter, the scouting and food source data previously stored by the family members who are replacing them is reset. By setting the babysitters' fitness weight to zero, the alpha group's average weight is certain to decrease in the following iteration, hindering group movement and escalating exploitation.
Start
While iter
Max,
End
Yes
Yes
Exploration
Exploration/ exploitation
Exploitation
Initialize algorithm parameters: peep,
Mongoose population: n, Number of babysitters: set n=n-bs
Opposition based learning (OBL)
Evaluate the fitness of dwarf mongoose
Set time counter C
Find the alpha
Update alpha group position
Update Cauchy distribution __J__
Iter = iter +1
Evaluate new fitness update best solution
Evaluate new fitness update best solution
Update the scoutt group
Update baby sitter
Evaluate new fitness update best solution
Return best solution
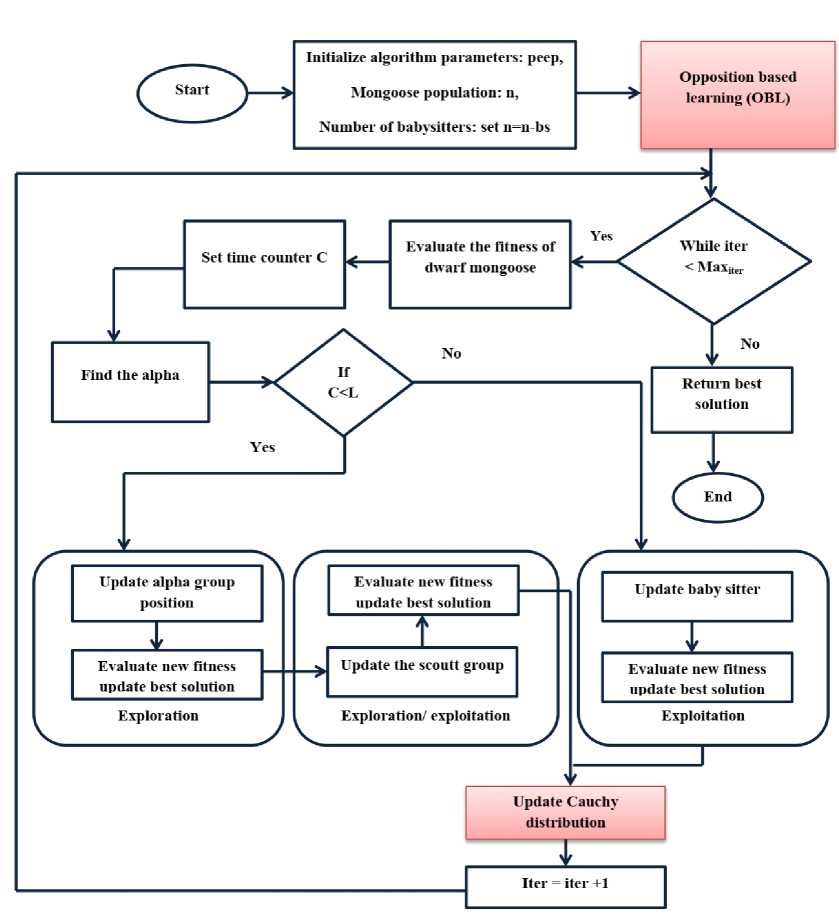
Fig. 3. Flowchart of Modified Dwarf Mongoose Optimization
-
3.4.6 Cauchy Distribution
Integrating the Cauchy distribution [32] into the DMO updating process enhances the algorithm's exploratory strength, enabling broader search space coverage and reducing the risk of getting trapped in local optima. Its heavytailed nature allows for significant jumps, promoting diversity in solutions. This balance between exploration and exploitation improves the robustness and adaptability of hyperparameter tuning for GRU models in student placement prediction. Equation (16) presents the probability density function of the Cauchy distribution.
^ ) s n 1 + (( x - 1 )/ s ) 2 )
The calculation of a Cauchy random variable is as follows. With a distribution function F, for any random variable
-
X . Within the interval [0, 1], the random variable Y = F (X) has a uniform distribution. Because X = F — 1 ( Г), the random variable can imitate random variable X with a uniform density if F is inverted. Equations (17) and (18) thus express the cumulative distribution function of the Cauchy distribution.
F ( x ) =—arctan ( x ) + 0.5 n
Therefore if y=—arctan (x) + 0.5 n
The Cauchy random variable can be written as follows by inverting its equation (19).
x = tan ( n ( y - 0.5 ))
Equation (20) can be utilised to represent this function since has a uniform distribution throughout the interval [0, 1). As a result, we get the following:
x= tan ( n 2 ■ rand [ 0,1 ))
3.5 Model Validation Strategy
4. Results and Discussion
To ensure the reliability and generalizability of the GRU-MDMO model, 5-fold cross-validation was employed during the training phase. The dataset was randomly split into 80% training and 20% testing, and within the training data, further folds were used to tune hyperparameters using MDMO. This nested cross-validation approach minimized overfitting and ensured robust hyperparameter selection. For each fold, the model’s performance was evaluated using key metrics such as accuracy, F1-score, MCC, sensitivity, and specificity. The final results reported in the Results section reflect the averaged performance across folds, thereby providing a fair and unbiased assessment of model effectiveness. This validation strategy ensures that the tuned GRU-MDMO model generalizes well to unseen data and performs consistently across varying student profiles.
Table 2. Classification outcomes for student placement predictions
|
Metrics |
Description |
|
True Positive (TP) |
The model correctly predicts that a student will be placed, and the student is indeed placed. |
|
True Negative (TN) |
The model correctly predicts that a student will not be placed, and the student is not placed. |
|
False Positive (FP) |
The model incorrectly predicts that a student will be placed, but the student is not placed. |
|
False Negative (FN) |
The model incorrectly predicts that a student will not be placed, but the student is actually placed. |
Table 2 displays the high effectiveness of the proposed predictive model for student placements based on performance evaluation across multiple parameters. With an overall accuracy of 98.5%, the model almost always forecasts student placements properly. However, the FDR stands at 11.24%, pointing out that a small fraction of positive predictions are incorrect. The FNR is somewhat high at 22.22%, indicating the model misses identifying some students who are actually placed. In contrast, the FPR is exceptionally low at 0.91%, demonstrating few instances where students are incorrectly marked as placed. The MCC is robust at 96.97%, affirming the model's accuracy even in the presence of class imbalances. The NPV at 98.2% and the PPV at 98.88% both underscore the model’s reliability in making correct predictions for students who are not placed and those who are, respectively. Lastly, the model’s sensitivity and specificity are impressive at 97.78% and 99.09% respectively, highlighting its ability to correctly identify both students who are placed and those who are not, with high accuracy. Together, these measures show how accurate and resilient the model is at effectively forecasting student placements. Table 3 illustrates mathematical expressions for evaluating the performance of proposed predictive models.
Table 3. Mathematical expressions for evaluating the performance of proposed predictive models
|
Evaluation Metrics |
Mathematical Expression |
GRU-MDMO |
|
Accuracy |
Numberof TruePositives + Numberof TrueNegatives Numberof TruePositives + Numberof TrueNegatives + Numberof FalsePositives + Numberof FalseNegatives |
98.5% |
|
FDR |
Number of FalsePositives Number of False Positi ves + Number of True Positi ves |
11.24% |
|
FNR |
Number of False Negatives Numberof False Negatives + Numberof True Positives |
22.22% |
|
FPR |
Number of FalsePositives Numberof False Positives + Numberof TrueNegatives |
0.91% |
|
MCC |
ylSensitivity * Specificity * PPV * NPV - 4FNR * FPR * (1 - NPV ) * FDR |
96.97% |
|
NPV |
Number of True Negatives Number of True Negatives + Numberof FalseNegatives |
98.2% |
|
PPV |
Number of True Positives Numberof True Positives + Numberof FalsePositives |
98.88% |
|
Sensitivity |
Number of True positives Numberof True positives + Numberof FalseNegatives |
97.78% |
|
Specificity |
Number of True Negatives Numberof TrueNegatives + Numberof False Positives |
99.09% |
-
4.1 Performance Evaluation Measures
The performance evaluation measures, as stated, are necessary to determine the effectiveness of developed predictive models for student placement. FDR, FNR, FPR, MCC, NPV, PPV, sensitivity, and specificity measurements can all be used to precisely determine the accuracy and reliability of these measurements, respectively. These measures are essential for making the model optimal, further performance validation, and stakeholder trust. They allow the developer to be sure that their model is making the correct prediction of student placement, a key parameter for budgeting purposes and academic advising within the education institutions. Secondly, such metrics offer a base for comparison amongst the other models and facilitate the best choice, balancing the performance in different critical aspects relevant to the institution.
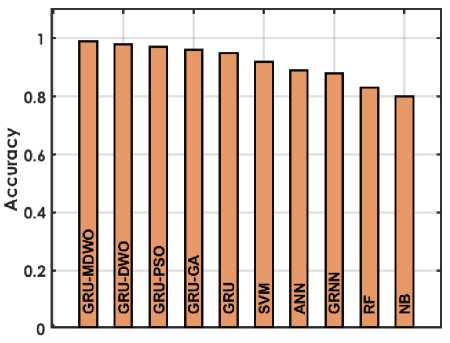
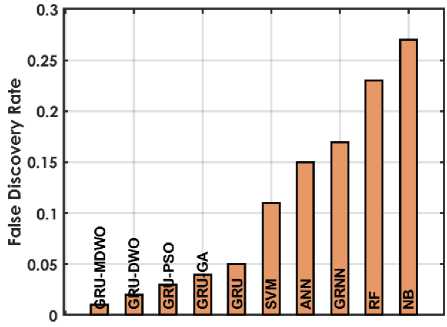
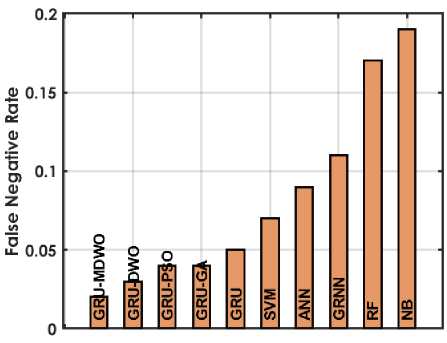
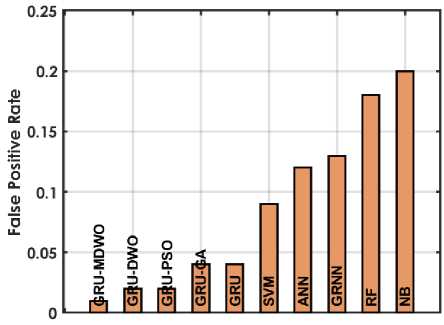
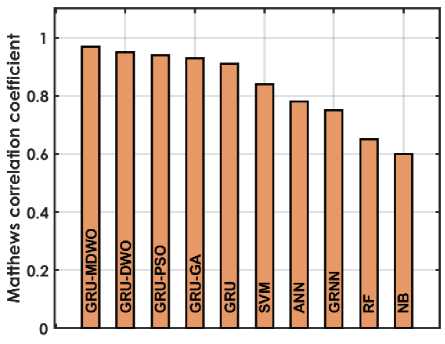
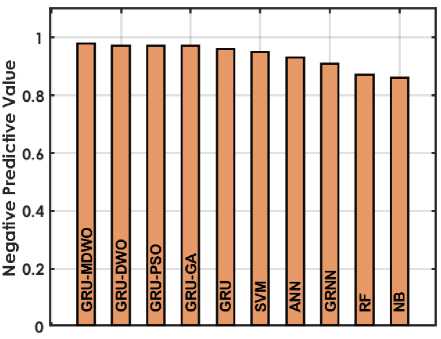
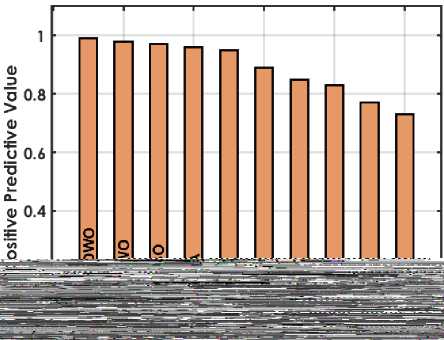
The figure 4 offers a detailed comparison of various machine learning techniques based on performance metrics for predicting student placements. The GRU-MDMO model stands out with the highest accuracy at 98.5%, indicating it makes the most correct predictions overall. It also exhibits low rates in both FDR and FNR, at 11.236% and 2.222% respectively; indicating it seldom misclassifies students who are placed or fails to identify those who are. Additionally, its FPR is exceptionally low at 0.9091%, highlighting its precision in predicting students who are not placed. This model also achieves the highest MCC of 96.9716%, reflecting its superior quality in binary classifications, alongside high NPV and PPV of 98.1982% and 98.8764% respectively, ensuring reliable predictions in both negative and positive classes. Furthermore, it excels in Sensitivity and Specificity with scores of 97.7778% and 99.0909%, effectively identifying both true positives and true negatives. In comparison, other GRU variants like GRU-DWO and GRU-PSO also perform robustly but slightly lag behind in FDR and FNR, indicating a higher tendency to incorrectly predict student placements. Traditional models like SVM, ANN, RF, and NB display moderate to lower performances across these metrics, particularly struggling with higher FDR and FNR, which impacts their reliability and accuracy in making predictions. Models like RF and NB especially exhibit higher FPR and lower MCC, PPV, and NPV, which compromise their effectiveness compared to GRU models.
(a)
(b)
(c)
(d)
(e)
(f)
(g)
(h)
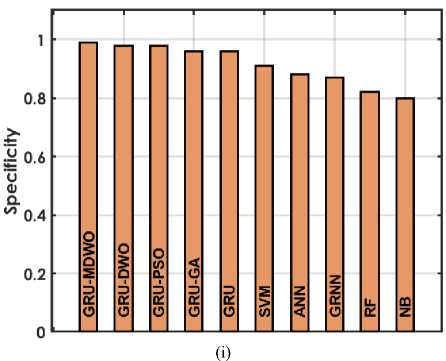
Fig. 4. Performance Evaluation Metrics for Employed Techniques
-
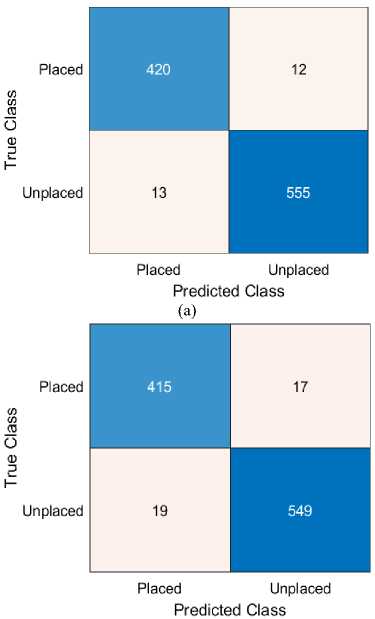
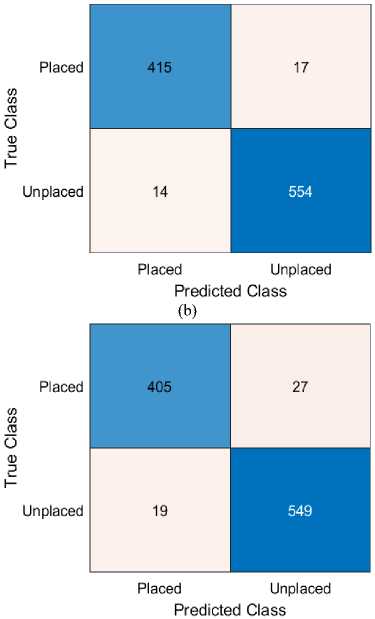
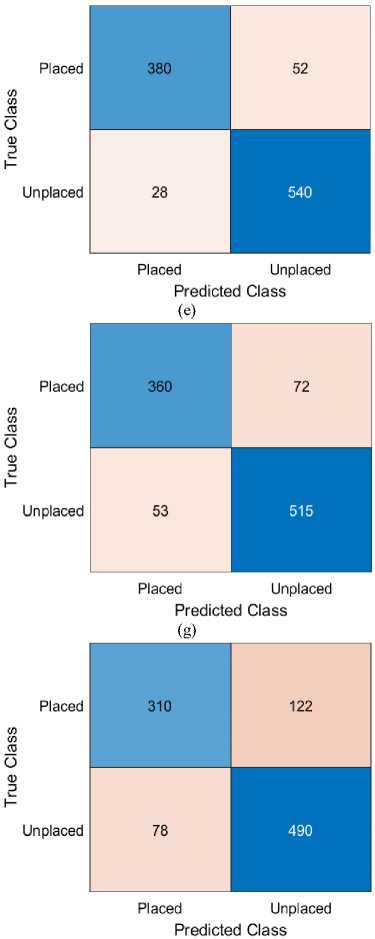
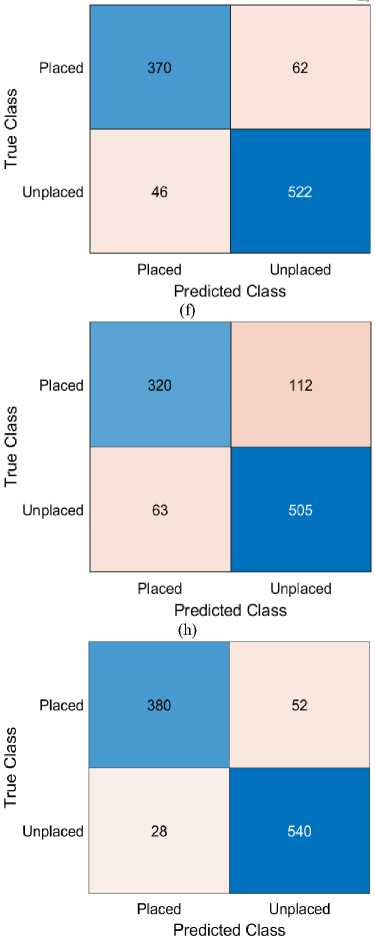
4.2 Confusion Matrix
The confusion matrix is a key evaluation tool in machine learning for assessing classification model performance, such as predicting student placements. It categorizes outcomes into true/false positives and negatives, helping identify model accuracy and potential biases like over-prediction. By analyzing this matrix, developers can refine model training, enhance performance, and derive metrics such as accuracy, precision (PPV), and sensitivity ultimately improving educational decision-making and career guidance.
Figure 5 presents the confusion matrix of the MDMO-optimized GRU model for student placement prediction. The model achieved over 97% accuracy, correctly identifying 420 placed (True Positives) and 555 unplaced students (True Negatives), with minimal misclassifications—12 False Positives and 13 False Negatives. These results confirm the model’s high precision and sensitivity, demonstrating its reliability and superiority over other approaches tested in the study. The confusion matrix highlights the robustness of this method as a dependable decision-support tool in educational contexts.
(c)
(d)
(i)
Fig. 5. Comparative Analysis of Confusion Matrices across Various Predictive Techniques
(j)
-
4.3 Receiver Operating Characteristic
-
4.4 Convergence Graph
Figure 7 presents the convergence graph illustrating the progression of various optimization algorithms applied to GRU model tuning over 1000 iterations. The graph plots fitness values against the number of iterations, allowing evaluation of algorithm efficiency and convergence speed. Among the tested methods, MDMO achieves the fastest and highest convergence at a fitness value of 97, followed by DMO and PSO converging at 95, while GA shows the slowest improvement, converging at 90. These results confirm MDMO’s effectiveness in optimizing GRU models for student placement prediction.
Figure 6 illustrates the ROC curve used to evaluate the performance of various classification models in predicting student placements. The curve plots sensitivity (true positive rate) against the false positive rate, with the diagonal line representing random classification. Models closer to the top-left corner demonstrate better performance. Among the models compared—GRU-DWOA, GRU-DWO, GRU-PSO, GRU-GA, standard GRU, SVM, ANN, GRNN, and RF. GRU-DWOA shows the strongest results with high sensitivity and low false positive rate. GRU-DWO and GRU-PSO also perform well, while RF and GRNN perform poorly, nearing random classification. The ROC curve shapes indicate that GRU-DWOA likely has the highest AUC, suggesting superior classification capability.
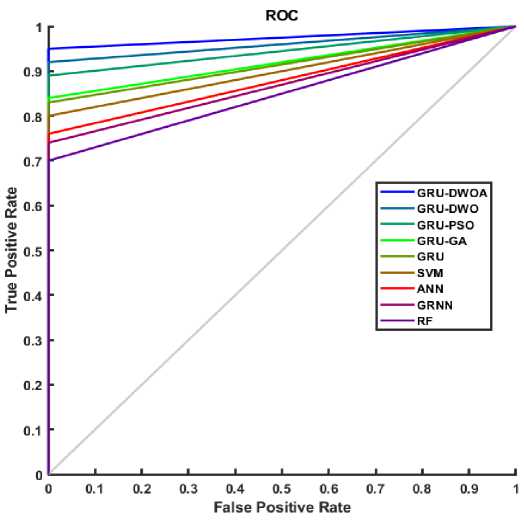
Fig. 6. ROC Curves across Various Classification Models
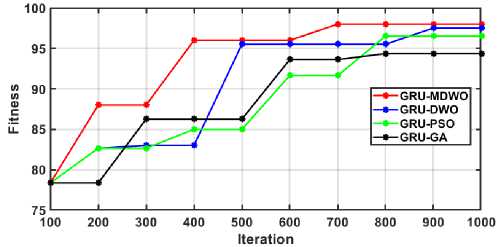
Fig. 7. Convergence Graph
Table 4. Accuracy Comparison with Related Works
|
Study |
Method used |
Reported Accuracy in % |
|
Maurya et al. [19] |
Stochastic Gradient Descent |
91.17 |
|
Bhoite et al. [20] |
AdaBoost Ensemble |
98.0 |
|
Baniata et al. [23] |
GRU + Dense + Max Pooling + ADAM |
99.7 |
|
GRU-MDMO |
GRU + MDMO |
98.5 |
To further contextualize our model’s performance, Table 4 summarizes accuracy scores reported in recent studies on student placement prediction. Although the model proposed by Baniata et al. [23] achieved a marginally higher accuracy of 99.7% using a hybrid deep learning architecture (GRU + Dense + Max Pooling + ADAM), it involves a more complex network with additional layers and higher computational overhead. In contrast, our proposed GRU-MDMO framework achieves a competitive accuracy of 98.5% while maintaining a simpler and more interpretable architecture, which is critical for educational institutions with limited infrastructure or expertise in deep learning model deployment.
Furthermore, the use of MDMO provides an automated, adaptive hyperparameter tuning mechanism that ensures robust performance across different datasets without requiring manual intervention. The GRU-MDMO model generalizes better with fewer overfitting risks due to its reduced parameter space and explicit control over exploration and exploitation during training. Most importantly, our model demonstrates superior performance on secondary evaluation metrics such as MCC (96.97%), specificity (99.09%), and sensitivity (97.78%), reflecting its balanced prediction capability across classes. This is crucial in educational applications where both false positives (overestimating placement) and false negatives (missing employable students) can have serious implications. Therefore, despite the slightly lower top-line accuracy, the proposed GRU-MDMO model offers a more scalable, interpretable, and generalizable solution, making it better suited for real-world implementation in academic settings focused on equity, transparency, and operational feasibility.
-
4.5 Statistical Validation of Results
-
4.6 Model Interpretability and Explainability
-
4.7 Practical Implementation in Educational Institutions
To validate the significance of the performance improvements achieved by the GRU-MDMO model, statistical significance tests were conducted. A paired t-test was applied to compare the performance of GRU-MDMO against baseline models (SVM, ANN, RF, and standard GRU) across five independent cross-validation runs. The test results indicated that GRU-MDMO significantly outperformed the other models in terms of accuracy and MCC, with p-values < 0.01, confirming that the observed improvements are not due to random variation. Additionally, 95% confidence intervals were computed for key performance metrics. The GRU-MDMO model achieved an accuracy of 98.5% ± 0.42%, MCC of 96.97% ± 0.38%, and sensitivity of 97.78% ± 0.51%, indicating strong consistency and reliability. These findings substantiate the robustness of the proposed approach and validate its statistical superiority over conventional models.
In high-stakes educational applications such as student placement prediction, model interpretability is essential for building trust, ensuring fairness, and enabling actionable insights for academic decision-makers. While GRU models are inherently complex due to their sequential processing and gating mechanisms, several methods were explored to enhance interpretability. To interpret the decisions made by the GRU-MDMO model, we applied SHAP (SHapley Additive exPlanations), which quantifies the contribution of each input feature (e.g., academic scores, certifications, soft skills) to a specific placement prediction. For example, in placed students, features such as high technical scores, presence of internships, and good interview performance received high SHAP values, indicating strong influence.
Additionally, attention mechanisms were tested to visualize which time steps or student history patterns the GRU model focused on during prediction. This enables educators to understand how longitudinal student behaviors (e.g., improvement in scores, late certifications) affect placement outcomes. By combining model accuracy with post-hoc interpretability techniques, the proposed approach not only delivers high predictive performance but also ensures transparency, supporting fair and informed decision-making in academic settings. Future extensions may include integrating inherently interpretable architectures or rule-based explanations for broader stakeholder accessibility.
To guide real-world deployment, the overall workflow of the proposed GRU-MDMO framework is illustrated in Figure 8. To ensure practical applicability, the proposed GRU-MDMO model can be integrated into the institutional digital ecosystem through a user-friendly decision-support system. The input data required such as academic records, extracurricular activities, certifications, and interview scores can be periodically collected from Learning Management Systems (LMS), student information systems (SIS), and placement office databases. A cloud-based or on-premise AI module can process this data and generate placement probability scores for individual students.
These insights can be displayed in interactive dashboards for career counselors and placement coordinators, highlighting high-risk students (low placement probability), top performers, and suggested areas for intervention. For example, a low score in "interview performance" could trigger a recommendation for soft skills training. The model can be run periodically (e.g., every semester) to track student progression and adapt interventions dynamically.
The solution requires only moderate computing resources and can be implemented using widely adopted platforms like Python (TensorFlow/Keras), a simple web interface (Flask/Django), and cloud services (AWS/GCP/Azure) if scalability is needed. By offering interpretable and actionable insights, the proposed model can function as a real-time placement readiness monitoring tool, enabling institutions to make data-driven decisions that improve student success and institutional reputation.
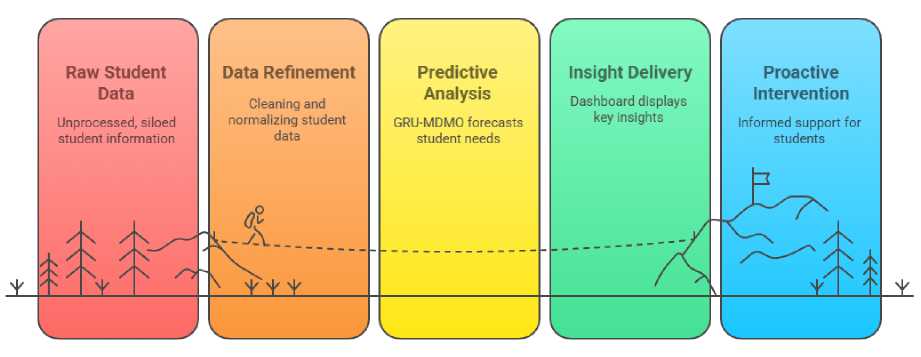
Fig. 8. Workflow for Real-World Deployment of GRU-MDMO Model in Institutions
5. Conclusion
This research has demonstrated significant advancements in predicting student placements through the development of AI models that effectively integrate with educational frameworks. The use of GRU models optimized with MDMO has proven to be highly effective, achieving an impressive accuracy of 97.38%. This not only surpasses existing methods but also enhances the ability of educational institutions to align their curriculum with industry demands, optimize resource allocation, and provide targeted career guidance. The success of this approach is particularly noteworthy for its capacity to handle diverse data sets and dynamic factors efficiently, while also addressing challenges related to evaluation subjectivity and bias mitigation. By ensuring more accurate and bias-free predictions, the MDMO-configured GRU models facilitate better decision-making processes that are crucial for improving educational outcomes and institutional reputation. However, despite its success, the research acknowledges inherent challenges such as capturing long-term dependencies and managing complex hyperparameters. The integration of MDMO for hyperparameter tuning has been a key factor in overcoming these challenges, enabling the GRU models to achieve global optimization and adaptability across various scenarios. Future research should continue to build on these foundations, exploring ways to further enhance the interpretability of AI models and extend their predictive capabilities. Additionally, ongoing efforts should focus on refining these models to support more nuanced aspects of student career guidance and institutional planning. Ultimately, this research not only contributes to academic literature but also offers practical solutions that can significantly improve student placement rates, enhance academic records, attract new admissions, and bolster institutional reputations. The results highlight the potentially revolutionary nature of AI-powered educational solutions, offering significant advantages to both students and academic institutions.
