Environmental assessment of economic growth in the northern region

Author: Tikhonova Tatyana V.
Journal: Economic and Social Changes: Facts, Trends, Forecast @volnc-esc-en
Section: Environmental economics
Article in issue: 3 (57) т.11, 2018.
Free access
The analysis is based on P. Victor model of green growth. From the point of view of conceptual applicability (to diagnose environmental sustainability of economic development) and availability of tools, it is the simplest, most illustrative and universal in the range of indicators. The key parameters of the presented research model are relative indicators of negative impacts on natural systems per unit of economic result. The research novelty lies in taking into account economic and environmental indicators to assess the quality of life and the degree of environmental economic development of Northern regions. Assessment results in the Komi Republic reveal a generally low level of environmental quality of the region’s economic development for 2007-2016. Some progress towards “green” growth was observed in terms of discharge of contaminated wastewater into water surface bodies; stable economic situation in the “brown” growth zone is typical for atmospheric pollutant emissions, the features if “black” growth of economic results determined the volume of formation and disposal of toxic waste of industrial enterprises...
Green economy, environmental indicators of quality of life, eco-intensity, environmental pollution
Short address: https://sciup.org/147224053
IDR: 147224053 | UDC: 504.06 | DOI: 10.15838/esc.2018.3.57.11
Text of the scientific article Environmental assessment of economic growth in the northern region
Economic growth today is often associated with increased pollution and environmental degradation, depletion of natural resources, which limits the opportunities for sustainable development. This means that the quality of life cannot be improved through traditional approaches [1–5]. A change in the development paradigm at the global level was realized at the turn of the third millennium as the objective to construct a post-crisis economy [6]. At present, foreign experience is the main source of studying the specific features of areas, indicators and measures for the implementation of green growth strategies [1, 2, 4, 5, 7, 8]. Russia, facing the problems of “dirty” economic growth, embeds itself into green economic development [3, 6, 9, 10, 11]. Thus, the issue of green economy is addressed to by Institute of Sustainable Development of the Public Chamber of the Russian Federation. The Ministry of Economic Development discusses the experience of OECD and Russian statistics on the measurement of green growth [12]. The Ministry of Foreign Affairs and the Ministry of Natural Resources of Russia participated in the development of the framework strategy for the development of green economy in the European region at the conference “Environment for Europe” on 8–10th July 2016 (in Batumi, Georgia). About a thousand scientific publi-cations are devoted to the implementation of green economic development in Russia. The development of assessment of green growth economy in the regions of Ural and Siberia is manifested in focus of methods and approaches [13–17].
The purpose for the study is to identify the most appropriate indicators for assessing the quality of life, as well as the main positions of green economy in the Northern region as a way of transition to a resource-efficient society. The novelty lies in the evaluation of modern research trends of Northern territories using the P. Victor model scheme. The main tools include relative indicators of negative impacts on natural systems per unit of economic result. The significance of the research lies in determining the methods and measurement algorithm; calculating the levels of environmentalization in order to substantiate the prospect areas of environmental modernization and improvement of population’s quality of life.
The rationale for choice of technique
According to the definition in UNEP reports, green economy promotes human well-being and social justice while significantly reducing environmental risks [2]. The important features of such economy are: efficient use of natural resources; preservation and increase of natural capital; pollution reduction; minimization of carbon emissions; prevention of loss of ecosystem services and biodiversity; growth of income and employment [6]. Due to the fact that green economy is largely consistent with the principles of sustainable development, since the early 1990–s a number of mechanisms for assessing sustainable development has been introduced. They are structured in three categories: indices/indicators; integral/ aggregate indicators; subjective measures of well-being. For the first category there are
Table 1. Assessment indicators and their functions
|
Indicators |
Functions |
|
Basic |
Analysis of the environmental policy |
|
Key (volume, relative and value indicators)* |
Public information; reference point for making management decisions |
|
Sectoral |
Assessment of integration of environmental processes into sectoral strategies reflecting industry trends and interaction with the environment |
|
Environmental accounting |
Assessment of environmental costs; accounting for natural capital in national accounts |
|
* Emissions from mobile and stationary sources, discharges of toxic waste into surface water bodies; relative volumes of emissions, discharges and wastes related to population; volume of payments for negative impact on atmospheric air, water bodies and land within standard values and payments for negative impact within the limits of excess values (total). |
|
several types of sets of indicators reflecting the environmental factor of quality of life ( Tab. 1 ).
Reducing environmental pollution does not guarantee moving towards green economy and is not an indicator of green growth. The figures show the dynamics where the boundary of acceptable or limit values is invisible. Their advantage is that they are accessible, simple, and most common in a variety of reports and documents (state reports, indicators for development programs and strategies, etc.), as well as in decision-making for environmental management. An important point is an attempt to take into account pollution and natural resources depletion damage at the macroeconomic level, environmental adjustment of main economic indicators of development. The disadvantages include heterogeneity and eclecticism, and in most cases, lack of obvious cause-and-effect relations with sustainability [17]. Moreover, these indicators are not recognized abroad and are not sufficient to compare the ecofriendliness of economic processes or quality of life development.
The next methodological approach is related to aggregate indicators, with the main difficulty being in determining the weights of initial indicators. These groups are divided into socio-economic, eco-economic, socio-environmental, and environmental-socioeconomic. Almost all of them are based on GDP adjustment by subtracting environmental damage, social costs, and taking into account the contribution to the citizens’ welfare. A more detailed analysis of these parameters is conducted by E.M. Zomonova in the research report [17]. The advantage of aggregate indicators is the possibility of comprehensive assessment of dynamics and level of development of the society, ensuring the methodological unity of private indicators and variables which form the informational framework for the calculations [18–20]. Indicators are numerous and characterize the “distortions” or adjustments of economic result in relation to a social or environmental process, are used mainly to characterize the situation, but are not a “boundary” value. The limitations and disadvantages include the fact that the continued dynamic GDP growth does not always reflect the improvement in population’s well-being; when assessing the environmental and economic characteristics a mix of estimates of current welfare and longterm sustainability takes place, which must be measured separately, as well as the subjective nature of financial assessment of various economic activities. Such aggregate indicators, due to average reliability of estimates, often serve as evidence to a negative situation and as an incentive to introduce eco-friendly forms of management. This also applies to the methodology for the evaluation of ecosystem services to account for the common well-being; assessing the recreational services, services of wetlands and boreal forests; monitoring of state based on these assessments of benefits and development of accounting of benefits provided by ecosystems in the planning of economic activities [21–23]. Despite an attempt to take economic account of the benefits of the environment or environmental damage, many components cannot be brought to market, and thus the total value only hypothetically reflects the situation of population’s quality of life.
The processes of economic development are impossible without any dynamics, monitoring and evaluation. As a result, the concept of “green growth” appeared almost simultaneously with green economy. The first set of green growth indicators was proposed in the book “Towards Green Growth. A Summary for Policy Makers. OECD indicators” [3], and a more detailed set of indicators is presented in “Green Growth Indicators 2014” [8]. The measurement methodology is based on the interaction of economy, natural assets, and policy instruments. It is possible to distinguish five groups and about 30 metrics, detailing the indicators. In the group “environmental aspects of the quality of life” indicators are health risk factors (usually parameters of environmental pollution) and access to environmental benefits (clean drinking water, air quality, preservation of ecosystem services/ biodiversity). The most progressive of CIS countries in terms of introducing indicators to measure “green growth” indicators of the economy is Kyrgyzstan. At the end of 2013, the final draft of the green growth materials package was formed, which included: green growth indicators matrix; a road map for monitoring and evaluation of green growth indicators; a guide to national indicators for green growth monitoring and evaluation. The matrix of national green growth indicators consists of 65 indicators grouped into five clusters (similar to the model groups proposed by OECD). Collection, processing, storage and distribution of a large part of the matrix of national green growth indicators is carried out by the National Statistics Committee of the Kyrgyz Republic which produces handbooks [24]. By 2015, analysis of the situation during 2010– 2014 has been conducted according to the selected indicators. The block “Environmental quality of life” includes a set of 12 indicators: pollutant emissions into atmospheric air from stationary sources (per capita); respiratory diseases; share of people with sustainable access to drinking water and sewage; incidence of acute gastrointestinal infection; controlled collection of municipal solid waste in urban and rural areas; green area (per capita); share of per capita cost of electricity, heat, natural gas, and solid fuels. It should also be noted that the indicators are presented at the national, regional (oblast) and local (district) levels [25].
The seventeen Sustainable Development Goals (SDGs) cover three dimensions of sustainable development: social, economic and environmental, and institutional aspect. According to Bobylev S.N. and Solov’eva S.V., taking into account Russian realia and interests, one can define seven goals with the largest environmental focus: SDG 6 “Clean water and sanitation”, SDG 7 “Affordable and clean energy”, SDG 11 “Sustainable cities”, SDG 12 , SDG 13 “Climate change”, SDG 14 “Preservation of oceans”, SDG 15 “Conservation of biodiversity” [9]. The indicators have been adapted to Russian conditions, but their application for assessing green economic development is not always possible due to their absence in statistics ( Tab. 2 ).
There is an opinion among experts in environmental economics that growth is not a priority in OECD countries. The concept of degrowth is widely discussed in the foreign environmental and economic literature, assuming that economic growth is not necessary and in some cases it is even desirable to ensure
Table 2. Quality of life indicators
|
SDGs |
Indicators adapted to Russia |
|
SDG 6 “Clean water and sanitation” |
The share of housing provided with water supply (city, village), % |
|
The share of housing provided with sewerage (city, village), % |
|
|
Fresh water intake as % ot renewable water resources – Water Exploitation Index |
|
|
SDG 7 “Affordable and clean energy” |
Share of renewable power sources in total power balance, % |
|
GDP energy intensity, toe/ RUB |
|
|
SDG 11 “Sustainable cities” |
Share of old and dilapidated housing stock, % |
|
Removal of waste from urban settlements |
|
|
Average annual concentration of suspended particles (including PM2.5) in the territories of urban settlements, mg/m3 |
|
|
Number of people living in special contaminated cities, % Population in severely polluted cities, % |
|
|
SDG 12 “Responsible consumption and production” |
Generation of production and consumption waste, including hazardous |
|
Use and neutralization of hazardous production and consumption waste |
|
|
Use and neutralization of production and consumption waste |
|
|
SDG 13 “Climate change” |
Introduction of the environmental safety program, prevention of natural disasters |
|
Introduction of a strategy/plan to adapt to adverse effects of climate change, develop resilience to climate change, and reduce greenhouse gas emissions |
|
|
Greenhouse gas emissions |
|
|
SDG 14 “Preservation of oceans” |
Establishment of catch quotas, % |
|
Marine and coastal special protected natural areas, million hectares |
|
|
SDG 15 “Conservation of biodiversity” |
Specially protected natural areas, million ha |
|
Area of desertified land, thousand ha |
|
|
Area of derelict land, thousand ha |
|
|
Area of exhausted land, thousand ha га |
|
|
Area of remediated land, thousand ha |
negative growth – an economic decline. It is believed that these countries have already achieved a high level of production of material values, and improving people’s quality of life is mainly focused on the preservation of natural assets [26, 27]. For Russia, the path towards “green economy” may be called “green” growth only in the case of expanding economy [15]. From the point of view of conceptual applicability (for diagnosing environmental sustainability of economic development) and availability of tools, the simplest and clearest is the diagram of curves by P. Victor. The curves show the state of economic development in terms of environmental impact.
Research methods
Despite the fact that for Russia “green economy” remains a desirable, rather than the real area of development, the very path towards achieving even minor but important results can be called green growth [15]. Given the already existing excessive influence of the economy on the biosphere, we note that an economy with a growing GDP can become greener only if such growth entails an unconditional reduction in the number of factors (by one or more) which have an impact on the environment. This may involve reducing greenhouse gas emissions per GDP unit (intensity of greenhouse gas emissions) or other types of pollution. However, if the reduction in greenhouse gas emissions within a country/region per unit of GDP/GRP is achieved through changes in economic activity so that emissions occur in another country, this is not “green” growth we are talking about. These points reflect the concept of P. Victor, according to which green growth can be defined as economic growth that is slower than the rate of pollution intensity dissipation, because only in this case the environmental impact will certainly decrease. Green growth cannot be green enough if only the negative environmental impacts are reduced; it does not imply (emissions) reduction, but it at least represents a movement in the right direction. Moreover, when economic growth rates exceed the rate of pollution intensity dissipation, then brown growth takes place; when both scale and intensity of pollution increase, we are talking about black growth [28].
Diagnosing the performance of “green” growth, P. Victor relied upon gross product growth ratio and pollution intensity. His graphical scheme defines the environmental and economic growth zones of two processes through the ratio of curves of interdependence of economy and its impact on the environment [28].
To assess the impact of economic growth on pollution we use two relative indicators of environmental intensity – value indicator per ruble of gross regional product (EIgrp) and natural – per capita (EIp):
EIgrp = EL/GRP, (1)
where EL – environmental load of three types (volume of wastewater discharge into water bodies; pollutant emissions from stationary and mobile sources into the atmosphere; volume of toxic industrial waste taking into account their treatment indicators), GRP – gross regional product characterizing the result of economic development.
EIp=EL/P, (2)
where EL – corresponding environmental load; P – population in the region.
The idea of charting is based on the comparison of indicators of negative human impact and economic results. Moreover, the level of negative load on the environment for calculations is given taking into account its actual treatment (for example, for wastewater – the volume of contaminated wastewater). In coordinate representation of main axis values of GDP (vertical) and EIgrp(horizontal) are plotted over the study period (2007–2016) in the form of points on graphs. To determine the vector of economic development (green, brown or black growth/decline) additional axes are used, indicating the starting values of GRP and environmental intensity. In our case, the additional horizontal axis corresponds to the level of environmental intensity in 2007 (EIgrp 2007), the additional vertical axis demonstrates the economic result – GRP 2007, the intersection of axes represents the initial correlation between environmental intensity and economic result.
To identify the situation, we construct a curve, which meets the condition: El grp x GRP=const (i.e. EI=const., for example, pollutant emissions into the atmosphere from stationary sources, taking into account their capture as of 2007). The purpose for this curve is that with the growth/decline of GRP, the level of pollution does not increase, and, therefore, it divides the space in such a way that the values lying in the “green” growth area become a positive moment of economic development in the region, and vice versa. Thus, additional axes (EIgrp 2007 and GRP 2007) and the curve divide the space into zones of green, brown and black growth/decline. The part on the left of the curve is the zone of green growth, while the values falling into this zone record positive processes in economic development from the point of view of its eco-friendliness. The space limited by the curve and the additional vertical axis (EIgrp 2007) is a brown zone of economic development, where economic growth is accompanied by an increase in the negative impact on the environment. The zone of black economic growth is located beyond the additional vertical axis 2007 and characterizes extremely negative processes of economic
Table 3. Environmental and economic zones in the concept of “green growth”
|
GRP performance |
Environmental intensity performance |
Quality of economic growth |
|
Economic growth |
||
|
Growth |
Simultaneous reduction of cost and natural indicators |
Green |
|
Growth |
Decrease in only one of the indicators |
Brown |
|
Growth |
The simultaneous growth of value and volume indicators |
Black |
|
Economic decline |
||
|
Decline |
Simultaneous reduction of cost and natural indicators |
Absolutely green |
|
Decline |
Decrease in only one of the indicators |
Green |
|
Decline |
Simultaneous growth of value and volume indicators |
Black |
development with the growth of all indicators of environmental intensity.
GRP characterizes economic development. To adequately assess the growth/decline of gross product, the index of GRP physical volume in % to the previous year (for the entire study period) is used, which reduces the values to the price level of 2007 [29, 30]. The eco-friendliness of economic development in the region or the quality of economic growth determines the changes in environmental intensity. Natural indicators of pollution intensity per capita helps adjust the assessment of the nature of economic growth. In cases when the value of GRPcorr is reduced to its initial value during the study period, the situation is characterized by a decline in economic development. The conditions for the curves to belong to a particular economic development zone are presented in Table 3 .
Similar studies have been carried out in forest resource use and environmental protection for the territory of Siberia [15, 16]. The assessment results characterize the negative impact on the atmospheric air (pollutant emissions from stationary sources, taking into account their volume of capture); on water bodies (discharges of contaminated wastewater) and on land (of toxic waste production, taking into account the volume of waste use) with GRP growth and decline (taking into account the deflation index) for 2007–2016.
Research results
The analysis is presented for the Northern region – the Komi Republic. Figures 1, 3, 4 show the intensity of air, water and land pollution. At the same time, the values that fall into the area beyond the dotted curve on the right side characterize the negative aspects of solving environmental problems. In 2007–2016 GRPcorr grew up to 2012 and further declined by 2016. In cases where the points are to the left of the dotted line, it is possible to record the positive nature of natural resource use. The color of the dots shows the involvement in the economic growth zones.
Natural indicators of pollution intensity per capita – volume of polluted wastewater discharges into water bodies; pollutant emissions from stationary sources into the atmosphere (taking into account their capture); generation of toxic industrial waste (taking into account their use) per capita – adjust the assessment of the economic growth vector. Changes in these indicators are given with respect to the axis of the zero series: positive values show an increased negative impact on the environment, and negative – a decrease in anthropogenic load ( Fig. 2 ).
Data on air pollution showed that for a number of years, there has been mixed trends regarding EIgrp (Fig. 1) .
The initial phase of the research period (economic growth of GRPcorr for 2007–2010)
-
Figure 1. Environmental value intensity of air pollution
Emissions taking into account their capture
Elgrp (2007)
'brown growth'
"green growth"
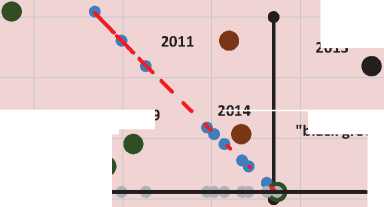
GRP (2007)
W 2008 ф
2015 —
black growth"
1.3
1.4
1.5
1.6
1.7
1.8
1.9
2.0
Elgrp, kg/thou RUB is accompanied by solving problems in the field of air protection against pollution: the use of new technology for cleaning air pollutant emissions, improving the efficiency of existing treatment plants and elimination of pollution sources at a number of large enterprises
(OAO Mondi SLPK, OAO Vorkutaugol, Vorkuta cement plant). Then there is a decline in GRPcorr and a simultaneous growth of volume characteristics of atmospheric pollutant emissions, which shows in Figure 1 the entry into the zone of brown and black
-
Figure 2. Changes in natural indicators of environmental intensity
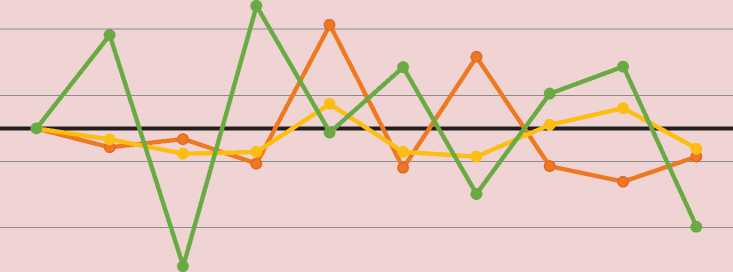
-50
2007
2008
2009
2010
2011
2012
2013
2014
2015
2016
emissions
0
-5.7
-3.2
-10.6
31.3
-11.9
21.6
-11.4
-16.1
-8.5
discharges
0
-3.3
-7.6
-7.1
7.4
-7.1
-8.5
1.1
6.1
-6.1
waste
0
28.2
-41.6
37
-1.2
18.5
-19.8
10.5
18.7
-29.7
growth of economic development (2011– 2014). The increase in the negative impact is due to the increase in emissions of sulfur dioxide, hydrocarbons and carbon monoxide at the enterprises of OOO LUKOIL-Komi, OOO RN-Severnaya Neft’, OOO Gazprom pererabotka, and Pechora GRES. During 2015–2016, despite the decline in GRPcorr, due to environment protection measures (the use of associated petroleum gas more than 95%) at OO LUKOIL-Komi, OOO Yenisei, OOO RN-Severnaya Neft’, ZAO Pechoraneftegaz, OOO Nobel’ OIL and other industrial facilities in the region, the situation is improving again in terms of environmental sustainability of its economic development, and becoming “green”.
The performance of the natural indicator EIp ( Fig. 2 ) is also ambiguous and yet indicative of a decline in negative impacts. The combination of two plots of indicators of cost and natural environmental intensity suggests that economic development by nature of the impact on the atmospheric air corresponds to the vector of “brown” growth.
The performance of contaminated wastewater discharge intensity EIgrp (Fig. 3) demon- strates almost complete entering the area of “green” growth (except 2011), as well as the values of physical indicators of pollution EIp which have negative values and, hence, show a decline of negative impact (Fig. 2). This suggests that the situation with wastewater treatment is quite stable and positive.
Treatment of toxic waste with regard to their use/processing in the study period represents an oscillating curve (of almost annual growth and decline) in contrast to the performance of GRPcorr which grew up to 2012, demonstrating economic growth; in 2012–2016, there was a decline in economic development. Due to lack of a clear trend in growth and reduction of the negative impact on the environment from toxic waste generation, there are only three years when there was a reduction in their generation. Moreover, a sharp volume decrease does not have any trend of holding events, introducing new technology, etc. ( Fig. 4).
The minor waste processing (0.8% of generation volume) takes place at extractive enterprises, which in turn produce maximum amount of toxic waste (77.6% of the total volume of industrial waste in the region). In
Figure 3. Value environmental intensity of wastewater discharge
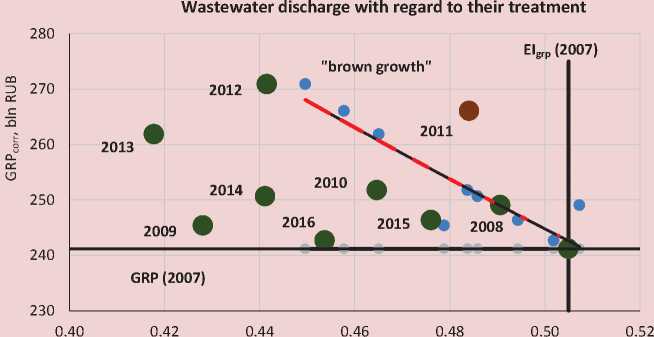
Elgrp, m3/thou RUB
Figure 4. Value environmental intensity of waste management
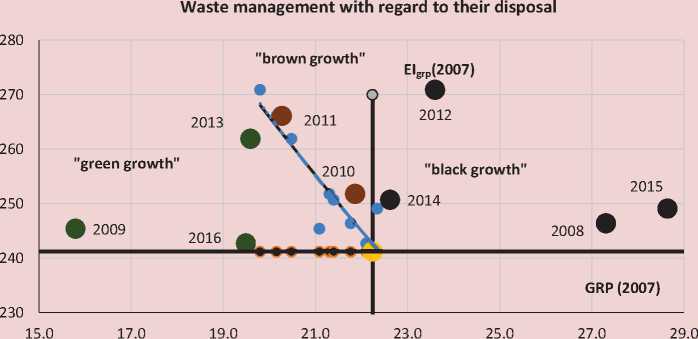
Elgrp, kg/thou RUB
this regard, even positive results of 2012– 2016 in terms of waste processing in forestry (production of briquettes and pellets – 13 enterprises) and the use of wood waste as a source of heat (OOO Sevlespil, OOO Luzales, OOO Mondi SLPK, OOO SFZ) did not affect the situation. Figure 4 shows that, despite the decreases load, the situation with toxic waste treatment is still in the “black growth” zone of economic development. Although shortterm improvements in waste management have been observed during the study period, sharply negative impacts on the environment prevail. Compared to the effects on air and water, the situation with waste management is the most unfavorable in the region. The assessment results revealed a generally low level of environmental quality of the economy in the Komi Republic during 2007–2016:
– according to discharge of polluted wastewater into water surface bodies, there was a decrease in relative indicators of environmental intensity, which suggests “green” economic growth;
– the performance of pollutant emissions into the atmosphere from stationary sources showed different directions of cost and natural indicators of eco-intensity, which suggests that the economy was in the zone of “brown” growth;
– the volume of toxic waste generated and disposed of by industrial enterprises caused specific indicators of eco-intensity to grow – this is a sign of “black” growth of economic results.
Analysis of results
At present, the volume of toxic waste use in the Komi Republic is extremely low (18–24% during the study period) and does not give any drastic improvements in the existing volume. The analysis of dependence on the level of waste disposal revealed a threshold value of 40% ( Fig. 5 ). Its excess shifts the situation towards the zone of environmental improvement of economic development in relation to environmental protection.
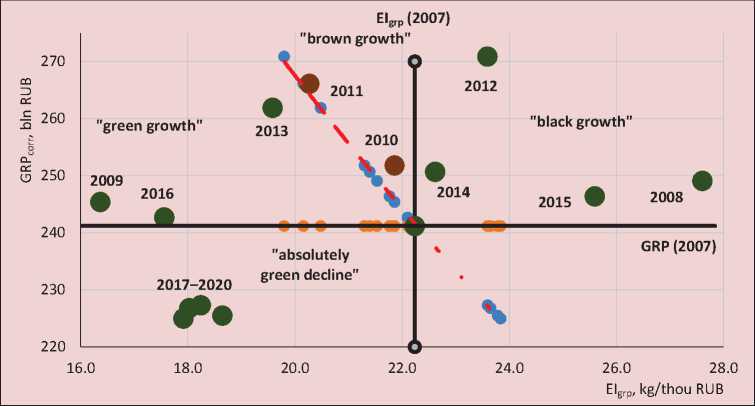
Analysis of the “Forecast of socio-economic development of the region for the period up to 2020” shows that during 2007–2020, despite the actual GRP growth according to the index of physical GRP volume to the previous year (%), there was a decline in economic development [31]. Despite plan indicators of waste use during 2015–2020, according to the state program of the Russian Federation “Environment Protection” for 2012–2020 in the Komi Republic (25–30% of the generation volume), the vector of region’s economic development demonstrates its “absolutely green decline” [32]. Thus, even in the nearest future (2020) with the growing share of toxic waste (up to 30%), the situation will not change dramatically in terms of green course of economic development (Fig. 6). This means that improving the situation in terms of environmental measures solely is not enough for the implementation of an environmental course of economic development in the region.
Figure 5. Environmental intensity of waste generation taking into account their use in the amount of 40%
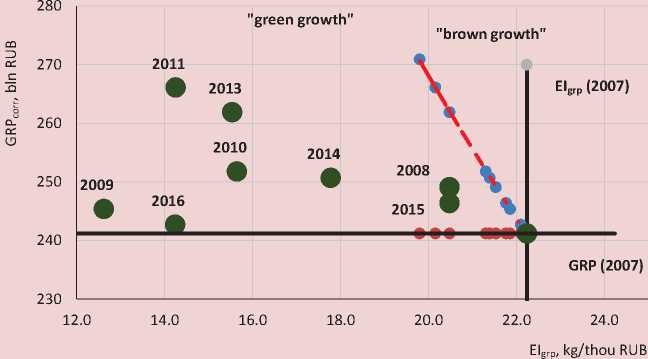
Figure 6. Environmental intensity of waste generation (Forecast of socio-economic development of the Komi Republic for the period up to 2020)
During the analysis the following conclusions have been made:
-
1. From the point of view of conceptual applicability (to diagnose environmental sustainability of economic development) and availability of tools the simplest and most illustrative is the diagram of curves by P. Victor. These curves show the state of economic development in terms of the environmental impact. The assessment results reveal a generally low level of environmental quality of the economy in the Komi Republic during 2007–2016. The situation with waste management is the most unfavorable in the region.
-
2. In order to reduce the negative impacts on the environment, the following measures can be implemented to address the existing problems: introduction of best available technology (BAT) at production facilities and for waste processing; ensuring waste processing at the level of at least 40%. Mining is the sphere which needs secondary use of waste production the most.
Discussion of the research results
The proposed model can also be used in assessing the relative state in terms of green growth targets for individual regions. We have chosen the regions in the Northwestern federal district, where the production and processing of forest and mineral resources (mineral and hydrocarbon) is predominant. The objective is to show the actual situation and determine which regions can be included in the “green” zones in relation to the average index of economic efficiency. To do this, we used pollutant emissions into the atmosphere from stationary sources, taking into account their capture as indicators of environmental load. The economic indicator presents GRP ;
corr the research period – 2005–2015 [33, 34]. All the represented regions are not grouped according to their economic development in terms of environmental sustainability. Thus, in Karelia, there is an average degree of pollutant emissions (38–53% of the total amount of waste substances) and an increase in GRP corr (i.e. a slight increase in the index of physical GRP volume), due to which the situation is characterized positively from the point of eco-friendliness of economic development (Fig. 7). However, at the end of the research period, the situation deteriorates due to the decline in the share of emission capture and
Figure 7. Environmental intensity of pollution in the Republic of Karelia
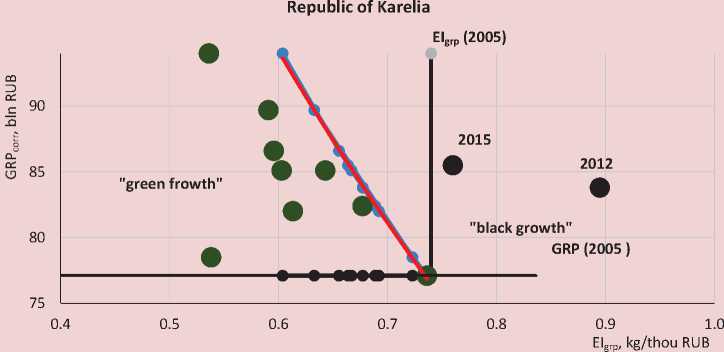
minor GRP growth, which explains the entry into the zone of “black” growth of economic development.
The territory of the Arkhangelsk Oblast is characterized by a high degree of pollutant emissions purification (56–73% of the total amount), as well as GRP growth with adjustment to its index. Therefore, the figure shows dynamic improvement in terms of environmental sustainability of economic development ( Fig. 8 ).
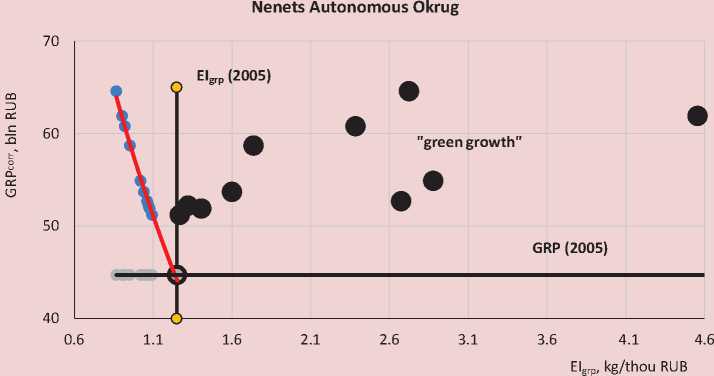
The polar pattern is observed in the Nenets autonomous okrug (NAO) with the zero degree of emission utilization, with a high growth of GRPcorr (index of GRP physical volume to the previous year comprises 87–123%), which explains the penetration of the vector of economic development in the zone of “black” growth ( Fig. 9 ).
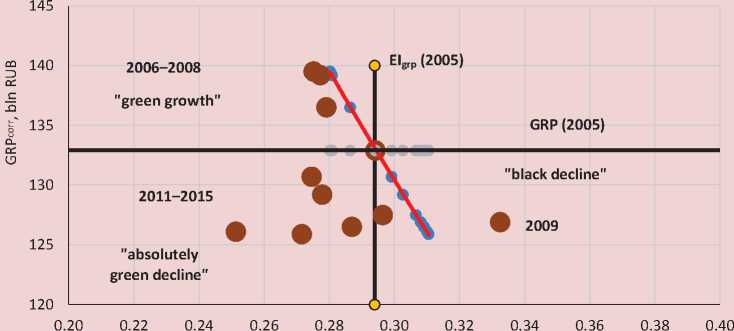
In the Murmansk Oblast, there is a trend of improving degree of eco-friendliness and declining economic growth. Here the highest
Figure 8. Environmental intensity of atmospheric pollution in the Arkhangelsk Oblast
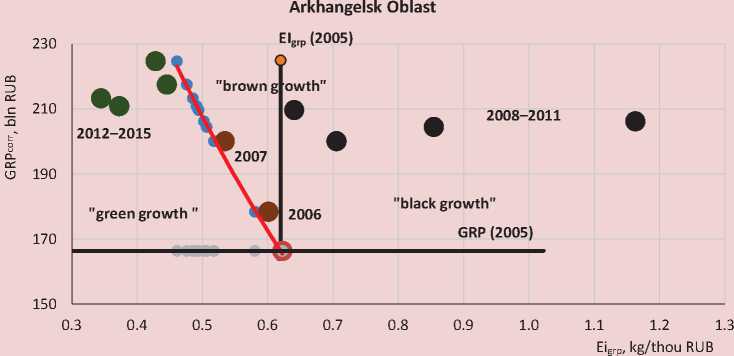
Figure 9. Environmental intensity of atmospheric pollution in NAO
and stable degree of atmospheric pollutant emissions capture (85–89%) is observed. This is a situation where there is a reduction of the negative impact of greater intensity than GRP growth in relation to deflation index ( Fig. 10 ).
The comparison of regions by average economic efficiency (GRPcorr average) in 2015 demonstrated that the “dirtiest” economic development is characteristic of the Komi Republic ( Fig. 11 ).
The most positive situation is observed in the Arkhangelsk and Murmansk oblasts (which is consistent with the degree of recycling emission and level/positive performance of GRPcorr). Despite the absence of any environmental activities (pollutant emissions purification) due to small amounts of anthropogenic load with respect to average amounts in the regions under study, NAO demonstrates the vector of “green decline” of its economic development.
Figure 10. Environmental intensity of atmospheric pollution in the Murmansk Oblast
Murmansk Oblast
Elgrp, kg/thou RUB
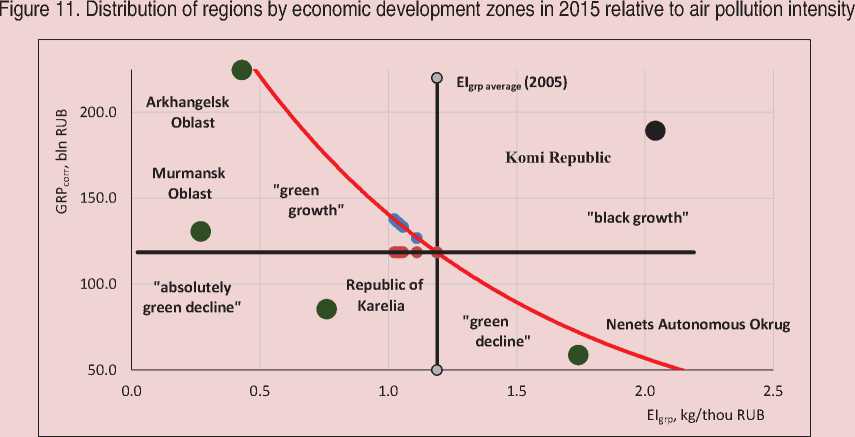
The research results show a significant differentiation of economic efficiency and ecointensity in the resource-producing regions of the Northwestern federal district. Regions with effective indices of pollutant purification also have better prospects in the context of green growth while increasing socio-economic indicators.
Conclusion
In Russia there is a need to develop a concept of transition to “green” economy and an appropriate action plan which would involve the creation of new levers of economic growth to improve the population’s quality of life. Green growth is a strategy for transforming an economic system where investment in environmental resources and services is a driving force for economic development. One of the key measures could be the transformation of the tax system, in which the tax base shifts from traditional taxes based on labor taxation towards taxes of environmental significance. There is also a need to improve environmental statistics, increase the completeness and quality of accounting for environmental investment and other costs at the micro and macro levels; develop, supplement and adjust federal and departmental statistical observations.
The testing based on the use of P. Victor model of curves for assessing the degree of environmental sustainability of economic development can help making more adequate management decisions in environmental management. To improve environmental performance it is advisable:
– to assess the environmental performance using P. Victor curves, which is more correct than traditional methods, because it takes into account the relations between the region’s economic activity and the load on the environment and helps reasonably judge the favorability of environment;
– to recognize that the reduction in natural indices of environmental impact, perceived as an improvement in the environmental situation in the region, is not entirely true: the scheme of P. Victor curves demonstrate the situation of economic development in terms of the degree of environmental impact.
The result of the author’s assessment was the recognition of the low level of environmental quality of the economy of the Komi Republic during 2007–2016. The situation with waste management is the most unfavorable in the region. In order to reduce the negative impact on the environment, it is necessary to introduce best available technologies (BAT) at production facilities and for waste processing, as well as ensure waste processing at the level of 40% or higher.
The real reduction of negative impact on the environment will provide environmental modernization of production (starting with resource-intensive industries) based on the principles of BAT: rational consumption, high energy efficiency, low-waste processes, reducing emissions, etc., which is harmoniously inte-grated into sustainable development and “green” growth. For a full-scale transition to best available technology it is necessary to provide personnel training for implementing activities at the regional level, to create a permanent structure for consulting when preparing applications for integrated environmental permits and other activities; this will strengthen innovative activity of organizations and accelerate environmental modernization.
References Environmental assessment of economic growth in the northern region
- Pearce D. Green economics. Environmental Values, 1992, no. 1, pp. 3-13. Available at: http://www. environmentandsociety.org/node/5454 (accessed: 10.04.2016)
- Navstrechu «zelenoi» ekonomike: puti k ustoichivomu razvitiyu i iskoreneniyu bednosti . UNEP, 2011. 738 p.
- Kurs na zelenyi rost. Rezyume dlya lits, prinimayushchikh resheniya . May, 2011. 26 p. Available at: https://www.oecd.org/greengrowth/48634082.pdf. (accessed: 24.05.2016).
- Hallegatte S., Heal G., Fay M., Treguer D. From Growth to Green Growth -a Framework. The World Bank Sustainable Development Network Office of the Chief Economist. Washington, D.C.: The World Bank, 2011. 37 p. Available at: http://www.nber.org/papers/w17841 (accessed: 21.07.2015)
- Narloch U., Kozluk T., Lloyd A. Measuring Inclusive Green Growth at the Country Level. Taking Stock of Measurement Approaches and Indicators. GGKP Research Committee on Measurement & Indicators. February, 2016. Available at: http://www.greengrowthknowledge.org/sites/default/files/downloads/resource/Measuring_Inclusive_Green_Growth_at_the_Country_Level.pdf (accessed: 3.06.2016).
- Bobylev S.N. Economic unsustainability: a chance for "green" economy? A report on human development in the Russian Federation for 2014. Moscow: Analit. tsentr pri Pravitel’stve RF, 2014. 204 p.
- Atlas of Sustainable Development Goals 2017: From World Development Indicators. World Bank Group, 2017. 131 p. Available at: https://openknowledge.worldbank.org/handle/10986/26306 (accessed: 12.12.2017).
- Green Growth Indicators 2014: Russian version. Paris: OECD Publishing. Available at: http://www.keepeek.com/Digital-Asset-Management/oecd/environment/green-growth-indicators-2014_9789264256767-ru#page1 (accessed: 23.05.2016).
- Bobyleva S.N., Grigor’ev L.M. (Eds.). Tseli ustoichivogo razvitiya OON i Rossiya . Report on human development in the Russian Federation for 2017. Moscow: Analiticheskii tsentr pri Pravitel’stve Rossiiskoi Federatsii, 2017. 292 p.
- Shvarts E. The national model of green economy. Vedomosti, 2016. 27 iyulya g. Available at: https://www.vedomosti.ru/opinion/articles/2016/07/28/650827-natsionalnaya-model-zelenoi-ekonomiki (accessed: 18.04.2017).
- Shvarts E.A., Babenko M.V., Boev P., Martynov A.S., Knizhnikov A.Yu., Ametistova L.E., Pakhalov A.P. Rossiiskaya natsional’naya model’ «zelenoi» ekonomiki i dobrovol’nye mekhanizmy ekologicheskoi otvetstvennosti . Report on human development in the Russian Federation for 2017. Environmental priorities for Russia. Moscow: Analiticheskii tsentr pri Pravitel’stve Rossiiskoi Federatsii, 2017. Pp. 189-211.
- Pokazateli «zelenogo rosta» OESR . Proceedings of a seminar, July, 7th, 2015. Ministry of Economics of the Russian Federation, 2015.
- Chereshnev V.A., Kuklin A.A., Boyarskikh A.I. Assessment of "green" territory potential. Upravlenets=The Manager, 2015, no. 6 (58), pp. 57-65.
- Simarova I.S., Gur’eva M.A. Methodological approach to assessing the development of ‘‘green’’ economy in the economic space. Nauka i biznes: puti razvitiya= Science and business: ways of development. Moscow: TMBprint, 2016, no. 10 (64), pp. 90-103.
- Glazyrina I.P., Faleichik L.M., Yakovleva K.A. Socioeconomic effectiveness and "green" growth of regional forest use. Geografiya i prirodnye resursy=Geography and natural resources, 2015, no. 4, pp. 17-25.
- Zabelina I.A. Ekologo-ekonomicheskie aspekty razvitiya prigranichnykh regionov Sibiri i Dal’nego Vostoka: perspektivy dvizheniya k «zelenoi» ekonomike . Russia’s Eastern vector: a chance for "green" economy in natual-recourse regions: proceedings of a scientific seminar. Irkutsk: Izd-vo Instituta geografii im. V.B. Sochavy SO RAN, 2016, pp. 231-240.
- Zomonova E.M. Strategiya perekhoda k «zelenoi» ekonomike: opyt i metody. Analiticheskii obzor . Novosibirsk: GPNTB SO RAN, 2015. 283 p. (Series "Environment, issue 104)..
- Cobb J., Daly H. For the common good, Redirecting the Economy Toward Community, the Environment, and a Sustainable Future. Boston: Beacon Press. 1989. 492 p.
- Talberth J., Cobb C., Slattery N. The Genuine Progress Indicator 2006: a tool for sustainable development. Oakland CA: Redefining Progress, 2007. 31 p.
- Wackernagel M, Ress W. Our Ecological Footprint: Reducing Human Impact in the Earth. Canada, Gabriola Island, BC: New Society Publishers, 1996. 176 p.
- Tsennost’ lesov. Plata za ekosistemnye uslugi v usloviyakh «zelenoi» ekonomiki . UN, Geneva, 2014. 94 p.
- Bobylev S.N., Perelet R.A., Solov’eva S.V. Otsenka i vnedrenie sistemy platezhei za ekosistemnye uslugi na osobo okhranyaemykh prirodnykh territoriyakh: metodicheskie rekomendatsii . 2012. 176 p.
- Rekomendatsii po denezhnoi otsenke resursov i ob"ektov okruzhayushchei sredy: adaptatsiya k usloviyam Rossii metodov ekologo-ekonomicheskogo ucheta OON .RF Environment Protection Committee. Yaroslavl’: NPP Kadastr, 2000. 76 p.
- Okruzhayushchaya sreda v Kyrgyzskoi Respublike . NatsstatKyrg. Resp., 2015. 82 p.
- Indikatory zelenogo rosta v Kyrgystane , 2015. 12 p.
- Victor P. Growth, degrowth and climate change. Ecological Economics, 2012, vol. 84, pp. 206-212.
- O’Neill D.W. Measuring progress in the degrowth to a steady-state economy. Ecological Economics, 2012, vol. 84, pp. 221-231.
- Victor P., Kenneth E. Boulding Memorial Award 2014: Ecological economics: A personal journey. Ecological Economics, 2015, vol. 109, pp. 93-100. Available at: https://www.sciencedirect.com/science/journal/09218009/109 (accessed: 13.05.2016)
- Statisticheskii ezhegodnik Respubliki Komi. 2010: stat. sb. . Komistat. Syktyvkar. 2010. 502 p.
- Statisticheskii ezhegodnik Respubliki Komi. 2017: stat. sb. . Komistat. Syktyvkar, 2017. 395 p.
- Prognoz sotsial’no-ekonomicheskogo razvitiya Respubliki Komi na 2018 god i na period do 2020 goda . Approved by the Order of the Government of the Komi Republic no. 565-r, dated 14.12.2017. Available at: http://econom.rkomi.ru/page/9307/(accessed: 13.01.2018)
- Territorial’naya skhema obrashcheniya s otkhodami Respubliki Komi na period do 2027 goda . Approved by the Order of the Ministry of Natural Resources and Environmental Protection of the Komi Republic no. 1687, dated 11.10.2016.
- Regiony Severo-Zapadnogo federal’nogo okruga. Sotsial’no-ekonomicheskie pokazateli. 2017: stat. sb. . Komistat. Syktyvkar, 2017. 183 p.
- Regiony Severo-Zapadnogo federal’nogo okruga. Sotsial’no-ekonomicheskie pokazateli. 2007: stat.sb. . Komistat. Syktyvkar, 2007. 182 p.
