EQ: An Eigen Image Quality Assessment based on the Complement Feature

Author: Salah Ameer
Journal: International Journal of Image, Graphics and Signal Processing @ijigsp
Article in issue: 6 vol.12, 2020.
Free access
An Eigen formulation is proposed for image quality assessment IQA. Each block is represented by an array composed of feature vectors (intensity/color at this stage). After attaching the complement feature(s), the auto-correlation matrix is computed for each block. The proposed full reference FR-IQA is simply the deviation of the Eigen values of the degraded image from that of the original image. Interestingly, the second largest Eigen value was sufficient to perform this comparison. Results and comparisons with SSIM and GMSD schemes on different types of degradation are demonstrated to show the effectiveness of the proposed schemes. Using TID2013 database, the proposed scheme outperforms SSIM. In addition, the proposed schemes is closer to the MOS score compared to GMSD; however, the correlation with MOS is inferior as illustrated in the tables. These results are concluded from the average behaviour on all the images using all degradations (with 5 levels) on the database.
Image quality assessment, Eigen Value, Complement Feature
Short address: https://sciup.org/15017374
IDR: 15017374 | DOI: 10.5815/ijigsp.2020.06.02
Text of the scientific article EQ: An Eigen Image Quality Assessment based on the Complement Feature
The demand on visual data access is increasing thanks to the internet and hand held devices. The requirement for a measure to Image Quality Assessment, IQA, is therefore essential. In general, IQA can be categorized into three groups depending on the amount of information needed from the original undistorted image.
The first category is where the original image is completely available, often referred to as Full Reference IQA (FR-IQA). In fact, FR-IQA has been widely used to evaluate and compare algorithms in many topics in image processing [1,2,3]. The comparison between the degraded and the original images can be performed at the pixel level such as the traditional SNR; block-based [4,5]; wavelets [6]; and natural scene statistics NSS [7,8].
The second category is the No Reference/Blind IQA, NR-IQA. Since the original image is unavailable in many situations, a statistical, e.g. generalized Gaussian [9] or its asymmetric version, framework can be learned from some images and hence database dependent. These statistics can be in any domain using intensity, gradient, or Laplacian at many scales with raw or normalized features. NR-IQA is then found as the amount of deviation the degraded image has from this statistics [10,11,12,13,14]. Some algorithms rely on deep neural networks, e.g. CNN, to avoid the dependency on the subjective scores needed in the previous schemes [15].
The third category is the Reduced Reference IQA, RR-IQA, that is the midpoint between the previous two categories. In general, few values describing certain features from the original image are needed to evaluate the degraded image [16,17].
In this paper, IQA is based on the complement feature recently proposed [18]. A correlation/covariance matrix is composed using the data in the block, can also be used for the whole image or any regularly shaped portion. The data is typically multi-dimensional with a plenty of possibilities. For example, the intensity of all the pixels in the block is composing just one feature vector. After constructing the features, a complement, e.g., Euclidean norm, is appended to create a feature array. The auto-correlation matrix is then decomposed through Eigen formulation in a similar fashion to the principal component analysis PCA framework [19]. The proposed IQA, named Eigen Quality EQ, is then found as the deviation of the Eigen values of the degraded image from that of the original image.
A singular value decomposition SVD [20] is proposed where each block in a gray-scale image is considered as a matrix and the singular values are then found. FR-IQA is then computed as the deviation of the degraded image singular values from that of the original image. On the contrary, the proposed scheme regard the whole block as a single feature vector. Hence, it can be easily generalized to use more than one feature, e.g. intensity, and can even go beyond the scope of FR-IQA.
In a different context, [21] proposed a complex structure in the wavelet domain where a covariance matrix is constructed for each coefficient using a set of neighboring coefficients. The algorithm depends on finding the Eigen values of the covariance matrix obtained for each coefficient. However, the resultant FR-IQA scheme depends on comparisons that are not explicitly these Eigen values.
The main goal of this work is to explore the auto correlation matrix [18] and the wealth of information embedded in it, EQ (as an FR-IQA scheme) is one of these products.
Comparison with complex scheme such as CNN, despite their potential, will not be considered. As suggested in the experimental section, comparisons will be made with two highly efficient schemes namely SSIM [4] and GMSD [8]. Despite the simplicity of [4] and [8], as they use first and second order statistics, there performance is remarkable. However, due to their dependence on MOS, some distortion types may experience biased results.
2. Method
Without loss of generality, following the derivation in [18], the image is normalized to have a maximum of one, however, better performance was noticed when normalizing to [–1/√2, 1/√2]. Intensities of all the pixels in any nxn block are concatenated to produce a column vector of size Nx1, N=n2. This representation is then extended to be of a “ unit” vector type given by
9 i 9 t
1- g 1 ^1- gt
9 n 1
71 - Sn-I
G is now a 2xN array, where N is the size of the block selected. An auto correlation matrix, AG, of size 2x2 is then constructed from G as
Solving the Eigen formula,
Ag = GGT
AgV = AV
The Eigen vectors of AG represent the axes of inertia for the data set, while the Eigen values represent the strength in that axis [18]. Hence, the largest vector Vmax, corresponding to the largest Eigen value λmax, points toward the direction of maximum inertia.
Unfortunately, distorted images show high similarity with undistorted ones in terms of low frequency power. This motivates the author to use the second largest Eigen value λM-1. Although other Eigen values can contribute to less extent, a more elaborate study is needed to channel these contributions.
The proposed IQA scheme, named Eigen Quality EQ , is simply the deviation of λM-1, defined in the previous paragraph, of the distorted image blocks from that of the corresponding blocks in the original image. Defining the distortion per block as
D t
_ min(Oi,Ti) max(O ^ ,T ( )
where, O is the Eigen value from the original block i, and T is the Eigen value from the corresponding test/distorted block. The distortion vector can then be formed by attaching the distortions from all the blocks in the image.
As a demonstration, image #5 is chosen from TID2013 [22] to illustrate some statistical observations supporting (4) and the effect of block size.
Fig.1. shows sorted distortion values calculated using (4) on 32x32 blocks. For comparison, Fig.2. shows the sorted absolute differences for the same images used in Fig.1. Obviously, the use of (4) is justified as Fig.1. is more diverse than Fig.2. In addition, Fig.3. shows the results of (4) on different types of distortion. Fig.4. and Fig.5. illustrate the results of (4) for each block, higher size is used to enable visual distinction. As can be seen from these figures, the proposed method can distinguish between different types of distortions and different levels of distortion.
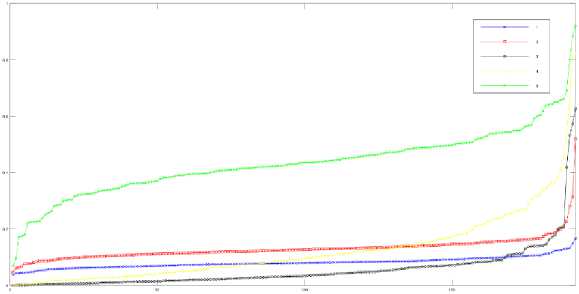
Fig.1. Sorted distortions, block size 32x32, for the 5 levels of distortion #7 from TID2013-i05.
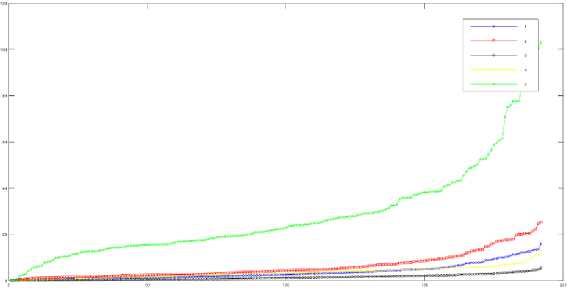
Fig.2. Sorted absolute differences, block size 32x32, for the 5 levels of distortion #7 from TID2013-i05.
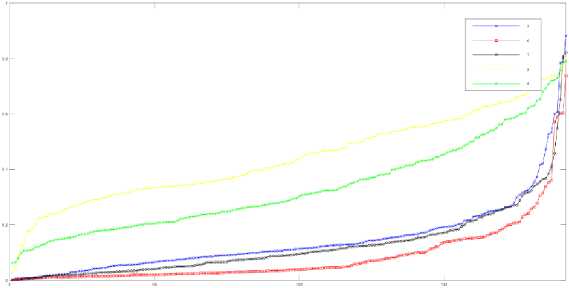
Fig.3. Sorted distortions, block size 32x32, for level 4 of distortions 5 – 9 from TID2013-i05.
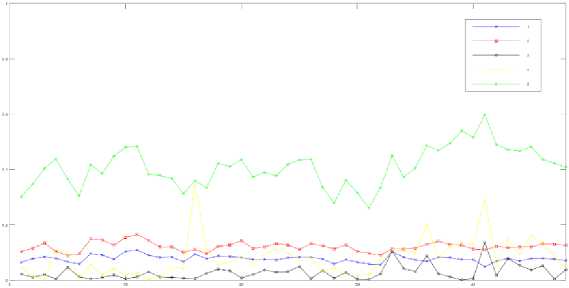
Fig.4. Distortion of each block, size 64x64, for the 5 levels of distortion #7 from TID2013-i05.
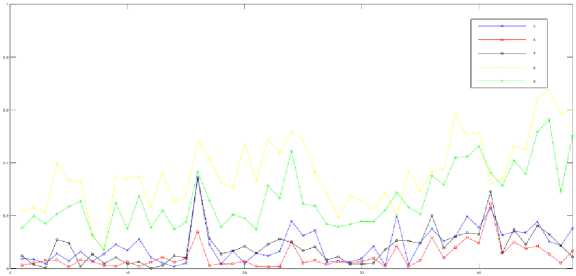
Fig.5. Distortion of each block, size 64x64, for level 4 of distortions 5 – 9 from TID2013-i05.
Two interesting polling schemes on the distortion vector will be demonstrated in the experimental results. The first is simply a weighted sum of the mean and maximum value. The second is the 99% rank.
The block size used is 21x21, however, it was noticed that the effect is marginal around this size. As with any other IQA scheme, decreasing/increasing the block size can lead to over/under-estimate the distortion. In addition, it was noticed that choosing sizes that are multiple of 8 can be biased in the IQA obtained for jpeg images.
The scheme in (1) can be extended in many ways to include more features. A higher dimensional paradigm is also possible by using powers, not necessarily integers, of the pixel intensity. Care should be taken to take the power of the magnitude part and leave the sign part unchanged, this can not be followed in the calculation of the complement feature. Some suggestions are as follows
G =


£ 2 +£ 4 +£ i
J*
д+й+щ.
9n
On
/9 n
0 n +0 n +0 N
1--3 .
(5a)
G =
G =
/1- 91
J 1-"9 ? V1 - 9 n
(5b)
■ 91
/9 1
Z 1- 9 1
/1- 91/1- 91
9 i
9 i
// J 1 " 9 j 1-9 V 1- 9 i
9n "
9 N

/1- 9n
/1-9n
(5c)
Each resultant column of G should be normalized to have a unit magnitude to avoid biasing. However, this normalization can be relaxed for (5b) and (5c) as all the vectors have the same magnitude. However, minor differences were noticed in the performance of the variants of (5).
In fact, (5) can be easily extended to incorporate other features such as color, particularly (5a). However, the best aggregation method is still under investigation.
The proposed EQ scheme is tested on all the images in TID2013 using all degradation types and there associated levels. In effect, the resultant score is assessed against the MOS, mean opinion score, reported in the database. The performance is assessed through three indices. The first index is the traditional mean absolute error, MAE, given by
MAE =
E m,n |^ mn У тА
S
where, x and y stand for original and segmented images, and S is the number of samples, here images in the database. Adjustment should be placed when the range of images are different.
The second index is the Linear Correlation coefficient, Pearson LC, given by
LC =
Z m,n СГ тп -М хХ У тП -М у )
SO ^ O y
where, µ is the mean and σ is the standard deviation.
The third index is the Rank order Correlation coefficient, Spearman RC, given by
RC = 1
61 m,n {Rank(xmn)-Rank(ymn)}2
S(S2-1)
where, the difference is between the ranks rather than the actual values.
3. Experimental Results
The three indices given by (6)–(8) are evaluated for the proposed EQ, using (1), against the traditional RMSE, SSIM [4], and GMSD [8] quality measures. Two versions of the proposed scheme will be tested, see (4), namely EQ MeanMax , 0.3 mean{D} + 0.7 max{D}, and EQ 0.99Rank . However, slight deviations can improve performance in an image dependent fashion.
Table 1. shows the evaluations for the intensity component only. It is clear that the two versions of the proposed scheme are superior to SSIM and RMSE in all aspects. However, it is superior to GMSD in terms of absolute difference but inferior in terms of correlation.
In a similar fashion, Table 2. shows the rsults using the RGB components. GMSD only uses gradient and hence the values are the same. A similar conclusion can be drawn regarding the comparison with other schemes.
Unfortunately, comparisons are dependent on MOS. Hence, some distortion types may experience biased results. In fact, for some distortions, the relative distance between the levels of degradation is better acquired by EQ rather than SSIM or GMSD. However, more elaboration is required in future work.
Interestingly, MAE and LC are better for EQ using RGB component than using the intensity component alone. This note is worth further exploration as what are the best features to be incorporated.
Unfortunately, the variants of (5) were not superior to that of (1).
4. Conclusion and Future Work
An Eigen structure is proposed in this paper to perform image quality assessment. The proposed schemes are very effective as demonstrated by the values of MAE, Pearson, and Spearman correlation coefficients. Comparison with SSIM and GMSD indicate the remarkable performance of the proposed scheme EQ.
Work is currently in progress to explore other color spaces, the information from the Eigen vectors, and other Eigen values. In addition, the effect of scaling, normalizing, and aggregation.
The component added to obtain a unit vector in (1) can be generalized to any fuzzy complement. However, more work is needed to find the best formula and whether improvements can be attained, see [18] for some suggestions.
The proposed scheme can be generalized to RR-IQA by comparing some statistics between the degraded and original images. A no reference NR-IQA was tested, however, it is limited to certain degradation types.
Table 1. MAE, LC, and RC for the schemes RMSE, SSIM, GMSD, EQ MeanMax , and EQ 0.99Rank using the intensity component only.
|
RMSE SSIM GMSD EQ MeanMax EQ 0.99Rank |
|
|
MAE LC RC |
0.461 0.372 0.434 0.144 0.176 0.567 0.695 0.855 0.713 0.736 0.640 0.679 0.804 0.751 0.759 |
Table 2. MAE, LC, and RC for the schemes RMSE, SSIM, GMSD, and EQ using RGB components.
|
RMSE |
SSIM |
GMSD |
EQ MeanMax |
EQ 0.99Rank |
|
|
MAE |
0.450 |
0.329 |
0.434 |
0.128 |
0.162 |
|
LC |
0.597 |
0.633 |
0.855 |
0.746 |
0.753 |
|
RC |
0.686 |
0.629 |
0.804 |
0.748 |
0.749 |
References EQ: An Eigen Image Quality Assessment based on the Complement Feature
- M. Pedersen and Y. Hardeberg, “Survey of full-reference image quality metrics,” The Norwegian Color Research Laboratory, Gjøik University College, ISSN: 1890-520X, 2009.
- B. Hu, L. Li, J. Wub, and J. Qian, “Subjective and objective quality assessment for image restoration: A critical survey,” Signal Processing: Image Communication, 85, pp 1-19, 2020, https://doi.org/10.1016/j.image.2020.115839.
- G. Zhai, and X. Min, “Perceptual image quality assessment: a survey,” Sci. China Inf. Sci. 63, 211301, 2020, https://doi.org/10.1007/s11432-019-2757-1.
- Z. Wang, A. Bovik, H. Sheikh and E. Simoncelli, “Image quality assessment: From error visibility to structural similarity,” IEEE Transactions on Image Processing, 13: pp 600-612, 2004, DOI: 10.1109/TIP.2003.819861.
- L. Zhang, L. Zhang, X. Mou and D. Zhang, “FSIM: a feature similarity index for image quality assessment,” IEEE Transactions on Image Processing, 20(8), pp. 2378-2386, 2011, doi: 10.1109/TIP.2011.2109730.
- A. Beghdadi, and B. Popescu, “A new image distortion measure based on wavelet decomposition,” Seventh International Symposium on Signal Processing and Its Applications, pp. 485-488, 2003, doi: 10.1109/ISSPA.2003.1224745.
- H. Sheikh, A. Bovik, and G. deVeciana, “An information fidelity criterion for image quality assessment using natural scene statistics,” IEEE Trans. Image Processing, 14(12), pp. 2117-2128, 2005, doi: 10.1109/TIP.2005.859389.
- W. Xue, L. Zhang, X. Mou and A. Bovik, “Gradient magnitude similarity deviation: a highly efficient perceptual image quality index,” IEEE Trans. Image Processing, 23(2), pp. 684-695, 2013, doi: 10.1109/TIP.2013.2293423.
- K. Sharifi, and A. Leon-Garcia, “Estimation of shape parameter for generalized Gaussian distributions in subband decompositions of video,” IEEE Transactions on Circuits and Systems for Video Technology, 5(1), pp. 52-56, 1995, doi: 10.1109/76.350779.
- A. Moorthy, and A. Bovik, “Blind image quality assessment: from natural scene statistics to perceptual quality,” IEEE Transactions on Image Processing, 20(12), pp. 3350-3364, 2011, doi: 10.1109/TIP.2011.2147325.
- M. Saad, A. Bovik, and C. Charrier, “Blind image quality assessment: a natural scene statistics approach in the DCT domain,” IEEE Transactions on Image Processing, 21(8), pp. 3339-3352, 2012, doi: 10.1109/TIP.2012.2191563.
- A. Mittal, A. Moorthy, and A. Bovik, “No-reference image quality assessment in the spatial domain,” IEEE Transactions on Image Processing, 21(12), pp. 4695-4708, 2012, doi: 10.1109/TIP.2012.2214050.
- Y. Zhang, and D. Chandler, “No-reference image quality assessment based on log-derivative statistics of natural scenes,” J. of Electronic Imaging, 22(4), pp 043025 1-22, 2013, https://doi.org/10.1117/1.JEI.22.4.043025.
- L. Zhang, L. Zhang, and A. Bovik, “A feature-enriched completely blind image quality evaluator,” IEEE Transactions on Image Processing, 24(8), pp. 2579-2591, 2015, doi: 10.1109/TIP.2015.2426416.
- P. Ye, J. Kumar, and D. Doermann, “Beyond human opinion scores: blind image quality assessment based on synthetic scores,” IEEE Conference on Computer Vision and Pattern Recognition, pp. 4241-4248, 2014, doi: 10.1109/CVPR.2014.540.
- J. Redi, P. Gastaldo, I. Heynderickx and R. Zunino, “Color distribution information for the reduced-reference assessment of perceived image quality,” IEEE Transactions on Circuits and Systems for Video Technology, 20(12), pp. 1757-1769, 2010, doi: 10.1109/TCSVT.2010.2087456.
- K. Gu, G. Zhai, X. Yang and W. Zhang, “A new reduced-reference image quality assessment using structural degradation model,” IEEE International Symposium on Circuits and Systems (ISCAS), Beijing, pp. 1095-1098, 2013, doi: 10.1109/ISCAS.2013.6572041.
- S. Ameer, “Image thresholding using the complement feature,” American Journal of Engineering and Applied Sciences, pp 311–317, 2020.
- I. Jolliffe and J. Cadima, “Principal component analysis: a review and recent developments,” Phil. Trans. R. Soc. A. 374: 20150202, http://doi.org/10.1098/rsta.2015.0202. 2016.
- A. Shnayderman, A. Gusev, and A. Eskicioglu, “An SVD-based grayscale image quality measure for local and global assessment,” IEEE Transactions on Image Processing, 15(2), pp. 422-429, 2006, doi: 10.1109/TIP.2005.860605.
- Z. Wang, and Q. Li, “Information content weighting for perceptual image quality assessment,” IEEE Transactions on Image Processing, 20(5), pp. 1185-1198, 2011, doi: 10.1109/TIP.2010.2092435.
- N. Ponomarenko et al, “Color image database TID2013: peculiarities and preliminary results,” Proceedings of 4th Europian Workshop on Visual Information Processing EUVIP2013, pp. 106-111, 2013.
