Establishment of automated technique of FHR baseline and variability detection using CTG: statistical comparison with expert’s analysis

Author: Sahana Das, Kaushik Roy, Chanchal K. Saha
Journal: International Journal of Information Engineering and Electronic Business @ijieeb
Article in issue: 1 vol.11, 2019.
Free access
The most widely accepted method of monitoring the fetal heart rate and uterine activity of the mother is using Cardiotocograph (CTG). It simultaneously captures these two signals and correlate them to find the status of the fetus. This method is preferred by obstetricians since it is non-invasive as well as cost-effective. Though used widely, the specificity and predictive precision has not been undisputable. The main reason behind this is due to the contradiction in clinicians opinions. The two main components of CTG are Baseline and Variability which provide a thorough idea about the state of the fetal-health when CTG signals are inspected visually. These parameters are indicative of the oxygen saturation level in the fetal blood. Automated detection and analysis of these parameters is necessary for early and accurate detection of hypoxia, thus avoiding further compromise. Results of the proposed algorithm were compared with the visual assessment performed by three clinicians in this field using various statistical techniques like Confidence Interval (CI), paired sample t-test and Bland-Altman plot. The agreement between the proposed method and the clinicians’ evaluation is strong.
Cardiotocograph, Fetal Heart Rate, Baseline, Baseline Variability, Paired sample t-test
Short address: https://sciup.org/15016161
IDR: 15016161 | DOI: 10.5815/ijieeb.2019.01.04
Text of the scientific article Establishment of automated technique of FHR baseline and variability detection using CTG: statistical comparison with expert’s analysis
Published Online January 2019 in MECS
During pregnancy it is necessary to assess the condition of the fetus, in late gestational period and during labor. Fetus at this stage may suffer from chronic or acute intrauterine assault resulting in fetal compromise. An alteration in the heart rate of the fetus during or before labor suggests that the baby is hypoxic. Prolonged asphyxia can lead to hypoxia – a condition that reduces blood supply to the tissues. If hypoxic condition sustains for too long it may lead to permanent neurological damages such as cerebral palsy and in worst cases it may even lead to the death of the fetus during labor or shortly thereafter. In order to avoid complications it is necessary to detect hypoxia and make intervention at the earliest possible stage [1]. From the temporal relationship between fetal heart rate (FHR) and uterine contraction pressure (UCP), provided by the concurrent recording of these two signals, it is possible to analyze the condition of the fetus. Visual assessment of CTG trace is commonly practiced in the medical-world as it is considered a faster method. However the precision this method depends mainly on the knowledge and experience of the clinicians involved. Also, there are subtle components of CTG that are indicative of fetal distress, but are not easily decipherable by mere visual assessment. Discrepancies in interpretation and false positive diagnosis has led to fatalities and eventual lawsuits. It is thus necessary to design automated decision support systems that are better equipped to handle these issues [2].
The automated systems so far designed range from simple crisp-logic based feature extraction and classification system to elaborate systems based on soft-computing based techniques that take into account the inherent uncertainties present in the medical diagnosis.
-
A. Related Works on CTG
Several attempts were made in last few decades to automate the analysis of CTG. These include classic approaches like filtering of FHR signals to soft computing based technique using Artificial Neural Network [3].
First step towards the automation of CTG feature extraction and analysis was taken by Dawes and Redman in 1981. This later led to the development of System
8000 which was commercialized as Sonicaid FetalCare [4]. In 1995 Alonso-Betanzos developed NSTEXPERT that is proficient enough for auto-diagnosing and proposing treatments [5]. This was later improved to produce CAFE in 2002 by Guijjaro-Berdinas and Alonso-Betanzos [6]. CAFE is a neuro-fuzzy based system for automating the tasks associated with the analysis of CTG [6]. SisPorto, which uses expert system to estimate the different features of CTG, was developed at the University Of Porto, Portugal by Diego Ayres-de Campos over a span of 14 years. The current version of SisPorto that is being used commercially is Omniview SisPorto 3.5 [7]. It uses a five tier classification instead of normal three tier classifications used by the other systems.
Magenes and Signorini developed 2CTG2 in 2003 [8]. K2 Medical System consists of a central unit and several local units which are located by the side of patient’s bed. It was developed in 2002 by Green and Keith of University of Plymouth, UK. When an abnormality in FHR is detected an alarm rings to alert the caregiver [9]. In 2009 they upgraded the system to INFANT which is considered an intelligent system as it can provide logical justification of the diagnosis. All these systems discussed so far are based on FIGO guideline [10].
Based on NICHD guidelines PeriCALM was developed in 2010 by LMS Medical System of Canada and USA [11]. So far only Omniview SisPorto and Sonicaid are used commercially, but the others failed to make much impact.
The paper is organized as follows: Section two gives a brief description of Cardiotocograph, section three describes the methods used in estimating the Baseline and Baseline Variability, in section four a brief discussion of the results are given and the conclusion of the work is given in section five.
-
II. Cardiotocograph
Cardiotocograph, the machine used to perform CTG has been used as a tool for fetal monitoring since 1960. Two ultrasound transducers are placed on the abdomen of the mother. One picks up the FHR signal and the other is used to measure the UC pressure of the mother. Changes in FHR signals and their timings relative to uterine contraction (UC) pressure provide an insight into the status of the fetus [1]. CTG is a non-invasive and costeffective tool whose introduction into the clinical practice considerably reduced child mortality and morbidity [12].
The features of FHR are: Baseline, Variability, Acceleration and Deceleration, each of which needs to be classified as Reassuring, Non-Reassuring and Abnormal in order to properly interpret the CTG [13]. Among these four, Baseline is the most vital feature since rest of the features directly depend on it. The robustness of the algorithm for the estimation and classification of Baseline is essential for accurate interpretation in an automated fetal monitoring system. [12].
-
A. Guidelines for FHR Interpretation
CTG has been an essential tool of modern labor room since 1960s. Since the interpretation and inference varies with clinicians, it has not gained popularity. National Institute of Child Health and Human Development (NICHD) [14] has formulated the guidelines for interpretation of CTG traces to obviate the dichotomy of opinion. This guideline is considered to be the benchmark for all CTG trace related evaluation and interpretation both visually and automatically [15].
One major restriction related to these guidelines is the style of explanation of the features of fetal heart rate. The interdependence of the other parameters of FHR and the baseline have added to the complexity of the guidelines. All these things together contributed to the restrictions of effective CTG monitoring [16].
-
B. Baseline and Baseline Variability
According to the guideline provided by the NICHD [15] FHR should be determined in a 10 minutes window by approximating the mean FHR rounded to 5 bpm after excluding the periodic and episodic changes. In a 10 minutes window identifiable baseline should be minimum of 2 minutes, otherwise the baseline for that segment is indeterminate.
Another key indicator in the evaluation of fetal wellbeing is the FHR Variability (FHRV). Again it is estimated in a 10-minutes window after eliminating the acceleration and deceleration. v ariability is defined as irregular variations in the fhr baseline in both frequency and amplitude. Visually it is measured as the amplitude of the peak-to-trough in bpm. Loss of variability indicates the emergence of hypoxia.
FHR variability provides objective conclusion of antepartum and intrapartum CTG traces. Sympathetic and parasympathetic influences of fetal brain mainly control the variability of fetal heart. Variability is reduced during fetal sleep, but returns after an interval of 20 – 40 minutes. Progressively reduced variability may not by itself indicate fetal jeopardy, but when combined with other abnormalities may indicate fetuses’ intolerance to labor.
-
C. Challenges in CTG Interpretation
Accurate interpretation of CTG is a challenging task due to several factors. Visual analysis is not sufficient to decipher all the information carried by the FHR signal. There are guidelines provided by NICHD for the identification, classification and analysis of each feature. However, these guidelines are not standardized. Thus, the extraction of features of FHR using rules derived from these guidelines coupled with visual interpretation gives rise to inter- and intra-observer variations.
The second problem arises in interpreting the signal pattern for border-line cases. Again, none of the standard guidelines provide any solution to this problem. Such cases are critical in the sense that incorrect identification of the gray zone may prove fatal for the unborn child. Diagnostic accuracy is found to be worst for these areas.The third problem is related to the experience of the clinicians. FHR signals have various patterns – each with a different significance. It is difficult even for an experienced clinician to memorize the combinations of patterns and their implications.
To circumvent these problems, the clinically relevant aspects of CTG needs to be analyzed using automated methods.
In spite of the easy availability of algorithms for CTG interpretation, none has shown promise in detecting FHR baseline and variability in a precise manner. So the beast method is yet to be formulated, which precisely detects the parameters in case of regular, irregular and complex traces [12].
-
III. Methodology
-
A. Estimation of Baseline
The database of Czech Technical University, Department of Cybernatics [17] has been used in our work. The proposed algorithm was tested using 55 samples from this database. First 30 minutes of each 90 minutes trace had been used. Four samples of FHR signal are taken per second.
Real baseline was calculated iteratively based on the estimation of initial virtual baseline Bvir within each 10 minutes window. Consequence of this on the signal is ultimately annulled as the iterative calculation of modified baseline B mod tends towards the original baseline Borg.
Bmo d → Borg (1)
In this approach all the accelerations and decelerations are first removed. Detectable baseline in each window should have a minimum duration of two minutes, not essentially contiguous. A 10 minutes window is said to have an acceptable baseline value only if this condition is satisfied [18]. Overlapping windows were used for baseline estimation with overlap duration ranging from 1 minute – 10 minutes. The overlap value that gives the best estimation of baseline was chosen.
Weighted average of Bmod values give the value of Bmod′. After Bmod′ is calculated for each 10 minutes interval, Bavg, which is the baseline B for that particular sample, is obtained. є is a very small value of the order of 0.0001 [18]. The flowchart of the algorithm is shown in Fig, 1. The baseline thus obtained is shown in Fig. 2.
For the calculation of standard deviation σ, signal values within each window were noted, followed by calculation of difference between consecutive windows. Same process is performed with windows containing different slide-lengths. Furthermore, average σ values of all samples were used to calculate the final average σ value σ avg_j for a given slide-length.
avg _ j
i
N
i = 1… N, are the N samples of FHR values under consideration and j = 1… 10, the slide lengths of duration ranging from 1min – 10 minutes. σ i is the standard deviation value for each sample. The minimum average standard deviation is calculated as follows:
^avgmin = mining_j b (3)
The baseline value B of the slide-length with the minimum average standard deviation is compared with the visual assessment given by three obstetricians using different statistical methods. This value is compared with the value obtained for discreet window as suggested by the NICHD [18].
-
B. Estimation of Baseline Variability
FHRV was calculated in each 10 minutes segment separately. If the number of cycles in each window exceeds one then that window has identifiable baseline variability value.
FHRV is the standard deviation of the FHR values at each point. FHRV i is the value of variability in each segment where the number of cycles C≥1. Variability value in a 10-minute window is
FHRV = Z FHRV . (4)
The flowchart of the algorithm for variability estimation is shown in f ig 3 .
-
C. Statistical Analysis of the Baseline Estimation
Three obstetricians separately evaluated the FHR signals and provided a visual estimation of the baseline values for all the 55 data. Comparison between the proposed algorithm and the doctor’s estimation are done using various statistical methods like mean, standard deviation, error margin and Confidence Interval of 95%. Comparison of clinicians’ assessment and the proposed method are shown in Table 1.
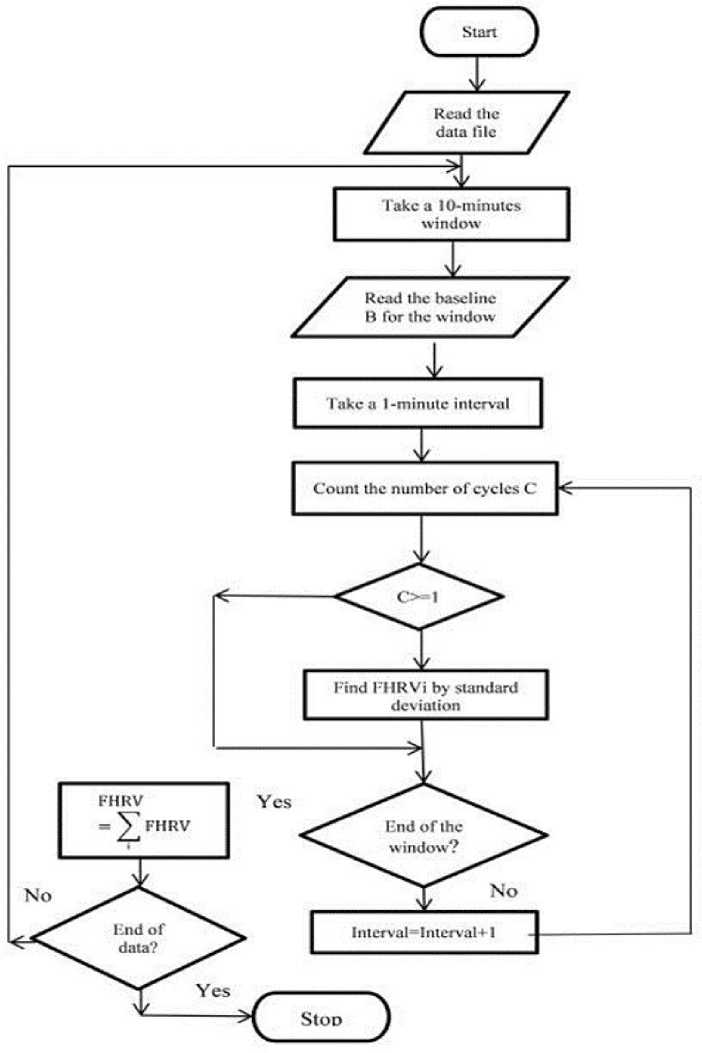
Fig.1. Algorithm for baseline estimation.
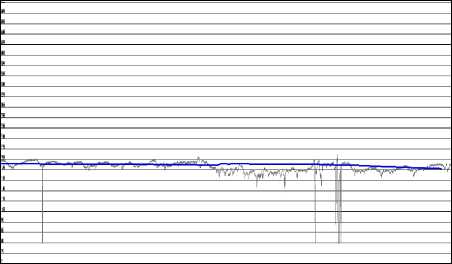
Fig.2. Obtained baseline.
Mean:
Standard Deviation:
Standard Error:
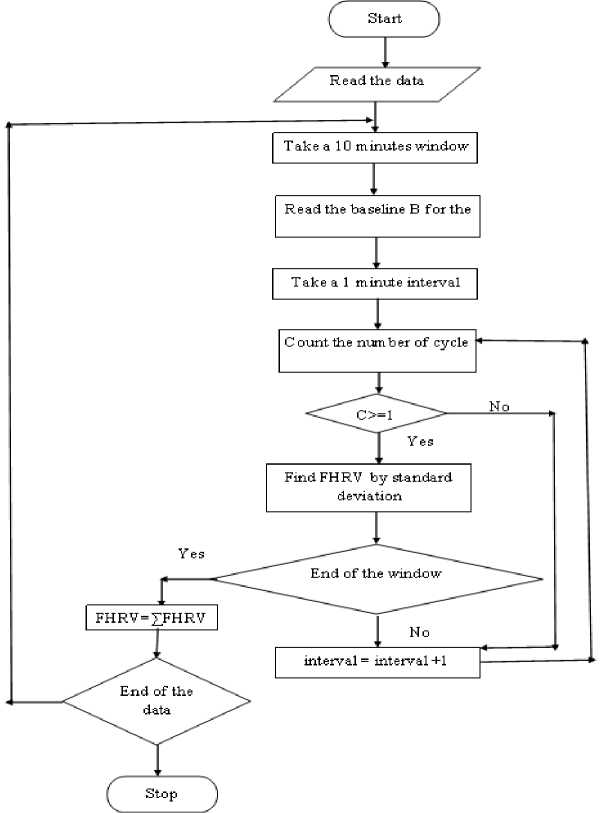
Fig.3. Algorithm for baseline variability estimation.
Margin of Error :
∑ xi x= i
N
∑N (x-µ)2
σ = i = 1
N
SE = σ
Confidence Interval:
CI =x ±m
N
1.96 is the confidence coefficient
Table 1. Estimated Values of Baseline and the Readings Given by the Obstetricians
|
C |
Doc1 |
Doc2 |
Doc3 |
Avg |
Discreet window result |
Window with 3 mins. overlap result |
|
1 |
142 |
144 |
144 |
143.333 |
143.34 |
143.67 |
|
2 |
145 |
157 |
144 |
148.6 |
153.8 |
152.28 |
|
3 |
150 |
150 |
154 |
151.3 |
151.5 |
147.81 |
|
4 |
140 |
140 |
140 |
140 |
130.4 |
136.73 |
|
5 |
135 |
136 |
138 |
136.3 |
132.9 |
133.59 |
|
6 |
160 |
162 |
160 |
160.6 |
160.2 |
158.91 |
|
7 |
145 |
145 |
148 |
146 |
148.4 |
145.8 |
|
8 |
168 |
160 |
157 |
161.67 |
162.2 |
160.58 |
|
9 |
132 |
135 |
135 |
134 |
136 |
134.54 |
|
10 |
129 |
128 |
130 |
129 |
130.31 |
129.67 |
t-test were performed to verify the initial assumption [17].
The estimations are:
Variance of the differences is given by
Table 2. Statistical Evaluation of Observed and Estimated Values of the Baseline
|
Observed |
Estimated (with discreet 10 minutes window) |
Estimated (with 3 minutes overlap) |
|
|
Mean |
144.89 |
143.34 |
142.39 |
|
Std. dev. |
10.63 |
11.83 |
10.99 |
|
Error Margin |
4.39 |
4.88 |
4.54 |
|
Std. Error |
2.12 |
2.37 |
2.20 |
|
CI upper bound |
149.28 |
148.22 |
146.93 |
|
CI lower bound |
140.51 |
138.46 |
137.86 |
2d ст = , = ст2/
V /( N -1)
d is the mean difference between the pairs of values. The number of standard deviations from the observed mean difference is from zero (t-value):
d
ст2/
/( N - 1)
For the window-size 10 minutes with slide-length of 3 minutes the minimum average standard deviation is calculated. Paired sample t-test and Bland-Altman Plot were used to compare the above mentioned estimate with the estimate for discreet window of size 10 minutes and average of physicians observed values as shown in Table 2.
C. Degree of Agreement Among the Observed and Estimated Values of Variability
Table 3 depicts the average values of three clinicians’ observation and the estimate of FHRV derived from the proposed algorithm. Accuracy of the algorithm cannot be proved directly. Statistical methods were used to verify whether the proposed algorithm is as good as the estimates given by the clinicians.
Paired Sample t-test
Initially it is assumed that the two sets of readings, i.e. the evaluated value and clinical observation value, have a mean difference of zero. The level of significance is 5% or α = 0.05; this is the probability threshold below which the above conjecture is overruled. Since the same group of data were used for both the evaluations repeated measure design was used. Thus, two-tailed paired sample
Bland-Altman Approach
Result of the test is shown in Table 4. Since the p-value for all the three windows is above the level of significance, the initial assumption cannot be rejected right away. However, it cannot be accepted either. The best way of assessing the agreement is to use the Bland-Altman method [19].
95% CI were computed for the bias using these values as d ± t * SEa(12)
and 95% CI of the lower limit of agreement is calculated as
(d-1.96СТ )± (t * 8е511„, )
and CI of the upper limit of agreement is calculated as
(d + 1.96ст )±( t * SE3±L96ct )
These results are shown in Table 5.
Table 3. Variability Values Given by the Clinicians and the Estimated Values Obtained using the Proposed Method
|
Window 1 |
Window 2 |
Window 3 |
||||
|
Experimen t |
Obsv avg |
Experiment |
Obsv avg |
Experiment |
Obsv avg |
|
|
1 |
7.858 |
9 |
5.515 |
6 |
5.833 |
9 |
|
2 |
4.722 |
6.5 |
2.919 |
5.5 |
4.318 |
6 |
|
3 |
2.288 |
6.5 |
4.125 |
6.5 |
5.156 |
6.5 |
|
4 |
7.290 |
5.5 |
11.94 |
4.5 |
6.592 |
10 |
|
5 |
3.518 |
7 |
9.406 |
6 |
12.718 |
9 |
|
6 |
5.518 |
8.5 |
8.094 |
6 |
6.655 |
8.5 |
|
7 |
3.554 |
4.5 |
8.813 |
6 |
9.064 |
11 |
|
8 |
8.153 |
7.5 |
8.5 |
8 |
7.948 |
8 |
|
9 |
6.22 |
6 |
7.2 |
6.5 |
7.445 |
7 |
|
10 |
4.954 |
4.5 |
4.83 |
5 |
5.239 |
4.5 |
Table 4. Result of the Paired Sample t -test
|
Mean |
Std. Dev |
SEM |
95% CI |
t/two-tailed |
p-value |
||
|
Lower |
Upper |
||||||
|
Win1-Obst. |
0.890 |
2.783 |
0.492 |
-1.044 |
1.902 |
1.827 |
0.077 |
|
Win2-Obst. |
1.116 |
3.795 |
0.671 |
-0.253 |
2.484 |
1.663 |
0.106 |
|
Win3-Obst. |
0.805 |
2.362 |
0.424 |
-0.062 |
1.671 |
1.897 |
0.068 |
Table 5.The precision of the prediction limits
|
Window 1 |
Window 2 |
Window 3 |
|
|
CI for bias |
-0.104 to 1.402 |
-2.484 to 2.522 |
-0.062 to 1.671 |
|
CI for lower limit |
-6.189 to -2.283 |
-10.918 to -6.191 |
-5.321 to – 2.328 |
|
CI for upper limit |
4.621 to 8.087 |
3.960 to 8.686 |
3.937 to 6.930 |

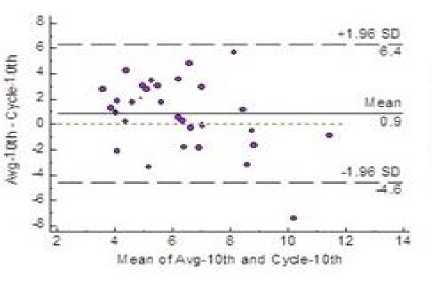
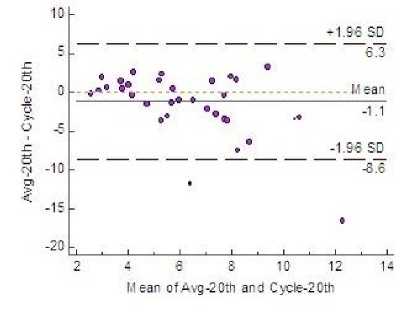
Fig.4. Bland-Altman Plot Showing 95% LoA
-
IV. Result and Discussion
-
A. Results of Baseline Estimation
Table 1 shows the result of baseline estimation by the clinicians and the estimation obtained using the proposed algorithm. The proposed algorithm of continuous overlapping windows apparently is a better method to estimate baseline as compared to NICHD protocol which uses 10 minutes discreet window for baseline estimation. The clinicians believe that earliest manifestation of abnormal baseline of fetal heart can be diagnosed more efficiently by this method.
Observer’s estimate and the estimate using three-minutes overlapping as well as discreet window are analyzed using various statistical means and the result is given in Table 2. The result of this analysis is slightly better for the three-minutes overlapping window.
-
B. Results of Variability Estimation
Estimation of variability of fetal heart rate is given in Table 3 for all the three windows along with the average of the estimates provided by three clinicians. Fig. 4 shows that both mean and bias line are close. Clinically acceptable bias, was defined a priori by the physicians at ±5.0 and the plot shows the bias values lie within this limit in all the three windows.
The Null hypothesis in this case study does not conclusively accept estimation of variability (p-value > 0.05). Thus to check if Null hypothesis could be accepted. Bland-Altman plot was use to compare and interpret the two sets of results.
A priori precision measurements, were defined as ±12. In Fig. 4 the plot shows that in windows 1 and 3 the LoA fall within the defined limit. Very scanty outliers stress the fact that the precision and predictive accuracy of the algorithm is satisfactory.
-
V. Conclusion
Automated, intrapartum fetal monitoring and prompt intervention could prevent perinatal mortality and morbidity of one-third of the current worldwide estimate of 6.3 million perinatal deaths [21]. The proposed algorithm aims to circumvent the fatalities the fetus experiences during the labor which sometimes go undetected until very late. The use of continuous window instead of discreet window for the estimation of baseline value is promising as clinicians agree that continuous window can detect changes in baseline at the earliest.
The proposed algorithm for baseline variability estimation can be used in place of the visual estimation performed by the obstetricians to measure the baseline variability since both the bias and the precision measurement do not exceed the a priori limit.
Self-diagnosis of the FHR trace is an integral part of an automated system wherein the proposed method of estimation can play a pivotal role. FHR trace of unborn fetuses experiencing any assault can be analyzed once the proposed algorithm is incorporated into the system; thus facilitating early interpretation. As a result, at the initial stage, it may largely eliminate the need of an expert, which is sometimes scarce in developing countries.
Acknowledgment
We would like to thank Biraj Mohini Matrisadan and Hospital for the help they had extended in the course of this work.
References Establishment of automated technique of FHR baseline and variability detection using CTG: statistical comparison with expert’s analysis
- Royal College of Obstetrician and Gynecologist (RCOG). The use of electronic fetal monitoring. London: Evidence Based Clinical Guideline Number 8, May 2001.
- D. Gravilis, I. G. Tsoulos, G. Georgoulas, E. Glavas, “Classification of fetal heart rate using grammatical evaluation,” Proceedings of IEEE Workshop on Signal Processing, System Design and Implementation. p. 425 – 429, 2005.
- S. Das, K. Roy, and C. K. Saha, “Fuzzy membership estimation using ANN: A case study in CTG analysis,” in Advances in Intelligent Systems and Computing, vol. 327, S. Satapathy, B. Biswal., S. Udgata, J. Mandal, Eds. India: Springer, 2014, pp. 221 – 227.
- G. S. Dawes, G. H. Vissar, J.D Goodman, C. W. Redman, “Numerical analysis of the human fetal heart rate: the quality of ultrasound records,” American Journal of Obstet. Gynecol, vol. 141, pp. 43 – 52, Sept. 1981.
- A. Alonso-Betanzos, “The NST-EXPERT project: the need to evolve,” Journal of Artificial Intelligence, Med, vol.7, pp. 297–313, August 1995.
- D. Ayres-de-Campos, P. Sousa, A. Costa, J. Bernerdes, “Omniview-SisPorto® 3.5 - A central fetal monitoring station with online alerts based on computerized cardiotocogram+ST event analysis,” Journal of Perinatal Medicine, 2008, vol. 36, pp. 260–264, 2008.
- B. Guijarro-Berdiñas, A. Alonso-Betanzos, “Empirical evaluation of a hybrid intelligent monitoring system using different measures of effectiveness,” J. Artificial Intelligence Medicine, vol. 24, pp.1– 6, Jan 2002.
- G. Magenes, M. G. Signorini, M. Ferrario, L. Pedrinazzi, D. Arduini, “Improving the fetal cardiotocographic monitoring by advanced signal processing”, 25th IEEE AICEMBS, IEEE press, vol.3, p. 2295 – 2298, Sept. 2003.
- K. Greene, R. Keith, K2 Medical System, 2002. Retrieved November 14, 2017, from http://www.k2ms.com/
- INFANT Study, 2009. Retrieved November 14, 2017, from http://www.k2ms.com/products/
- PeriCALM, 2010. Retrieved November 14, 2017from http://perigen.com/products/pericalm-tracings/
- S. Das, K. Roy, C.K. Saha, “A novel approach for extraction and analysis of variability of baseline,” Proceedings of the IEEE International Conference on RETIS. p. 336 – 339, Dec. 2011, India.
- E. Chandraharan, S. Arulkumaran, “Prevention of birth asphyxia: responding appropriately to cardiotocograph traces,” Journal of Best Practices and Research Clinical Obstetrics and Gynecology, vol. 21, pp. 609 – 624, March 2007.
- J. Jezewski, J. Wrobel, T. Kupka, “Baseline and Acceleration Episodes – Clinically Significant Nonstationarities in FHR Signal: Part I. Coefficients of Inconsistency,” in Advances in Intelligence and Soft Computing, vol. 30 M. Kurzynski, E. Puchala, M. Wozniak, A. Zolnierek, Eds. Poland: Springer, 2005, pp. 527 – 534.
- G. A Macones, et al. “The 2008 national institute of child health and human development workshop report on electronic fetal monitoring: update on definitions, interpretations and research guidelines,” Journal of Obstetric, Gynecologic and Neonatal Nursing, vol. 112, pp. 661 – 666, Sept. 2008.
- S. Santos, D. Ayres-de-Campos, “Human factors affecting the interpretation of fetal heart rate tracings: an uUpdate,” Current Opinion in Obstetrics and Gynaecology, vol. 24, pp. 84 – 88, March 2012.
- Czech Technical university in Prague and University Hospital in Brno database. Retrieved Dec. 8 2014 http://physionet.nlm.nih.gov/pn3/ctu-uhb-ctgdb/ downloaded on 08/12/2014
- S. Das, K. Roy, C. K. Saha, “Determination of window size for baseline estimation of fetal heart rate using CTG,” Proceedings of the Third IEEE International Conference on Computer, Communication, Control and Information Technology, p. 1 – 5, Feb. 2015.
- D. G. Altman, J.M. Bland, “Measurement in medicine: The analysis of method comparison studies,” The Statistician, vol. 32, pp. 307 – 317, Sept. 1983.
- D. G. Altman, J. M. Bland, “Measuring agreement in method comparison studies,” Statistical Methods in Medical Research, vol. 8, pp. 135 –160, June 1999.
- M. F. MacDorman, T. J. Matthews, A. D. Mohangoo, J. Zeitlin, “Internal comparisons of infant mortality and related factors: United States and Europe, 2010,” National Vital Statistics Reports, vol. 64, pp. 1 – 6, Sept. 2014.
