Estimate of air quality in valleys of Yegoshikha river and Danilikha river

Author: Klochikhina O.
Journal: Антропогенная трансформация природной среды @atps-psu
Section: Трансформация природной среды
Article in issue: 2 т.9, 2023.
Free access
The quality of air is the main issue that humankind faces every day. It is an essential aspect of health of the population. The objectives of this research are to determine what pollutants are the most significant and what sources of pollution are the greatest emitter in Perm. Data for this study comes from national net of measurements of air pollution of Rosgridromet and researches of air quality in different areas of Perm. There has been quantitative analysis of results of measurements that was hold close to valleys of minor rivers Danilikha and Yegoshikha in this study since 2016 to 2022. Air quality was estimated by comparing measurements of concentration of chemical substances with established hygienic standards. The analyzed data show that the main pollutants in air of Perm are Formaldehyde, Nitrogen Dioxide, Phenol and Ethylbenzene. Exceedances of maximum one-time concentrations of all significant pollutants were identified. Exceedances of daily mean concentrations of formaldehyde were observed during all the period of study. A possible explanation for presence of pollutants might be that burning of fossil fuels by transport and by fuel power industry, by impact of mechanical engineering plants. The results of this study indicate that the national net of measurements is non-effective and does not give enough information for estimation of air quality in Perm. We need to measure more pollutants, and to have more monitoring sites to determine the air quality and the impact of transport or industry or other sources of air pollution on human health.
Atmospheric air, sources of air pollution, pollutants, hygienic standards, transport, national net of measurements
Short address: https://sciup.org/147242783
IDR: 147242783 | UDC: 504.3.054 | DOI: 10.17072/2410-8553-2023-2-38-54
Оценка качества атмосферного воздуха в долине реки Егошиха и долине реки Данилиха
Атмосферный воздух - ключевая составляющая жизни на Земле. Загрязнение атмосферного воздуха - основная проблема, с которой сталкивается человечество по всему миру. Качество атмосферного воздуха в городах является важной составляющей здоровья населения. По данным Всемирной организации здравоохранения 91% мирового населения проживает в районах, где уровень загрязнения превышает допустимые значения. По данным Росгидромета в 40 городах Российской Федерации уровень загрязнения воздуха характеризуется как высокий и очень высокий. Основная цель исследования определить наиболее значимые и опасные загрязняющие вещества, присутствующие в воздухе г. Пермь, а также выявить источники, которые вносят наибольший вклад в загрязнение воздуха. В статье были проанализированы данные, полученные в результате наблюдений на постах государственной сети наблюдений Рогидромета, за 2016-2020 гг. Также были использованы результаты оценки качества атмосферного воздуха в различных районах г. Пермь. Для оценки качества воздуха были выбраны посты наблюдений, располагающиеся вблизи долин малых рек, в связи с тем, пониженные формы рельефа способствуют накоплению различных примесей в атмосферном воздухе. Качество воздуха было оценено путем сравнения полученных результатов измерений со значениями действующих гигиенических нормативов. Результаты анализа данных показали, что значимыми загрязняющими веществами в г. Пермь являются: формальдегид, азота диоксид, фенол и этилбензол. В течение всего периода наблюдений были выявлены превышения максимальных разовых концентрации указанных выше загрязняющих веществ, а также превышения среднесуточных концентраций формальдегида. Присутствие азота диоксида, формальдегида и этилбензола в атмосферном воздухе города объясняется значительными выбросами от сжигания органического топлива (транспорт, тепловая энергетика). Что подтверждают ранее проведенные исследования. Присутствие фенола в воздухе объясняется близостью предприятий машиностроительного комплекса к постам наблюдений. Результаты исследования выявили неэффективность государственной сети наблюдений, недостаточность постов наблюдений за загрязнением атмосферы в г. Пермь. В статье подчеркивается необходимость расширения сети наблюдений и увеличение количества измеряемых загрязняющих веществ для объективной оценки качества атмосферного воздуха в г. Пермь и оценки воздействия различных источников выбросов на здоровье населения.
Text of the scientific article Estimate of air quality in valleys of Yegoshikha river and Danilikha river
DOI:
DOI:
The air pollution is the vital issue that humankind faces every day. The quality of air is an essential aspect of health of the population.
According to World Health Organization (WHO) report 91% of all population lives in places where level of air pollution exceeds established standards. 4.2 million of death are result of negative effect of polluted air (2020). According to Rosgidromet final report about activity in 2019 and agenda of 2020, the level of air pollution is estimated as ‘very high’ or ‘the highest’ in 40 Russian cities with 13,5 million of population (2020).
The air quality in city depend on many aspects, which are topographic features, features of buildings, prevailing wind direction and speed, microclimate features, demographic, industrial and traffic load [26].
Evolution of level of air pollution happen by influence of many factors, which are volume of emission, characteristics of sources of emission, their location in the territory of the city, features of building, physico-geographical conditions of the city, presence of river, prevail meteorological conditions [25]. Topographic features, especially presence of low forms of relief (cloughs, valleys of minor rivers) and significant level variations, influence on accumulation of pollutants in atmospheric air [6, 24].
The major emitters in the city are industrial facilities, power plants, waste water treatment facilities and all kinds of transport [4, 27].
Industrial plants of different sectors are located in Perm. Composition of pollution of industrial plants is specific and combined by pollutants with different level of potential danger for the environment and for the human health. For example, mechanical engineering plants are sources of sulfur dioxide, phenol, metal oxides, such as diiron trioxide, titanium dioxide, magnesium oxide, aluminium oxide, cupric oxide, chromium [16]. Oil refineries are sources of hydrogen sulphide, hydrocarbons, mercaptans, some acids and aldehydes [14]. Plants of building sectors are sources of particulate matters and organic compositions [14].
Sharp growth of car park, rise of vehicle density, cluster of vehicles on main roads and its crossings, lead to growth of volume of emission in the city [4]. Key features of mobile sources of air pollution are location of exhaust stack of vehicle on the level of human breathing, closeness to residential quarters and low dispersion in the atmospheric air [8]. Main pollutants that are emitted by transport are nitrogen oxides, sulfur dioxide, carbon, carbon oxide, formaldehyde, hydrocarbons. Also transport are sources of particulate matters that presented by dust from fretting and attrition of tires [14].
The monitoring of air quality is the main area of activity of Federal services for Hydrometeorology and Environmental Monitoring (2020). The most important guidance document regulated all part of environmental monitoring is Manual of air pollution monitoring (RD 52.04.189-91) that is published in 1991.
System of measurements was created to reduce negative impact of air pollution on human health [25]. The national net consists of 7 monitoring sites, which are located in six different areas of Perm close to main traffic routes and industrial hubs [25]. It is significant disadvantage.
There is little quantitative analysis of measurements of the concentration of pollutants during the period from 2016 to 2022 in this study. Results of measurements from monitoring sites located in valleys of minor rivers are analyzed during the study. Conditions which facilitate accumulating of pollutants are formed in valleys of minor rivers due to microclimate features, which are connected with level variations.
Minor rivers cover huge distances and cross over residential areas of Perm. The most of valley of Yego-shikha river passes through multistoried Motovilihinsky and Sverdlovsky areas of Perm. The river is crossed by north dam, middle dam, south dam and Chkalova motorway. There is Bulvar Gagarina motorway of a substantial length along the mouth of the river at a distance of 0.17-1.02 km.
There is territory of industrial area ‘Yuzni” which is located 5.4 km to the west form the mouth of Yegoshikha (JSC «UEC-Aviadvigatel», OJSC «Proton – Perm Motors», JSC «Remos – Perm Motors», JSC «Reductor – Perm Motors», JSC «ELKAM ArtEfficial Lift»). Several garages, stores, car service and petrol stations are located in the valley of the Yegoshikha river.
Valley of Danilikha river passes through multistoried Dzershinsky and Sverdlovsky areas of Perm. The river is crossed by Chkalova and Shosse Kosmonavtov motorways. There is railway of a substantial length along the mouth of the river at a distance of 0.2–1.00 km. The Geroev Hasana and Vasilya Vasilyeva motorways also length along the mouth of the Dahilikha river.
There is territory of industrial area ‘Yuzni” between Kuibysheva and Geroev Hasana streets which is located 5.4 km from the mouth of Danilikha (JSC «UEC – Perm Engines»). There is territory of LLC «Prikamskaya gipsovaya companya» which is located 8.7 km from mouth of Danilikha river. Several garages, stores, car service and petrol stations are located in the valley of the Danilikha river.
Materials and Methods
Air quality in valleys of minor rivers (Danilikha and Yegoshikha) in Perm was estimated by results of measurements which were conducted in monitoring stations included into the national net of measurements of Rosgidromet on the territory of Perm region.
According to National standard 17.2.3.01-86 «Nature protection. Atmosphere. Air Quality Control Regulations for Populated Areas» number of monitoring stations is determined depending on population. 10–20 monitoring stations are needed for estimation of air quality in cities with 1 million of population.
There are 7 monitoring stations for measurements of air quality in 6 areas of Perm. Air quality monitoring station #12 is located at Kachkanarskaya st., 45, the station #13 is located at Uralskaya st., 91; the station #14 is located at L.Shatrova st., 1; the station #16 is located at Pushkina st., 112; the station #17 is located at crossroad of Glinka st. and Sviyazeva st; the station #18 is located at Pobedy st., 41; the station #20 is located at Krupskoi st., 83B. All monitoring stations are located close to main traffic routes and industrial hubs.
Data from air quality monitoring stations #14 and 20 which are located at Shatrova st, 1 and Krupskoi st., 83B was used to estimate air quality in valley of Yegoshikha river. Data from air quality monitoring station #16 which is located at Pushkina st, 112 was used to estimate air quality in valley of Danilikha river (Fig. 1 / Рис. 1).
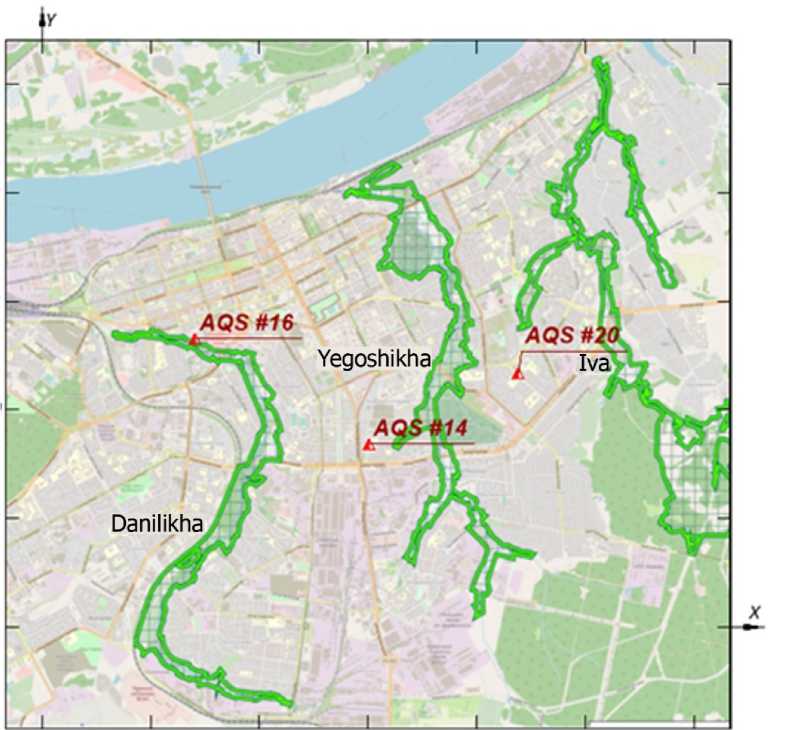
Fig. 1. Location of air quality stations
Рис. 1. Расположение станций контроля качества воздуха
Air sampling on the level of human breathing is proceeded during the measurements of air quality in monitoring stations. After that maximum one-time and daily mean concentrations of pollutants are determined in the air.
According to interstate standard GOST 17.2.3.01-86 (2005) measurements are conducted daily by continuous registration and discretely through equal periods of time minimum four times a day at 01, 07, 13 and 19 local time. It lets us get information about maximum one-time and daily mean concentrations of pollutants. Annual mean concentrations of pollutants are calculated.
The list of measured pollutants in air quality monitoring stations includes 24 items. The list of pollutants with their classes of hazard and values of maximum permissible concentrations is presented on Table 1 / Таблица 1. Classes of hazard and values of maximum permissible concentrations are established in Sanitary Rules and Regulations 1.2.3685-21 “Hygienic Standards and Demands to Security
Support and (or) Harmlessness for Human Health of Habitat Factors” (2021).
The greatest share from all volume of measurements of emission goes to highly hazardous and moderately hazardous substances. It is around 38 % for both groups. Compared with these two groups of substances share of measurements of enormously hazardous substances is less and it is 17%. The most significant share of measurements is conducted for criteria pollutants, such as nitrogen dioxide, nitrogen oxide, sulfur dioxide, carbon monoxide and particulate matter.
There are pollutants which are carcinogenic to humans (Groups 1 and A) and probably carcinogenic to humans (Groups 2B and B1) in the list. Information about risk index of carcinogenic effects of measured pollutants according to IARC Monographs on the Identification of Carcinogenic Hazards to Humans and Risk Assessment for Carcinogenic Effects is presented in Table 2 / Таблица 2.
Table 1
The list of measured pollutants
Перечень загрязняющих веществ, по которым осуществляются наблюдения на ПНЗ
Таблица 1
|
Pollutant // Загрязняющее вещество |
Class of hazard // Класс опасности |
Value of onetime MPC, mg/m³ // Значение ПДК м.р., мг/м³ |
Value of daily mean MPC, mg/m³ // Значение ПДК с.с, мг/м³ |
Value of annual mean MPC, mg/m³ // Значение ПДК с.г, мг/м³ |
||
|
Code // код |
CAS number // регистрационный номер CAS |
Name // наименование |
||||
|
1 |
2 |
3 |
4 |
5 |
6 |
7 |
|
0123 |
1309-37-1 |
Iron(III)oxide // диЖелезо триоксид |
3 |
– |
0,04 |
– |
|
0133 |
7440-43-9 |
Cadmium(II)oxide // Кадмий оксид |
1 |
– |
0,0003 |
– |
|
0143 |
– |
Manganese // Марганец и его соединения |
2 |
0,01 |
0,001 |
0,00005 |
|
0146 |
1317-38-0 |
Cupric oxide // Медь оксид |
2 |
– |
0,002 |
0,00002 |
|
0163 |
7440-02-0 |
Nickel // Никель и его соединения |
2 |
– |
0,001 |
0,00005 |
|
0184 |
7439-92-1 |
Lead // Свинец и его неорганические соединения |
1 |
0,001 |
0,0003 |
0,00015 |
|
0203 |
18540-29-91 |
Chromium // Хром |
1 |
– |
0,0015 |
0,000008 |
|
0207 |
1314-13-2 |
Zinc oxide // Цинк оксид |
3 |
– |
0,05 |
0,035 |
|
0301 |
10102-44-0 |
Nitrogen dioxide // Азота диоксид |
3 |
0,2 |
0,1 |
0,04 |
|
0303 |
7664-41-7 |
Ammonia // Аммиак |
4 |
0,2 |
0,1 |
0,04 |
|
0304 |
10102-43-9 |
Nitrogen oxide // Азота (II) оксид |
3 |
0,4 |
– |
0,06 |
|
0316 |
7647-01-0 |
Hydrogen chloride // Гидрохлорид |
2 |
0,2 |
0,1 |
0,02 |
|
0330 |
7446-09-5 |
Sulfur dioxide // Сера диоксид |
3 |
0,5 |
0,05 |
– |
|
0333 |
7783-06-4 |
Hydrogen sulfide // Дигидросульфид |
2 |
0,008 |
– |
0,002 |
|
0337 |
630-08-0 |
Carbon monoxide // Углерода оксид |
4 |
5,0 |
3,0 |
3,0 |
|
0342 |
7664-39-3 |
Hydrogen fluoride // Фтористые газообразные соединения |
2 |
0,02 |
0,014 |
0,005 |
|
0602 |
71-43-2 |
Benzene // Бензол |
2 |
0,3 |
0,06 |
0,005 |
|
0616 |
1330-20-7 |
Xylene // Ксилолы |
3 |
0,2 |
– |
0,1 |
|
0621 |
108-88-3 |
Toluene // Толуол |
3 |
0,6 |
– |
0,4 |
|
0627 |
100-41-4 |
Ethylbenzene // Этилбензол |
3 |
0,02 |
– |
0,04 |
|
0703 |
50-32-8 |
Benzo[a]pyrene // Бенз(а)пирен |
1 |
– |
0,000001 |
0,000001 |
|
1071 |
108-95-2 |
Hydroxybenzene // Гидроксибензол (Фенол) |
2 |
0,01 |
0,006 |
0,003 |
|
1325 |
50-00-0 |
Formaldehyde // Формальдегид |
2 |
0,05 |
0,01 |
0,003 |
|
2902 |
- |
Particulate matter // Взвешенные вещества |
3 |
0,5 |
0,15 |
0,075 |
Table 2
Information about risk index of carcinogenic effects of measured pollutants
Таблица 2
Сведения о показателях опасности развития канцерогенных эффектов
|
Pollutant // Загрязняющее вещество |
CAS number // регистрационный номер CAS |
Classification // Классификация |
|||
|
Code // код |
Name // наименование |
IARC // МАИР |
U.S.EPA |
Sanitary Rules and Regulations // СанПиН |
|
|
1 |
2 |
3 |
4 |
5 |
6 |
|
0123 |
Iron(III)oxide // диЖелезо триоксид |
1309-37-1 |
3 |
– |
– |
|
0133 |
Cadmium(II)oxide // Кадмий оксид |
7440-43-9 |
1 |
В1 |
+ |
|
0143 |
Manganese // Марганец и его соединения |
- |
– |
D |
– |
|
0146 |
Cupric oxide // Медь оксид |
1317-38-0 |
– |
– |
– |
|
0163 |
Nickel // Никель и его соединения |
7440-02-0 |
2B |
A |
+ |
|
0184 |
Lead // Свинец и его неорганические соединения |
7439-92-1 |
2В |
B2 |
+ |
|
0203 |
Chromium // Хром |
18540-29-91 |
1 |
A |
+ |
|
0207 |
Zinc oxide // Цинк оксид |
1314-13-2 |
– |
– |
– |
|
0301 |
Nitrogen dioxide // Азота диоксид |
10102-44-0 |
– |
– |
– |
|
0303 |
Ammonia // Аммиак |
7664-41-7 |
– |
– |
– |
|
0304 |
Nitrogen oxide // Азота (II) оксид |
10102-43-9 |
– |
– |
– |
|
0316 |
Hydrogen chloride // Гидрохлорид |
7647-01-0 |
3 |
– |
– |
|
0330 |
Sulfur dioxide // Сера диоксид |
7446-09-5 |
3 |
– |
– |
|
0333 |
Hydrogen sulfide // Дигидросульфид |
7783-06-4 |
– |
– |
– |
|
0337 |
Carbon monoxide // Углерода оксид |
630-08-0 |
– |
– |
– |
|
0342 |
Hydrogen fluoride // Фтористые газообразные соединения |
7664-39-3 |
– |
– |
– |
|
0602 |
Benzene // Бензол |
71-43-2 |
1 |
A |
+ |
|
0616 |
Xylene // Ксилолы |
1330-20-7 |
3 |
– |
– |
|
0621 |
Toluene // Толуол |
108-88-3 |
3 |
– |
– |
|
0627 |
Benzo[a]pyrene // Бенз(а)пирен |
100-41-4 |
2В |
D |
– |
|
0703 |
Hydroxybenzene // Гидроксибензол (Фенол) |
50-32-8 |
1 |
A |
+ |
|
1071 |
Formaldehyde // Формальдегид |
108-95-2 |
3 |
D |
– |
|
1325 |
Particulate matter // Взвешенные вещества |
50-00-0 |
1 |
B1 |
+ |
|
2902 |
Particulate matter // Твердые частицы |
- |
– |
– |
– |
Thus, measurements of air quality in the monitoring stations are conducted 4 times a day during the week days for 24 pollutants. The greatest share from all volume of measurements goes to highly hazardous and moderately hazardous substances (79.5%). Maximum one-time and daily mean concentrations of pollutants are determined in the air during the measurements. The results of measurements of air quality during the period 2013-2020 are published on the web-site “Nature of Perm”. The results of measurements on monitoring station #14, 20 and 16 have been used during the study.
Results
The results of measurements on monitoring station #14 that is located to the west of the valley of Yegoshikha at the distance of 0.99 km and monitoring station #20 that is located to the east of valley of Yegoshikha at the distance of 1 km have been used to estimate air quality in the valley of Yegoshikha river. The results of measurements on monitoring station #16 that is located to the north-east of valley of Danilikha at the distance of 0.06 km have been used to estimate air quality in the valley of Danilikha river.
There is little quantitative analysis of regular measurements of the concentration of pollutants during the period from 2016 to 2022 in this study.
Maximum one-time and daily mean concentrations have been determined at monitoring stations during the period 2016-2022. The daily mean concentrations have been determined for following substances: iron (III) oxide, cadmium (II) oxide, manganese, cupric oxide, nickel, lead, zinc oxide, chromium.
The number of exceedances of concentrations of pollutants, that has been discovered during the measurements on air quality monitoring stations #14, 16 and 20, according to data about quality of atmospheric air in Perm (2016–2022) is presented in Table 3 / Таблица 3.
Table 3
The number of exceedances of concentrations of pollutants (AQS №14, AQS №16, AQS №20) during the period of 2016–2022
Общее число превышений на постах наблюдений за загрязнением атмосферы
(ПНЗ №14, ПНЗ №20, ПНЗ №16) за 2016–2022
Таблица 3
|
Pollutants // Загрязняющие вещества |
The number of exceedances of maximum one-time concentrations // Общее число превышений максимальных разовых концентраций |
|||||||||||||||||||||||||
|
AQS №14 // ПНЗ №14 |
AQS №16 // ПНЗ №16 |
AQS №20 // ПНЗ №20 |
||||||||||||||||||||||||
|
# |
Code // Код |
Name // Наименование |
s |
s |
s |
s |
s |
s |
Й |
s |
s |
s |
s |
s |
s |
Й |
s |
s |
Й |
|||||||
|
1 |
0123 |
Iron(III)oxide // диЖелезо триоксид |
0 |
0 |
0 |
0 |
0 |
0 |
0 |
0 |
0 |
0 |
0 |
0 |
0 |
0 |
0 |
0 |
0 |
0 |
0 |
0 |
0 |
0 |
0 |
0 |
|
2 |
0133 |
Cadmium(II)oxide // Кадмий оксид |
0 |
0 |
0 |
0 |
0 |
0 |
0 |
0 |
0 |
0 |
0 |
0 |
0 |
0 |
0 |
0 |
0 |
0 |
0 |
0 |
0 |
0 |
0 |
0 |
|
3 |
0143 |
Manganese // Марганец и его соединения |
0 |
0 |
0 |
0 |
0 |
0 |
0 |
0 |
0 |
0 |
0 |
0 |
0 |
0 |
0 |
0 |
0 |
0 |
0 |
0 |
0 |
0 |
0 |
0 |
|
4 |
0146 |
Cupric oxide // Медь оксид |
0 |
0 |
0 |
0 |
0 |
0 |
0 |
0 |
0 |
0 |
0 |
0 |
0 |
0 |
0 |
0 |
0 |
0 |
0 |
0 |
0 |
0 |
0 |
0 |
|
5 |
0163 |
Nickel // Никель и его соединения |
0 |
0 |
0 |
0 |
0 |
0 |
0 |
0 |
0 |
0 |
0 |
0 |
0 |
0 |
0 |
0 |
0 |
0 |
0 |
0 |
0 |
0 |
0 |
0 |
|
6 |
0184 |
Lead // Свинец и его неорганические соединения |
0 |
0 |
0 |
0 |
0 |
0 |
0 |
0 |
0 |
0 |
0 |
0 |
0 |
0 |
0 |
0 |
0 |
0 |
0 |
0 |
0 |
0 |
0 |
0 |
|
7 |
0203 |
Chromium // Хром |
0 |
0 |
0 |
0 |
0 |
0 |
0 |
0 |
0 |
0 |
0 |
0 |
0 |
0 |
0 |
0 |
0 |
0 |
0 |
0 |
0 |
0 |
0 |
0 |
|
8 |
0207 |
Zinc oxide // Цинк оксид |
0 |
0 |
0 |
0 |
0 |
0 |
0 |
0 |
0 |
0 |
0 |
0 |
0 |
0 |
0 |
0 |
0 |
0 |
0 |
0 |
0 |
0 |
0 |
0 |
|
9 |
0301 |
Nitrogen dioxide // Азота диоксид |
0 |
1 |
1 |
0 |
1 |
1 |
0 |
4 |
1 |
0 |
0 |
0 |
1 |
2 |
3 |
7 |
0 |
2 |
0 |
0 |
1 |
0 |
0 |
3 |
|
10 |
0303 |
Ammonia // Аммиак |
0 |
0 |
0 |
0 |
2 |
0 |
0 |
2 |
0 |
0 |
0 |
0 |
0 |
0 |
0 |
0 |
0 |
0 |
0 |
0 |
0 |
0 |
0 |
0 |
|
11 |
0304 |
Nitrogen oxide // Азота (II) оксид |
0 |
0 |
0 |
0 |
0 |
0 |
0 |
0 |
1 |
2 |
0 |
1 |
0 |
0 |
1 |
5 |
0 |
0 |
0 |
0 |
0 |
0 |
0 |
0 |
|
12 |
0316 |
Hydrogen chloride // Гидрохлорид |
0 |
0 |
1 |
7 |
6 |
6 |
6 |
26 |
2 |
0 |
0 |
7 |
10 |
8 |
8 |
35 |
0 |
0 |
0 |
0 |
0 |
0 |
0 |
0 |
|
13 |
0330 |
Sulfur dioxide // Сера диоксид |
0 |
0 |
0 |
0 |
0 |
0 |
0 |
0 |
0 |
0 |
0 |
0 |
0 |
0 |
0 |
0 |
0 |
0 |
0 |
0 |
0 |
0 |
0 |
0 |
|
14 |
0333 |
Hydrogen sulfide // Дигидросульфид |
0 |
0 |
0 |
0 |
0 |
0 |
0 |
0 |
0 |
0 |
1 |
0 |
0 |
0 |
1 |
2 |
0 |
0 |
0 |
0 |
1 |
0 |
3 |
4 |
|
15 |
0337 |
Carbon monoxide // Углерода оксид |
0 |
0 |
0 |
0 |
0 |
0 |
0 |
0 |
0 |
0 |
0 |
0 |
7 |
0 |
0 |
7 |
0 |
0 |
0 |
0 |
0 |
0 |
1 |
1 |
|
16 |
0342 |
Hydrogen fluoride // Фтористые газообразные соединения |
0 |
0 |
0 |
0 |
0 |
0 |
0 |
0 |
0 |
0 |
0 |
0 |
0 |
0 |
0 |
0 |
10 |
11 |
0 |
2 |
2 |
62 |
6 |
9 3 |
|
17 |
0602 |
Benzene // Бензол |
0 |
0 |
0 |
0 |
0 |
0 |
0 |
0 |
0 |
0 |
0 |
0 |
0 |
0 |
0 |
0 |
0 |
0 |
0 |
0 |
0 |
0 |
0 |
0 |
|
18 |
0616 |
Xylene // Ксилолы |
0 |
0 |
0 |
0 |
0 |
0 |
0 |
0 |
2 |
5 |
6 |
2 |
2 |
1 |
0 |
18 |
0 |
1 |
3 |
0 |
0 |
0 |
0 |
4 |
|
19 |
0621 |
Toluene // Толуол |
0 |
0 |
0 |
0 |
0 |
0 |
0 |
0 |
0 |
0 |
0 |
0 |
0 |
0 |
0 |
0 |
0 |
0 |
0 |
0 |
0 |
0 |
0 |
0 |
|
20 |
0627 |
Benzo[a]pyrene // Бенз(а)пирен |
0 |
0 |
0 |
0 |
0 |
0 |
0 |
0 |
10 |
11 |
25 |
4 |
18 |
4 |
1 |
73 |
10 |
11 |
8 |
0 |
1 |
1 |
4 |
3 5 |
|
21 |
0703 |
Hydroxybenzene // Гидроксибензол (Фенол) |
0 |
0 |
0 |
0 |
0 |
0 |
0 |
0 |
0 |
0 |
0 |
0 |
0 |
0 |
0 |
0 |
0 |
0 |
0 |
0 |
0 |
0 |
0 |
0 |
|
22 |
1071 |
Formaldehyde // Формальдегид |
0 |
2 |
3 |
1 |
14 |
0 |
4 |
24 |
0 |
0 |
0 |
0 |
0 |
0 |
0 |
0 |
2 |
8 |
1 |
5 |
3 |
3 |
1 |
2 3 |
|
23 |
1325 |
Particulate matter // Взвешенные вещества |
1 |
2 |
2 |
0 |
2 |
3 |
14 |
24 |
0 |
0 |
1 |
1 |
0 |
0 |
0 |
2 |
3 |
1 |
1 |
0 |
1 |
0 |
0 |
6 |
|
24 |
2902 |
Particulate matter // Твердые частицы |
0 |
0 |
0 |
2 |
7 |
0 |
0 |
9 |
0 |
0 |
0 |
0 |
1 |
1 |
3 |
5 |
0 |
0 |
0 |
0 |
0 |
0 |
0 |
0 |
|
Total/Всего |
1 |
5 |
7 |
10 |
32 |
10 |
24 |
16 |
18 |
33 |
15 |
39 |
16 |
17 |
25 |
34 |
13 |
7 |
9 |
66 |
15 |
|||||
The number of exceedances of concentrations of pollutants, that has been discovered during the measurements on the Station #14, located in L. Shatrova st., 1, increased from one in 2016 to 32 in 2020. The number of exceedances of concentrations of pollutants, that has been discovered during the measurements on the Station #20, located in Krupskoi st., 83, decreased from 34 in 2017 to 9 in 2020 and sharply increased to 66 in 2022. The total number of exceedances, that has been discovered during the measurements on the Station #16, located in Pushkina st., 112, fluctuated during seven-year period. The most significant number of exceedances was observed in 2020, which was 39 cases. The least significant number was 15 and it was observed in 2019.
Exceedances on the station #14 were observed for six pollutants during the seven-year period. There are highly hazardous pollutants: hydrogen chloride, hydroxybenzene, formaldehyde, moderately hazardous pollutants: nitrogen dioxide, particulate matter, and slightly hazardous pollutants: ammonia. The most significant number of exceedances of maximum one-time concentrations was detected for hydrogen chloride (26 cases), hydroxybenzene (24 cases) and formaldehyde (24 cases) during the seven-year period.
The exceedances of the maximum one-time concentrations of hydrogen chloride were identified from 2018 to 2022. The largest number of exceedances was discovered during the period 2019-2022, there were 6 and 7 cases. There was only one exceedance in 2018. The extreme value of concentration was recorded in November of 2022 and it was 8.3 of MPC.
The most significant number of exceedances of concentrations of hydroxybenzene was identified on the station #14, which was 14 cases in 2020. The number of exceedances of concentrations of hydroxybenzene fluctuated from 1 to 4 cases a year during the remaining period of study. The extreme value of concentration was recorded in Januay of 2022 and it was 3.0 of MPC.
The exceedances of the maximum one-time concentrations of formaldehyde were identified from 2018 to 2022. The largest number of exceedances was discovered in 2022, there were 14 cases. The number of exceedances of concentrations of formaldehyde fluctuated from 1 to 3 cases per year during the remaining period of study. The extreme value of concentration was recorded in July of 2022 and it was 1.9 of MPC.
Smaller number of exceedances of particulate matter (7 cases) was observed. There was only one exceedance of nitrogen dioxide and ammonia.
Exceedances of maximum one-time concentration of particulate matter were observed in 2019 and 2020. The largest number of exceedances was identified in 2020. There were 7 cases a year. There were 2 cases in 2019. The extreme value of concentration was recorded in June of 2020 and it was 2.2 of MPC.
Ammonia and nitrogen dioxide once exceeded maximum permissible concentration. The extreme value of concentration of nitrogen dioxide was recorded in May of 2021 and it was 1.7 of MPC, while the extreme value of concentration of ammonia was recorded in August of 2021 and it was 1.3 MPC.
Mean daily concentration of nitrogen dioxide exceeded maximum permissible concentration during all period of study. The largest number of exceedances was identified in 2020. There were 4 cases a year. The number of exceedances of mean daily concentrations of nitrogen dioxide fluctuated from 1 to 3 cases a year during the remaining period of study. The extreme value of concentration was recorded in February of 2018 and it was 1.9 of MPC.
Exceedances of mean daily and one-time maximum permissible concentration of other chemical substances were not observed on the station #14.
Exceedances on the station #20 were observed for eight pollutants during the seven-year period. There are highly hazardous pollutants: hydrogen sulfide, hydrogen fluoride, hydroxybenzene, formaldehyde, moderately hazardous pollutants: nitrogen dioxide, carbon oxide, xylene, ethylbenzene. The most significant number of exceedances of maximum one-time concentrations was detected for hydrogen fluoride (93 cases), ethylbenzene (35 cases), and hydroxybenzene (phenol) (23 cases) during the seven-year period.
The exceedances of one-time concentration of hydrogen fluoride was identified during six out of seven years of study. There were not any exceedances in 2018. The most significant number of exceedances of concentrations of hydrogen fluoride was identified on the station #20, which was 62 cases in 2022. The lowest number of exceedances (2 cases) was identified in 2019 and 2020. The greatest value of concentration was recorded in February of 2017 and it was 1.8 of MPC.
The most significant number of exceedances of concentrations of ethylbenzene was identified on the station #20, which was 10 and 11 cases in 2016 and 2017 respectively. There were 8 cases of exceedances in 2018, but this number decreased to one in 2020. The extreme value of concentration was recorded in July of 2022 and it was 7.8 of MPC.
The most significant number of exceedances of concentrations of hydroxybenzene was observed in 2018, which was 8 cases a year. The number of exceedances fluctuated from 1 to 5 cases per year during the remaining period of study. The extreme value of concentration was recorded in July of 2021 and it was 2.2 of MPC.
The least number of exceedances was detected for formaldehyde (6 cases), xylene (4 cases) and hydrogen sulfide (4 cases). Singular exceedances of maximum one-time concentrations of nitrogen dioxide and carbon oxide were observed during the all period of study on the station #20.
Only one case of exceedance of maximum one-time concentration of formaldehyde was identified during all period of study, but there were 3 cases of exceedances in 2016. The extreme value of concentration was recorded in February of 2016 and it was 1.3 of MPC.
The exceedances of maximum one-time concentration of xylene were observed two times during period of study in 2017 and 2018. There were 3 cases in 2018, the exceedance was observed once in 2017. The extreme value of concentration was recorded in October of 2022 and it was 1.8 of MPC.
The exceedances of maximum one-time concentration of hydrogen sulfide were observed three times during period of study in 2020 and 2021. There were 3 cases in 2021, the exceedance was observed once in 2020. The extreme value of concentration was recorded in January of 2021 and it was 1.3 of MPC.
Carbon oxide and nitrogen dioxide once exceeded maximum permissible concentrations. The extreme value of concentration of nitrogen dioxide was recorded in January of 2017 and it was 1.5 of MPC, while the extreme value of concentration of carbon oxide was recorded in February of 2021 and it was 1.8 of MPC.
Exceedances of mean daily and one-time maximum permissible concentration of other chemical substances were not observed on the station #20.
Exceedances on the station #16 were observed for nine pollutants during the seven-year period. There are highly hazardous pollutants: hydrogen chloride, hydrogen sulfide, formaldehyde, moderately hazardous pollutants: nitrogen dioxide, nitrogen oxide, xylene, ethylbenzene, particulate matter, and slightly hazardous pollutants: carbon monoxide. The most significant number of exceedances of maximum one-time concentrations was detected for ethylbenzene (73 cases) during the seven-year period.
The most significant number of exceedances of concentrations of ethylbenzene was identified on the station #16, which was 25 and 18 cases in 2018 and 2020 respectively. The number of exceedances was 10 and 11 cases in 2016 and 2017. The lowest number was identified in 2022, when there was 1 case a year. The extreme values of concentration were recorded in January of 2019 and it was 7.9 of MPC and in June of 2017 and it was 6 of MPC. The value did not exceed of 3.5 of MPC level during the remaining period of study.
The least number of exceedances of one-time concentration of hydrogen chloride and xylene was identified during the whole period of study, it was 35 cases and 18 cases a year respectively.
The exceedances of maximum one-time concentration of hydrogen chloride were observed in 2016, 2019 – 2022. The most significant number was identified in 2020 and it was 10 cases per year. The exceedances of maximum onetime concentration of hydrogen chloride were observed twice in 2016. The extreme value of concentration was recorded in August of 2016 and it was 3.0 of MPC and in June of 2019 and it was 2.9 of MPC.
The exceedances of maximum one-time concentration of xylene were observed during the whole period of study. There were 5 cases in 2017, the exceedance was observed 6 times in 2018. The extreme value of concentration was recorded in August of 2020 and it was 3.7 of MPC. The maximum permissible concentration was exceeded twice during the remaining period. The extreme value of concentration was recorded in January of 2019 and it was 6.6 of MPC and in May of 2018 and it was 4.3 of MPC.
The least number of exceedances was detected for carbon monoxide (7 cases), nitrogen dioxide (7 cases), nitrogen oxide (5 cases) and particulate matters (5 cases). Singular exceedances of maximum one-time concentrations of hydrogen sulfide and formaldehyde were observed during the whole period of study on the station #16.
The exceedances of maximum one-time concentration of carbon monoxide were observed in 2020. There were 7 cases. The extreme value of concentration was recorded in February of 2020 and it was 2.3 of MPC.
The exceedances of maximum one-time concentration of nitrogen dioxide were observed in 2016, 2020, 2021 and 2022. There were from 1 to 3 cases a year. The extreme value of concentration was recorded in January of 2021 and it was 2.3 of MPC.
The exceedances of maximum one-time concentration of nitrogen oxide were observed in 2016, 2017, 2019 and 2022. There were from 1 to 2 cases a year. The extreme value of concentration was recorded in August of 2017 and it was 1.8 of MPC.
The exceedances of maximum one-time concentration of particulate matters were observed from 2020 to 2022. There were from 1 to 3 cases a year. The extreme value of concentration was recorded in May of 2021 and it was 3.0 of MPC.
The exceedances of maximum one-time concentration of hydrogen sulfide were observed once in 2018 and 2020, the exceedances of formaldehyde were observed in 2018 and 2019. The extreme value of concentration of hydrogen sulfide was recorded in February of 2018 and it was 1.1 of MPC. The extreme value of concentration of formaldehyde was recorded in April of 2019 and it was 1.2 of MPC.
Exceedances of mean daily and maximum one-time concentration of other chemical substances were not observed on the station #16.
The analysis of measurements of maximum one-time concentration of pollutants during 2016-2022 on the station #14, 20 and 16 is presented in Table 4 / Таблица 4.
Table 4
Analysis of results of measurements of maximum one-time concentration of pollutants on air quality stations during the period of study 2016–2022
Таблица 4
Анализ результатов наблюдений на постах наблюдений за загрязнением атмосферного воздуха за максимальными разовыми концентрация загрязняющих веществ 2016-2022
|
№ |
Pollutants // Загрязняющие вещества |
2016 |
2017 |
2018 |
2019 |
2020 |
2021 |
2022 |
||||||||||||||||||||||
|
Code// Код |
Name // Наименование |
i |
b 1 3 |
lb 5 ^ 6,3 Q £ |
s i 11 |
i |
b 3 |
lb 6,3 Q £ |
s i 11 |
i |
ь 3 |
lb 6,5 Q £ |
s i 11 |
i |
3 |
lb 6,5 Q £ |
s i 11 |
i |
ь 3 |
lb 6,5 Q £ |
s i 11 |
i |
ь 3 |
£ |
s i 11 |
ь 3 |
lb 6,5 Q £ |
s i 11 |
||
|
AQS №14 // ПНЗ №14 |
||||||||||||||||||||||||||||||
|
1 |
0301 |
Nitrogen dioxide // Диоксид азота |
– |
– |
– |
– |
1.4 |
1.4 |
11.10 |
1 |
1.2 |
1.2 |
09.02 |
1 |
– |
– |
– |
– |
1.3 |
1.3 |
30.09 |
1 |
1.7 |
1.7 |
25.05 |
1 |
– |
– |
– |
– |
|
2 |
0303 |
Ammonia // Аммиак |
– |
– |
– |
– |
– |
– |
– |
– |
– |
– |
– |
– |
– |
– |
– |
– |
1.2 |
1.2 |
10.03 |
2 |
– |
– |
– |
– |
– |
– |
– |
– |
|
3 |
0316 |
Hydrogen chloride // Хлористый водород |
2.1 |
2.1 |
28.02 |
1 |
1.1 |
2.4 |
26.08 |
7 |
1.1 |
1.5 |
23.09 |
6 |
1.1 |
1.3 |
16.08 |
6 |
1.1 |
8.3 |
15.11 |
6 |
||||||||
|
4 |
1071 |
Hydroxybenzene // Гидроксибензол |
– |
– |
– |
– |
1.1 |
1.1 |
16.03 |
2 |
1.1 |
1.4 |
14.02 |
3 |
1.7 |
1.7 |
24.07 |
1 |
1.1 |
2.9 |
03.06 |
14 |
– |
– |
– |
– |
1.2 |
3 |
10.01 |
4 |
|
5 |
1325 |
Formaldehyde // Формальдегид |
6.8 |
6.8 |
17. 02 |
1 |
1.1 |
1.8 |
31.08 |
2 |
1.1 |
1.1 |
13.10 |
2 |
– |
– |
– |
– |
1.1 |
1.5 |
09.06 |
2 |
1.1 |
1.7 |
20.08 |
3 |
1.1 |
1.9 |
18.07 |
14 |
|
6 |
2902 |
Particulate matter // Твердые частицы |
– |
– |
– |
– |
– |
– |
– |
– |
– |
– |
– |
– |
1.4 |
1.4 |
25.06 |
2 |
1.6 |
2.2 |
29.06 |
7 |
– |
– |
– |
– |
– |
– |
– |
– |
|
Total number of exceedances of MPC // Общее количество превышений ПДК |
1 |
5 |
7 |
10 |
32 |
10 |
24 |
|||||||||||||||||||||||
|
AQS №20 // ПНЗ №20 |
||||||||||||||||||||||||||||||
|
1 |
0301 |
Nitrogen dioxide // Диоксид азота |
– |
– |
– |
– |
1.3 |
1.5 |
09.01 |
2 |
– |
– |
– |
– |
– |
– |
– |
– |
1.2 |
1.2 |
16.11 |
1 |
– |
– |
– |
– |
– |
– |
– |
– |
|
2 |
0333 |
Hydrogen sulfide // Сульфид водорода |
– |
– |
– |
– |
– |
– |
– |
– |
– |
– |
– |
– |
– |
– |
– |
– |
1.1 |
1.1 |
07.03 |
1 |
1.3 |
1.3 |
28.01 |
3 |
– |
– |
– |
– |
|
3 |
0337 |
Carbon oxide // Оксид углерода |
– |
– |
– |
– |
– |
– |
– |
– |
– |
– |
– |
– |
– |
– |
– |
– |
– |
– |
– |
– |
1.8 |
1.8 |
19.02 |
1 |
– |
– |
– |
– |
|
4 |
0342 |
Hydrogen fluoride // Фтористый водород |
1.1 |
1.7 |
04. 07 |
10 |
1.1 |
1.8 |
03.02 |
11 |
– |
– |
– |
– |
1.1 |
1.5 |
01.11 |
2 |
1.1 |
1.2 |
06.08 |
2 |
1.1 |
1.3 |
12.08 |
6 |
1.2 |
7.8 |
13.07 |
62 |
|
5 |
0616 |
Xylene // Ксилол |
– |
– |
– |
– |
1.1 |
1.1 |
18.02 |
1 |
1.8 |
1.8 |
08.05 |
3 |
– |
– |
– |
– |
– |
– |
– |
– |
– |
– |
– |
– |
– |
– |
– |
– |
|
6 |
0627 |
Ethylbenzene // Этилбензол |
1.1 |
2.5 |
26. 05 |
10 |
1.2 |
3 |
24.01 |
11 |
1.1 |
1.8 |
16.05 |
8 |
– |
– |
– |
– |
1.2 |
1.2 |
11.06 |
1 |
1.4 |
2.2 |
16.07 |
4 |
1.4 |
1.4 |
25.03 |
1 |
|
7 |
1071 |
Hydroxybenzene // Гидроксибензол |
1.2 |
1.2 |
24. 03 |
2 |
1.1 |
1.6 |
20.03 |
8 |
1.5 |
1.5 |
13.03 |
1 |
1.1 |
1.4 |
19.09 |
5 |
1.1 |
1.3 |
18.04 |
3 |
1.5 |
1.5 |
06.09 |
1 |
1.1 |
1.8 |
29.10 |
3 |
|
8 |
1325 |
Formaldehyde //Формальдегид |
1.3 |
1.3 |
17. 02 |
3 |
1.1 |
1.1 |
06.09 |
1 |
1.2 |
1.2 |
26.11 |
1 |
– |
– |
– |
– |
1.2 |
1.2 |
30.11 |
1 |
– |
– |
– |
– |
– |
– |
– |
– |
|
Total number of exceedances of MPC // Общее количество превышений ПДК |
25 |
34 |
13 |
7 |
9 |
15 |
66 |
|||||||||||||||||||||||
|
№ |
Pollutants // Загрязняющие вещества |
2016 |
2017 |
2018 |
2019 |
2020 |
2021 |
2022 |
||||||||||||||||||||||
|
Code// Код |
Name // Наименование |
i i |
1 3 |
lb Q £ Q^ |
1 i |
g i |
1 3 |
lb Q £ Q^ |
1 i |
g i |
1 3 |
lb Q £ Q^ |
1 i |
i i |
1 3 |
lb Q £ |
1 s |
i i |
1 3 |
lb Q £ Q^ |
1 s |
g i |
1 3 |
£ 3 |
1 s |
g i |
1 3 |
lb Q £ |
1 s |
|
|
AQS №16 // ПНЗ №16 |
||||||||||||||||||||||||||||||
|
1 |
0301 |
Nitrogen dioxide // Диоксид азота |
1.2 |
1.2 |
12. 02 |
1 |
– |
– |
– |
– |
– |
– |
– |
– |
– |
– |
– |
– |
1.2 |
1.2 |
01.10 |
1 |
2.3 |
2.3 |
15.01 |
2 |
1.3 |
2 |
22.02 |
3 |
|
2 |
0304 |
Nitrogen oxide // Оксид азота |
1.3 |
1.3 |
12. 02 |
1 |
1.3 |
1.8 |
15.08 |
2 |
1.6 |
1.6 |
21.09 |
1 |
– |
– |
– |
– |
– |
– |
– |
– |
1.1 |
1.1 |
17.05 |
1 |
||||
|
3 |
0316 |
Hydrogen chloride // Хлорид водорода |
1.2 |
3 |
30. 08 |
2 |
– |
– |
– |
– |
– |
– |
– |
– |
1.3 |
2.9 |
19.06 |
7 |
1.1 |
1.7 |
27.01 |
10 |
1.1 |
1.7 |
18.08 |
8 |
1.2 |
2.6 |
09.11 |
8 |
|
4 |
0333 |
Hydrogen sulfide // Сульфид водорода |
– |
– |
– |
– |
– |
– |
– |
– |
1.1 |
1.1 |
10.02 |
1 |
– |
– |
– |
– |
– |
– |
– |
– |
– |
– |
– |
– |
1.3 |
1.3 |
09.08 |
1 |
|
5 |
0337 |
Carbon monoxide // Монооксид углерода |
– |
– |
– |
– |
– |
– |
– |
– |
– |
– |
– |
– |
– |
– |
– |
– |
1.1 |
2.3 |
22.02 |
7 |
– |
– |
– |
– |
– |
– |
– |
– |
|
6 |
0616 |
Xylene // Ксилол |
1.4 |
1.6 |
03. 06 |
2 |
1.2 |
2.9 |
06.06 |
5 |
1.2 |
4.3 |
16.05 |
6 |
6.6 |
6.6 |
21.01 |
2 |
3.7 |
3.7 |
03.08 |
2 |
1.4 |
1.4 |
01.09 |
1 |
– |
– |
– |
– |
|
7 |
0627 |
Ethylbenzene // Этилбензол |
1.7 |
2.4 |
19. 02 |
10 |
1.2 |
6 |
06.06 |
11 |
1.3 |
3.5 |
16.05 |
25 |
1.5 |
7.9 |
21.01 |
4 |
1.2 |
3.4 |
20.02 |
18 |
1.4 |
3.4 |
01.09 |
4 |
1.2 |
1.2 |
12.11 |
1 |
|
8 |
1325 |
Formaldehyde // Формальдегид |
– |
– |
– |
– |
– |
– |
– |
– |
1.1 |
1.1 |
20.02 |
1 |
1.2 |
1.2 |
16.04 |
1 |
– |
– |
– |
– |
– |
– |
– |
– |
– |
– |
– |
– |
|
9 |
2902 |
Particulate matter // Твердые частицы |
– |
– |
– |
– |
– |
– |
– |
– |
– |
– |
– |
– |
– |
– |
– |
– |
1.2 |
1.2 |
11.12 |
1 |
3.0 |
3.0 |
17.05 |
1 |
1.1 |
1.6 |
22.06 |
3 |
|
Total number of exceedances of MPC // Общее количество превышений ПДК |
16 |
18 |
33 |
15 |
39 |
17 |
||||||||||||||||||||||||
Примечание: // Note:
* MIN – Minimal concentration from rage of exceedances, MPC // МИН – Минимальная концентрация из общего числа случаев превышения в долях ПДК м.р.
** MAX – Maximal concentration from rage of exceedances, MPC // МАКС – Максимальная концентрация из общего числа случаев превышения в долях ПДК м.р
*** Date of MAX – Data of detecting of maximal concentrations // Дата МАКС – Дата обнаружения максимальных превышений
**** Number – Total number of exceedances of MPC during the year // Число – Общее число случаев превышения ПДК в течение года
Analysis of data of national annual report «About sanitary and epidemiological welfare of the population in Perm region» was held during the study (2016-2022).
The tendency of decline of level of primary disease incidence of child population was observed during the period of study. The number of primary diseases reduced by 20% from 2230.7 per 1000 child population in 2016 to 1782.4 per 1000 child population in 2021. But regional level was greater than national level by 304 per 1000 child population during the all period of study.
The level of primary disease incidence of adult population fluctuated during all period of study. The minimum was recorded in 2021 and was 545 per 1000 adult population. The extreme level was recorded in 2021 and was 687.2 per 1000 adult population respectively. The regional level of primary disease incidence of as child population as adult population was higher than national level by 33 per 1000 adult population.
Diseases of respiratory system were prevailing within primary disease incidence of child and adult population. They had 68% (average for the period 2016-2021) of primary disease incidence of child population and 34% (average for the period 2016-2021) of adult population.
Diseases of eyes (2.8%) and ears (2.5%) went after diseases of respiratory system within primary disease incidence of child population. Diseases of blood circulatory system (5.9%), diseases of eyes (3.6%) and ears (3.3%) had significant shares in primary disease incidence of adult population.
Analysis of levels of primary disease incidence of child and adult population of Perm region is presented in Table 5 / Таблица 5.
Table 5
Analysis of level of primary disease incidence of population of Perm region (per 1000 population) during the period of study 2016–2021
Таблица 5
Анализ уровня заболеваемости населения Пермского края по классам болезней (на 1000 населения) 2016–2021
|
Level of primary disease incidence (per 1000 population) // Уровень первичной заболеваемости (на 1000 населения) |
||||||||||||
|
2016 |
2017 |
2018 |
2019 |
2020 |
2021 |
|||||||
|
tl g 1 |
| |
tl g 1 ci. |
tl g 1 CL. |
g 1 CL. |
tl g 1 CL. |
g 1 CL. |
||||||
|
Child population // Детское население |
||||||||||||
|
Total // Всего |
2230,7 |
1794,4 |
2216,9 |
1758,2 |
2136,9 |
1751,2 |
2051,6 |
1724,4 |
1586,9 |
1485,4 |
1782,4 |
1662,9 |
|
Neoplasm // Новообразования |
4,4 |
4,8 |
4,4 |
4,8 |
4,8 |
4,7 |
4,7 |
4,9 |
3,9 |
4,1 |
4,3 |
4,6 |
|
Diseases of the blood and hematopoietic organs // Болезни крови и кроветворных органов |
28,8 |
13,8 |
29,3 |
12,4 |
27,1 |
11,9 |
21,7 |
11 |
12,3 |
9,0 |
12,1 |
9,4 |
|
Diseases of the endocrine system // Болезни эндокринной системы |
24,9 |
15,7 |
23,8 |
15,1 |
23,2 |
15,3 |
22,6 |
16 |
13,9 |
13,3 |
14,5 |
14,3 |
|
Diseases of the nervous system // Болезни нервной системы |
37,2 |
37,3 |
36,4 |
35,5 |
33,5 |
35,1 |
32,5 |
34,2 |
32,9 |
28,7 |
34,8 |
30,5 |
|
Diseases of eyes // Болезни глаза |
71,5 |
59,7 |
67,5 |
57,3 |
68,4 |
57,1 |
63,2 |
53 |
36,7 |
39,0 |
39,3 |
41,5 |
|
Diseases of ears // Болезни уха |
68,5 |
49,6 |
61,9 |
47,6 |
54,5 |
46,9 |
50,9 |
45,4 |
34,7 |
35,4 |
38,2 |
38,6 |
|
Diseases of the blood circulatory system // Болезни системы кровообращения |
8,3 |
7 |
8,3 |
6,8 |
7,5 |
6,5 |
6,6 |
6,3 |
5,0 |
5,0 |
5,4 |
5,3 |
|
Diseases of the respiratory system // Болезни органов дыхания |
1451,3 |
1187 |
1499,7 |
1174,5 |
1439,2 |
1173,8 |
1398,2 |
1159,9 |
1102,5 |
1018,6 |
1251,0 |
1145,0 |
|
Congenital defects // Врожденные аномалии |
26,5 |
11 |
26,2 |
4,3 |
28,2 |
10,4 |
28,4 |
10,5 |
11,5 |
8,8 |
12,0 |
9,1 |
|
Adult population // Взрослое население |
||||||||||||
|
Total // Всего |
619,9 |
551,6 |
591,6 |
545 |
608,4 |
546,6 |
617,2 |
548,3 |
624,1 |
578,5 |
687,3 |
654,7 |
|
Neoplasm // Новообразования |
16,7 |
13 |
16,2 |
13,1 |
16,4 |
13,4 |
17,8 |
13,7 |
12,0 |
11,3 |
12,8 |
11,6 |
|
Diseases of the blood and hematopoietic organs // Болезни крови и кроветворных органов |
2,8 |
2,6 |
2,5 |
2,6 |
1,9 |
2,4 |
2 |
2,5 |
1,6 |
1,8 |
1,6 |
2,0 |
|
Diseases of the endocrine system // Болезни эндокринной системы |
11,9 |
13 |
10,9 |
13,2 |
10,4 |
12,1 |
10,9 |
13,5 |
9,3 |
10,0 |
10,0 |
10,1 |
|
Diseases of the nervous system // Болезни нервной системы |
7,8 |
9,7 |
8 |
9,7 |
8,2 |
9,4 |
8,1 |
9,6 |
7,4 |
8,2 |
7,5 |
8,9 |
|
Diseases of eyes // Болезни глаза |
26,7 |
25,9 |
23,4 |
24,4 |
22,8 |
24,6 |
23 |
23,7 |
18,7 |
19,6 |
18,8 |
19,9 |
|
Diseases of ears // Болезни уха |
21,5 |
21,1 |
21,2 |
22,2 |
21,1 |
20,4 |
22,9 |
20,1 |
18,5 |
16,8 |
18,7 |
17,0 |
|
Diseases of the blood circulatory system // Болезни системы кровообращения |
36,6 |
37,5 |
32,3 |
44,9 |
35 |
38,9 |
38 |
42,1 |
40,2 |
35,4 |
39,9 |
36,7 |
|
Diseases of the respiratory system // Болезни органов дыхания |
179 |
162,9 |
190,7 |
172,1 |
208 |
167,5 |
207,1 |
164,7 |
253,1 |
213,7 |
254,8 |
228,3 |
Discussion
The tendency of increase of cases of exceedances of concentration of chemical substances in atmospheric air was discovered during this study. The number of cases of exceedances fluctuated between 32 and 39 cases per year last three years.
The exceedances of six chemical substances were observed on the station #14, exceedances of eight chemical substances were observed on the station #20 during the period of the study. The highest number of chemical substances which were exceeded was 9 and was observed on the station #16.
Formaldehyde and nitrogen dioxide are in the list of chemical substances which were exceeded on all stations.
There were recorded exceedances of maximum onetime concentrations of formaldehyde on the station #14 every year. Exceedances of formaldehyde were observed on the station #16 in 2018 and 2019. Exceedances of formaldehyde were observed on the station #20 in four years out of seven (2016, 2017, 2018 and 2020). The extreme value of concentration of formaldehyde was recorded in February of 2016 on the station #14. The extreme value on the other station didn’t exceed 1.3 of MPC.
There were recorded exceedances of mean daily concentrations of formaldehyde on the station #14 every year. The most significant number of exceedances of concentrations of formaldehyde was identified in 2017 and 2020 which was 6 cases per year. The extreme value of concentration of formaldehyde was recorded in July of 2020 and was 2.0 of MPC.
There were recorded exceedances of maximum onetime concentrations of nitrogen dioxide on all stations in four years during the all period of study. Exceedances of nitrogen dioxide were observed on the station #16 in 2016 and 2020-2022, on the station #14 in 2017–2018, 2020– 2021. Exceedances of nitrogen dioxide were observed on the station #20 in two times in 2017 and 2020. The extreme value of concentration of nitrogen dioxide was recorded in May of 2021 on the station #14. The extreme value on the other station didn’t exceed 1.5 of MPC.
The exceedances of mean daily concentrations of nitrogen dioxide were identified on the station #14 every year. The most significant number of exceedances of concentrations was identified in 2020 which was 4 cases per year. The number of exceedances fluctuated from 1 to 3 in other years during the study. The extreme value of concentration of nitrogen dioxide was recorded in February of 2018 and was 1.9 of MPC.
Exceedances of formaldehyde and nitrogen dioxide indicate significant rate of emission of fossil fuels burning, including burning in internal combustion engine of cars [5]. Monitoring station is located close to main traffic routes.
This result was confirmed by results of measurements which were conducted in Dzershinsky area of Perm city according to a contract with local government (2009; 2020). The same results were reached in cities of the USA and Europe during the studies which are holding in the University of West Virginia, in laboratory of applied thermodynamics of Aristotle University of Thessaloniki and in the Joint Research Centre of European Commission [10, 19].
Presence of exceedances of mean daily concentration of formaldehyde is approved by earlier studies. Mean daily concentration of formaldehyde exceeds permissible concentration in the cities. The tendency of increasing of concentration was found over the last years. Value of mean daily concentration of formaldehyde changed slightly from 1992 to 2006, but it has always exceeded permissible concentration. Value of formaldehyde has been increased since 2006 and it changed from 0.006 to 0.014 mg/m3 (MPC = 0.01, it changed in 2014 from 0.003).
The maximum values of concentration of formaldehyde are identified in warm part of the year (May-August) in Perm as well as it is in the majority of cities. The most significant values of concentration are between 0.009 and 0.018 mg/m3 in summer time. The winter maximum is formed by December [25].
Clearly defined summer maximum of value of concentration of formaldehyde is explained by transformation air under the influence of high summer temperatures and significant solar intensity [3]. The concentration of formaldehyde in the air, which is formed from emission of hydrocarbons, increases under the intensification of photochemical processes. The winter maximum is connected with emission of industry and transport [5].
According to researches nitrogen dioxide is the next high-priority chemical substance in the cities. This substance is emitted by all factories and transport in the cities [7]. Nitrogen dioxide is formed during the photochemical reactions. Nitrogen dioxide takes part in process of generation of formaldehyde and photochemical smog. The average concentration of nitrogen dioxide has changed between 0.04 and 0.05 mg/m3. The most significant values of concentration of NO 2 are observed in the winter part of the year [3].
The prevailing shares of diseases of respiratory system within primary disease incidence of child and adult population also confirm annual exceedances of mean daily concentrations of formaldehyde and nitrogen dioxide. According to “Human Health Risk Assessment from Environmental Chemicals” nitrogen dioxide has a negative effect on respiratory system and blood system during inhalation. Formaldehyde is also dangerous to respiratory system and can affect the eyes and immune system.
The most significant and the most frequent exceedances of concentration were identified for the next chemical substances: ethylbenzene (108 cases of exceedances), hydrogen fluoride (93 cases), hydrochloride (61 cases of exceedances) and hydroxybenzene (47 cases of exceedances).
The exceedances of maximum one-time concentration of ethylbenzene were identified in two stations #20 and #16. The most significant number of exceedances of concentrations of ethylbenzene was identified on the station #16, which was 25 and 18 cases in 2018 and 2020 respectively. There were 11 cases of exceedances in 2017, but this number decreased to one in 2022. The extreme value of concentration was recorded in January of 2019 and it was 7.9 of MPC.
The significant number of exceedances of concentrations of ethylbenzene was identified on the station #20, which was 11 and 10 cases in 2017 and 2016 respectively. The extreme values of concentration were recorded in January of 2017 and it was 3.0 of MPC.
Ethylbenzene is the part of emission of petrol station and of burning fossil fuels in internal combustion engines of transport. Exceedances of concentration of ethylbenzene is explained by high level of transport emission.
The most significant number of exceedances of concentrations of hydrogen fluoride was identified on the station #20 and was 62 cases in 2022. The number of exceedances of concentrations of hydrogen fluoride fluctuated from 2 to 10 cases a year during the remaining period of study. The extreme value of concentration was recorded in July of 2022 and it was 7.8 of MPC.
Exceedances of concentration of hydroxybenzene demonstrate negative effect of machine-building industry.
The most significant number of exceedances of concentrations of hydroxybenzene was identified on the station #14, which was 24 cases in 2020. The number of exceedances of concentrations of hydroxybenzene fluctuated from 1 to 4 cases a year during the remaining period of study. The extreme value of concentration was recorded in January of 2022 and it was 3.0 of MPC.
The most significant number of exceedances of concentrations of hydroxybenzene on the station #20 was observed in 2017, which was 8 cases a year. The number of exceedances fluctuated from 1 to 5 cases per year during the remaining period of study. The extreme value of concentration was recorded in October of 2022 and it was 1.8 of MPC.
Exceedances of concentration of hydroxybenzene demonstrate negative effect of machine-building industry.
Exceedances of maximum one-time concentration of hydrogen chloride was identified on the station #14 and #16. The exceedances of the maximum one-time concentrations of hydrogen chloride on the station #14 were identified from 2018 to 2022. The largest number of exceedances was discovered in 2019, there were 7 cases. The extreme value of concentration was recorded in August of 2019 and it was 2.4 of MPC.
The exceedances of maximum one-time concentration of hydrogen chloride on the station #16 were observed in 2016 and from 2019 to 2022. The most significant number was identified in 2020 and it was 10 cases. The extreme value of concentration was recorded in August of 2016 and it was 3.0 of MPC.
These chemical substances have a negative impact on respiratory system during chronical inhalation.
Therefore, through an analysis we can conclude that the most significant source of air pollution in the valleys of minor rivers Yegoshikha and Danilikha is automobile and railway transports. The north, middle and south dams and Chkalova motorway, Shosse Kosmonavtov and Vasilia Vasilieva motorway and central railway are the busiest ways in Perm.
The Chkalova motoway is one of the few enters of the Perm city and is close to huge manufacturing plants. Percent of lorry traffic and coach transport is higher on this motorway than the others. The Vasilia Vasilieva motorway lies along warehouses, manufacturing plants, maintenance automobile entities. As a consequence lorry traffic is prevailing in total traffic flow.
The industrial plants and factories are also the most significant sources of air pollution. The majority of industrial area ‘Yuzni’ plants and factories are located along the valleys of Yegoshikha river and Danilikha river and are members of machine-building industry. The bigger part of these plants and factories are object of second and third categories of negative impact on the environment. These objects have moderate and insignificant impact on the environment.
In the list of the pollutants in Perm we can highlight the next chemical substances:
-
• pollutants, which are emitted from burning fossil fuels: nitrogen dioxide, nitrogen oxide, sulfur dioxide, carbon monoxide, benzopyrene;
-
• pollutants, which are specific to machine-building industry: hydroxybenzene, Iron(III)oxide, titanium dioxide, magnesium oxide, aluminum oxide, cupric oxide, dust of yellow metal, chromium, lead;
-
• pollutants, which are specific to construction materials industry: dust of gypsum binder, inorganic dust, pearlite, calcium hydroxide, particulate matters.
Group of different hydrocarbons (kerosene, petroleumbased mineral oil, oil solvent, xylene, ethylbenzene, alkanes) is also present in the list of pollutants of Perm. Ethanol, acetone, butyl acetate, butyl alcohol are found in air.
Garage cooperatives, warehouses, maintenance automobile entities, petrol station are sources of air pollution by nitrogen oxides, sulfur dioxide, carbon monoxide and aromatic hydrocarbons in the valley of Yegoshikha river and Danilikha river.
It is certain that present national net of measurements of air pollution is unrepresentative. Additional monitoring stations need to be settled.
Additional monitoring stations in national net of measurements of Rosgidromet need to be settled to control air quality in valley of Yegoshikha river (Fig. 2). This place will be:
-
• near the tram bridge on Parkovaya street on the territory of gardeners' non-commercial partnership #63 (Additional AQS #1);
-
• on 150-200 m to south from bridge (middle dam) on Revolucii street, near the building 1 on Veselaya street (Additional AQS #2);
-
• on the border of the territory of gardeners' non-com-mercial partnership “Energetic” (Additional AQS #3).
The list of priority measuring chemical substances includes hydroxybenzene, formaldehyde, ethylbenzene, nitrogen dioxide. The exceedances of MPC of these substances were observed. These substances are the most dangerous for human health. Measuring of concentration of particulate matter (PM 10 and PM 2.5 ) is needed too. These substances are harmful for human health and it is particulate matters (dust) different nature.
Locations of the picked additional stations are due to the fact that ground relief can influence on accumulation of chemical substances under specific meteorological conditions. Level variations near the area “Alpiiskaya gorka” and valley of the Yegoshikha are 50-60 m with slow decreasing to planed picked additional station. Level variation on eastern slope of valley is significant and it is to a maximum 60 m.
Pollutants that are emitted from factories and plants of area “Yuzhni” move along the valley to north with southern, south-western and western winds. It is due to changes of wind direction long the valley in relation direction under the valley.
The measuring of air quality in station #2 is due to impact of group of factories and plants in the area “Yuzni” with prevailing wind direction during the year and impact of transport that is moved on the southern dam with southern wind direction and on Revolucii street with northern one.
Additional monitoring stations in national net of measurements of Rosgidromet need to be settled to control air quality in valley of Danilikha river (Fig. 2 / Рис. 2). This place will be:
-
• near Chkalova motorway, at 90 m from apartment building on Cheluskincev st., 21 (Additional AQS #4);
-
• on the territory of cooperative gardens #142/7 at 75 m from apartment building on Tbilisskaya st., 19 (Additional AQS #5);
-
• near educational orphanage #85 on Muromskaya st., 32 (Additional AQS #6).
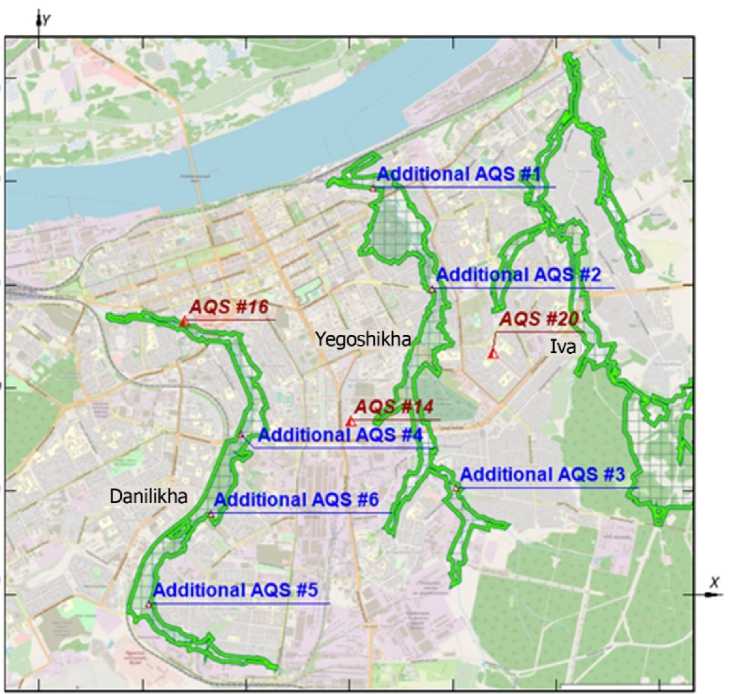
Fig. 2. Location of additional monitoring station
Рис. 2. Расположение дополнительной станции мониторинга
The list of priority measuring chemical substances includes ethylbenzene, hydrochloride and xylene. The exceedances of MPC of these substances were observed many times during the period of study and it reached 6 MPC. Measuring of concentration of particulate matter (PM10 and PM2.5) is needed too.
The prevailing wind direction in the valley of Danilikha is from south-west to north-east of from north-east to south-west. The pollutant transport from factories and plants of area “Yuzni” that is located further east, influences on level of air pollution in picked stations with southwesterly and north-easterly winds.
Emission of boilers and other sources of air pollution, which are located further west, influences of air quality in the valley of the Danilikha river with from north-westerly to south-westerly wind. As usual, air pollution with outlined wind directions will increase with low speed of wind and with raised inversion.
These air conditions are observed in winter part of the year or in summer part with anticyclonic weather pattern. But inversion is damaged and speed of wind increases in summer time at noon. In this case higher level of air pollution will be observed only in the night. The higher level of air pollution can be observed all over the day in the winter.
Conclusion
-
1. Monitoring of air pollution in Perm is hold 4 times per day, 5 days per week on the stations that are included in the national net of measurements. There are measurements for 24 pollutants. The majority of measurements represents by measurements of highly hazardous and moderately hazardous pollutants (79.49%). Values of maximum one-time and mean daily concentrations of pollutants are measured.
-
2. The national net of measurements consists of 7 monitoring sites, which are located in six different areas of Perm close to main traffic routes and industrial hubs. This net is not representative.
-
3. The measured concentrations of formaldehyde and nitrogen dioxide exceed MPC all over the stations. The most significant and frequent exceedances of maximum one-time MPC was observed for ethylbenzene, hydroxybenzene and hydrochloride.
-
4. Exceedances of concentrations of formaldehyde, nitrogen dioxide and ethylbenzene report about significant percent of emission from burning of fossil fuel in cars and thermal power station. Exceedances of concentrations of hydroxybenzene report about negative impact of machinebuilding factories and plants.
-
5. Setting of additional stations of monitoring of air pollution and creating of dynamic model of emission of pollutants are needed for objective evaluation of air quality.
References Estimate of air quality in valleys of Yegoshikha river and Danilikha river
- About activity of Rosgidromet in 2019 and agenda of 2020 (Final report). Moscow. Ministry of natural resources and ecology of Russian Federation. 2020. Available from: https://www.meteorf.ru/about/coordination/377/fi-nal/#DATE_FROM=01.01.2019&DATE_TO=31.12.2019&PAGEN_1=1&ID=377 [Accessed 25th March 2021]
- About quality and protection of environment in Russian Federation in 2019 (National report). Moscow. Ministry of natural resources and ecology of Russian Fed-eration. 2020. Available from: https://2019.ecology-gosdoklad.ru/ [Accessed 25th March 2021]
- Bezyglaya, E. and Smirnova, I., 2006. Vozduh go-rodov i ego izmeneniya [Atmospheric air of cities and its changes]. Saint Petersburg, Asterion publ. 235 p. (in Rus-sian)
- Borodkina, T. and Varguzina, M., 2014. The main sources of air pollution in Voronezhskaya oblast. Territory of science. Vol. 1. рр. 110–118. Available from: https://www.elibrary.ru/contents.asp?id=34053340 [Ac-cessed 25th March 2021] (in Russian).
- Davydova, I. and Gaponenko, A., The problem of air pollution in the cities. Sciences of Europe. 2017. Vol-ume 14-2 (14). рр. 3–5. Available from: https://www.eli-brary.ru/contents.asp?id=34480539 [Accessed 25th March 2021] (in Russian).
- Di Bernardino, A., Iannarelli, A., Casadio, S., Per-rino, C., Barnaba, F., Tofful, L., Campanelli, M., Di Liberto, L., Mevi, G., Siani, A.M. and Cacciani, M., 2021 Impact of synoptic meteorological conditions on air quality in three different case studies in Rome, Italy. Atmospheric Pollution Research. 12. рр. 76–88. https://doi.org/10.1016/j.apr.2021.02.019.
- Dons, E., Laeremans, M., Anaya-Boig, E., Avila-Palencia, I., Brand, Ch., de Nazelle, A., Gaupp-Berhausen, M., Gotschi, T., Nieuwenhuijsen, M., Orjuela, J.P., Raser, E., Standaert, A., and Panis, L., 2018. Concern over health effects of air pollution is associated to NO2 in seven Euro-pean cities. Air Quality, Atmosphere and Health. (11). рр. 591–599. https://doi.org/10.1007/s11869-018-0567-3.
- Egorova, O., Gogol, E., Shipilova, R. and Tuna-kova, U., 2013. Impact of mobile sources of air pollution. Vestnik of Kazan National Research Technological Uni-versity. 16(19). рр. 71–74. (in Russian).
- Guideline “Manual of Air pollution monitoring”. RD 52.04.186-89. Moscow. Gidrometeoizdat. 1991. Electronic database of legal documents and standards “Kodeks” Avail-able from: https://docs.cntd.ru/document/1200036406 [Ac-cessed 25th March 2021] (in Russian).
- Grigoratos, T., Fontaras, G., Giechaskiel, B. and Zacharif, N., 2019. Real world emissions performance of heavy-duty Euro VI diesel vehicles. Atmosphere Environ-ment. 201. рр. 348–359. https://doi.org/10.1016/j.at-mosenv.2018.12.042
- Human Health Risk Assessment from Environ-mental Chemicals. Electronic database of legal docu-ments and standards “Kodeks”. Available from: https://docs.cntd.ru/document/1200037399 [Accessed 25th March 2021] (in Russian)
- IARC Monographs on the Identification of Car-cinogenic Hazards to Humans. International Agency for Research of Cancer. Available from: https://mono-graphs.iarc.who.int/agents-classified-by-the-iarc/ [Acces-sed 25th March 2021]
- Interstate standard. GOST 17.2.3.01-86 Nature protection. Atmosphere. Air quality control regulations for populated areas. Moscow: Standardinform. 2005. Electronic database of legal documents and standards “Kodeks”. Available from: https://docs.cntd.ru/docu-ment/1200012789 [Accessed 25th March 2021] (in Rus-sian)
- Kuzmina, R., Kozhakhina, A., Ivanova, U. and Livenczev, V., 2007. Ohrana okruzhayushchej sredy v neftepererabotke [Protection of environment during oil re-fining]. Saratov: Publishing house of Saratov University. 128 p. (in Russian).
- National annual reports «About sanitary and epi-demiological welfare of the population in Perm region in 2016-2022» Available from: http://59.rospotrebnad-zor.ru/319 [Accessed 30th March 2021] (in Russian).
- Potylitsyna, E., Taseiko, O. and Sugak, E., 2015. Assessment of influence of air pollution produced by engi-neering enterprises on human health. Vestnik SibGAU. 16(4). рр. 958-968. (in Russian).
- Quality of atmospheric air and human health: re-port of World Health Organization Available from: https://www.who.int/airpollution/ru/ (Accessed 25th March 2021).
- Quality of atmospheric air in Perm. Environment of Perm. Available from: http://www.priroda-perm.ru/barometr/2015/04/02/2241 [Accessed 25th March 2021]
- Quiros, C., Smith, J., Thiruvengadam, A., Huai, T. and Hu, S. 2017. Greenhouse gas emissions from heavy-duty natural gas, hybrid, and conventional diesel on-road trucks during freight transport. Atmospheric Air. 168. рр. 36–45. https://doi.org/10.1016/j.atmosenv.2017.08.066
- Kulakova, S., Mishlanova, Yu. Gatina, E., Harin, R. and Kolodkin, M. 2009. Mikroklimaticheskoe obsledo-vanie doliny r. Daniliha [Research of microclimate valley of Danilikha river]. Perm. 12 p.
- Results of measurements that were hold in Dzer-shinsky area of Perm city according to a contract with local government. 2020.
- Risk Assessment for Carcinogenic Effects. United States Environmental Protection Agency. Available from: https://www.epa.gov/fera/risk-assessment-carcinogenic-effects [Accessed 25th March 2021]
- Sanitary rules and regulations SanPiN 1.2.3685-21 Hygienic standards and rules of safety and (or) harm-lessness for human health of habitat factors. Authorized state law database. Available from: www.pravo.gov.ru [Accessed 25th March 2021]
- Schklyaev, V., Ermakova, L. and Shklyaeva, L., 2010. Research of microclimate of city for estimation of biometeorological factors of habitat territories. Geograph-ical bulletin. 3(14). рр. 52–59. (in Russian).
- Schklyaev, V. and Shklyaeva, S., 2008. Estima-tion of quality of national net of monitoring of air pollution in Perm and its growth potential. Geographical bulletin. 2(8). рр. 196–205. (in Russian).
- Shcherbatyuk, A., 2018. Optimization strategy of ecological safety management of the air environment of cities in conditions of intracontinental intermountane hol-lows. Ecology of urbanizing territories. 1. рр. 29–34. https://doi.org/10.24411/1816-1863-2018-11029 (in Rus-sian).
- Steeneveld, G-J., Klompmaker, J., Groen, R. and Holtslag, A., 2018. An urban climate assessment and man-agement tool for combined heat and air quality judgements at neighbourhood scales. Resources, Conversation and Re-cycling. 132. рр. 204–217. https://doi.org/10.1016/j.rescon-rec.2016.12.002
