Estimating suspended sediment concentrations in surface water of Tri An lake (Vietnam) using landsat multispectral images
 using landsat multispectral images")
Author: Hung Trinh Le, Tuyen Vu Danh
Journal: Вестник аграрной науки @vestnikogau
Article in issue: 3 (48), 2014.
Free access
Monitoring of suspended sediment is important to maintain water quality and geomorphologic balance. Traditional methods based on field surveys only solve the problem on a small scale. Along with the development of remote sensing technology, satellite images are widely used in the study, analysis of suspended sediment. This article presents a method based on spectral mixture analysis to estimate the suspended sediment concentrations (SSC) in surface water of the Tri An lake from LANDSAT multispectral images. The results which are obtained in this study can be used to create the map of suspended sediment distribution and to evaluate water quality.
Remote sensing, water pollution, suspended sediment, reflectance, landsat, multispectral images
Short address: https://sciup.org/147124552
IDR: 147124552 | UDC: 528.854.2,
Text of the scientific article Estimating suspended sediment concentrations in surface water of Tri An lake (Vietnam) using landsat multispectral images
Vietnam is located downstream of some major rivers, so Vietnam has a vast river network. Although the quality of upstream river water is generally good, the downstream sections of major rivers reveal poor water quality, and most of the lakes and canals in urban areas become sewage sinks. The weakness in industrial wastewater management is the main cause of water pollution in Vietnam. Many industrial enterprises use freshwater to carry waste from their factories into canals, rivers, and lakes. Most of the enterprises do not have any wastewater treatment system and many industrial zones do not have a wastewater treatment centre for their factories. Industrial wastewater is directly discharged into canals, lakes, ponds, and rivers, causing serious pollution of surface water [10].
Concentration of suspended sediment is one of the major parameters for monitoring water turbidity. Furthermore, suspended sediment has a substantial influence on temperature, stratification, biology and carries chemical substances and pathogenic agents. The traditional methods for measuring water quality variables are time-consuming and do not give a synoptic view of a water body or, more significantly, a synoptic view of different water bodies across the landscape. It requires excessive traveling, sampling, and expensive laboratory analysis, especially for a large area; thus it is very difficult to report and predict the water pollution situation in time. Remote sensing technology with advantages such as wide area coverage and short revisit interval have been effectively used for environmental pollution applications, such as for monitoring water quality [7].
MATERIAL AND METHODS
LANDSAT imagery. To estimate SSC we used LANDSAT ETM+ multispectral image on 12 February 2010 in Tri An lake (Vietnam) (figure 1).
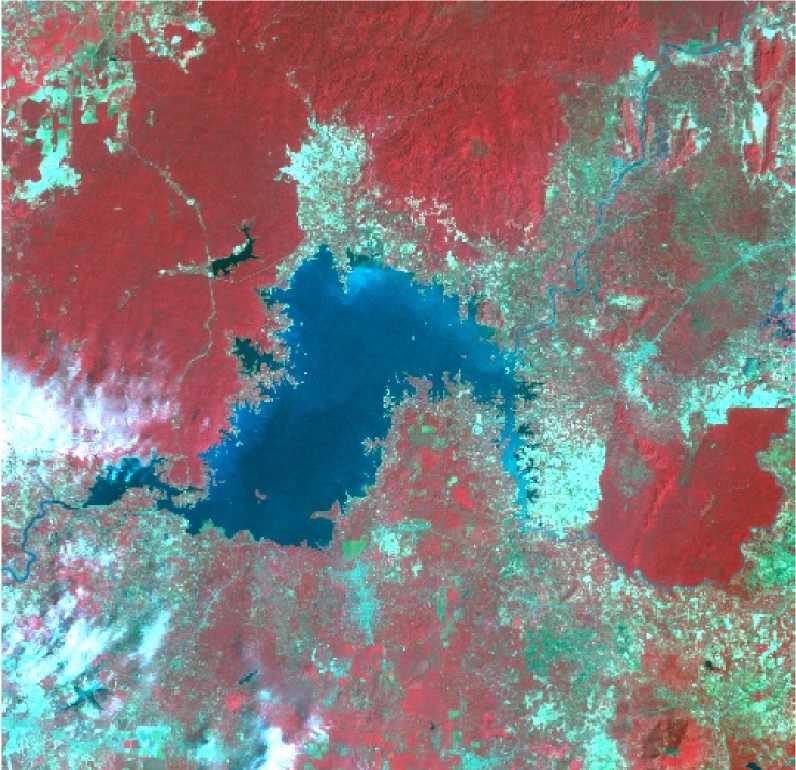
Figure 1 - The LANDSAT multispectral image (Tri An lake, 12-02-2010) with color composite RGB=432
The Enhanced Thematic Mapper ( ETM+) on board LANDSAT-7 is a multi-spectral radiometric sensor that records eight bands of data with varying spectral and spatial resolutions (30m spatial resolution for red, green, blue, near infrared, and two bands of medium infrared; 60m for thermal infrared; and a 15m panchromatic band). With average spatial resolution, multispectral image LANDSAT ETM+ performance applications in the region study (table 1).
Table 1 - Characteristic of LANDSAT ETM+ multispectral image
|
No. |
Bands |
Wavelength (µm) |
Spatial resolution (m) |
|
1 |
Blue |
0.459 – 0.515 |
30 |
|
2 |
Green |
0.525 – 0.605 |
30 |
|
3 |
Red |
0.630 – 0.690 |
30 |
|
4 |
Near infrared (NIR) |
0.775 – 0.900 |
30 |
|
5 |
Mid-infrared (MIR) |
1.550 – 1.750 |
30 |
|
6 |
Thermal infrared (TIR) |
10.40 – 12.50 |
60 |
|
7 |
Mid-infrared (MIR) |
2.090 – 2.350 |
30 |
|
8 |
Panchromatic |
0.520 – 0.900 |
15 |
In situ measurements. All in situ data were collected during research cruises in February 2010 in a set of stations distributed along the Tri An lake [8]. Table 2 shows the coordinates of all water sampling stations and SSC (mg/l).
Table 2 - In situ measurements of SSC (mg/l) in February 2010
|
No. |
Water sampling stations |
Coordinates |
TSS (mg/l) |
|
|
X |
Y |
|||
|
1 |
Hieu Liem – Vinh Cuu |
0416720 |
1228426 |
2 |
|
2 |
Vinh An |
0419014 |
1230046 |
2 |
|
3 |
Chien khu D bridge |
0422343 |
1229191 |
3 |
|
4 |
Ma Da – Vinh Cuu |
0432420 |
1232295 |
2 |
|
5 |
Phu Cuong – Dinh Quan |
0447830 |
1239000 |
3 |
|
6 |
The Lake of Phu Cuong – Dinh Quan |
0447491 |
1232700 |
2 |
|
7 |
La Nga – Dinh Quan |
0444048 |
1239451 |
6 |
|
8 |
Thanh Son – Dinh Quan |
0427157 |
1230796 |
13 |
|
9 |
Village 3, La Nga – Dinh Quan |
0436964 |
1240483 |
13 |
|
10 |
La Nga bridge, 1km upstream |
0445939 |
1235825 |
23 |
Methodology. For atmospheric correction, we use the dark object (DOS). This model works as follows step:
In the first step, the digital number is converted to spectral radiance using the sensor calibration parameters by the following equation [9]:
L max - L min
L = ( DN - DN min) + L min (1),
λ DN max- DN min where Lλ – spectral radiance at the sensor’s aperture in watts/m2.ster.µm; DNmax and DNmin – the maximum and minimum quantized calibrated pixel value in digital number (DNmax = 255, DNmin = 1); DN = the quantized calibrated pixel value in digital number; The Lmax and Lmin are the spectral radiances for each band of LANDSAT image at digital numbers 1 and 255 respectively in watts/m2.ster.µm (table 3).
Table 3 - The values of Lmax and Lmin of LANDSAT multispectral image
|
Band |
Name |
Wavelength |
Lmax |
Lmin |
|
1 |
Blue |
0.45 – 0.515 µm |
191.600 |
-6.200 |
|
2 |
Green |
0.525 – 0.605 µm |
196.500 |
-6.400 |
|
3 |
Red |
0.63 – 0.69 µm |
152.900 |
-5.000 |
|
4 |
NIR |
0.75 – 0.90 µm |
241.100 |
-5.100 |
|
5 |
MIR |
1.55 – 1.75 µm |
31.060 |
-1.000 |
|
7 |
MIR |
2.09 – 2.35 µm |
10.800 |
-0.350 |
In the second step, the theoretical radiance of a “dark object” is computed with the theoretical reflectance of 1% as proposed by Chavez (1996) and Moran et al. (1992) [1, 4]:
L 0.01. cos( θ s ). d 2
(2),
λ 1% = π . ESUN .
λ where: ESUN – the mean exoatmospheric solar spectral irradiance (watt/ m2.ster.µm) and show in table 4; θs – the solar zenith angle in degrees; d – Earth – Sun distance in astronomical units, which can be computed using the following formula: d = (1.0 -0.013729.cos(D-4)), where D – the day number of the year.
Table 4 - LANDSAT ETM+ solar spectral irradiances (ESUN)
|
Band |
Name |
Wavelength |
ESUN (watts/m2.ster. µm) |
|
1 |
Blue |
0.45 – 0.515 µm |
1997 |
|
2 |
Green |
0.525 – 0.605 µm |
1812 |
|
3 |
Red |
0.63 – 0.69 µm |
1533 |
|
4 |
NIR |
0.75 – 0.90 µm |
1039 |
|
5 |
MIR |
1.55 – 1.75 µm |
230.8 |
|
7 |
MIR |
2.09 – 2.35 µm |
84.90 |
|
8 |
PAN |
0.52 – 0.90 µm |
1362 |
Step 3 computes a value for the haze that may be present in the image:
L Xha ze = L X L X 1% (3).
reflectance values. Surface
The last step converts spectral radiance to surface reflectance can be calculated using following equation:
= П . d 2.( L x - L X haze )
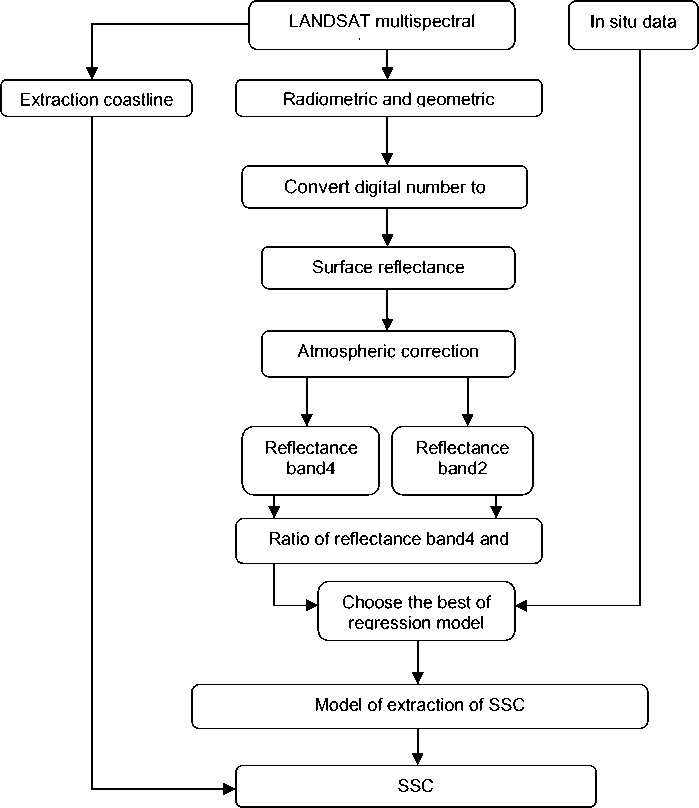
Figure 2 - The algorithm of extraction of suspended sediment from LANDSAT image
In surface water, calibration relationship improving can be established between reflectance ratios and in situ measurements data [6]. In turbid sediment-dominated water, the reflectance ratios between two near infrared bands or between a near infrared and a visible band are highly correlated to in situ measurements data [1-4, 6]. In this study, we use the reflectance ratios of near infrared band (band4) and green band (band2) LANDSAT TM, ETM+ multispectral image, and in situ data to build the regression model. In this study, for extracting water – land coastline, we use automated techniques, which given by Alesheikh A. (1996) [5]. The algorithm for estimating of SSC form LANDSAT image showed in figure 2.
RESULTS AND DISCUSSIONS
Study area. The Tri An lake is a hydroelectric dam on the Dong Nai river in Vinh Cuu district, Dong Nai province, Vietnam. The dam was built from 1984 to 1987 with assistance of the Soviet Union and knows as Tri An lake. This is one of the largest lakes in Vietnam with a full capacity of 2765 km3 and surface area of 323 km2 [8].
According to the results of monitoring surface water quality, the Tri An upstream location, the location of Vinh An, Phu Cuong, La Nga towns and Dong Nai river mouth, surface water is seriously polluted. In this area, concentration of suspended sediment (SS), chemical oxygen demand (COD), biochemical oxygen demand (BOD 5), nitrate, iron and microbiology organisms in water many times in excess of standards [8].
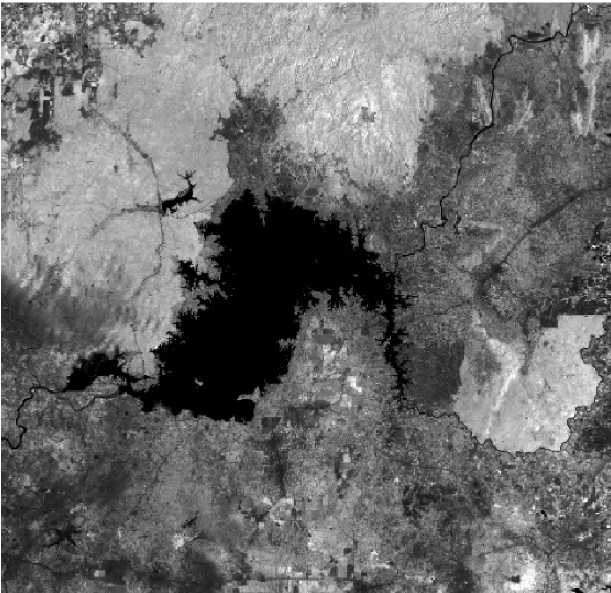
Figure 3 - The ratio image of surface reflectance band4 and band2
Water – land coastline extraction. The reflectance ratios of near infrared and green bands LANDSAT multispectral image in study area showed in figure 3. The results of extraction water – land coastline using Alesheikh’s automated technique showed in figure 4. In this figure, white color represents water and black color represents land.
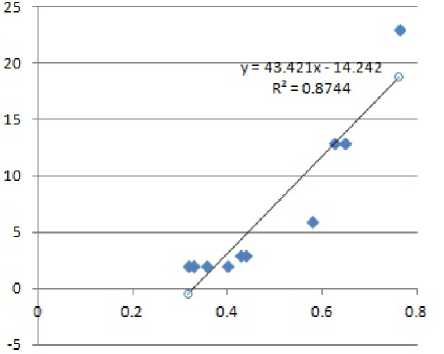
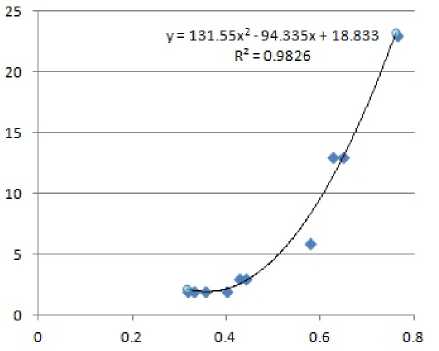
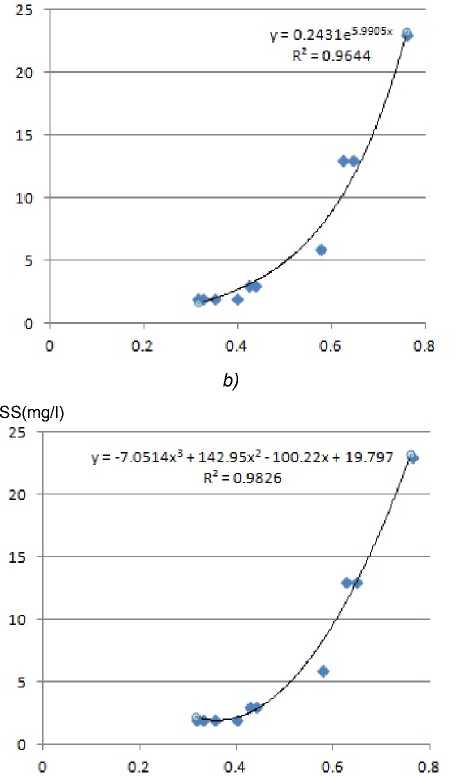
Development of SSC – water reflectance relations. The relationship between reflectance ratios band4 and band2 LANDSAT TM, ETM+ multispectral image and in situ measurements data was determined with linear, exponential and power regression. Good relationships for suspended sediment and reflectance ratios were found in power regression with 2-second and 3-rd order (the square correlation coefficient R2 = 0.9826) (figure 5).
In order to find the best model, model for estimating SSCs have been selected with R2 = 0.9826 following equation:
55 ( mg- ) = 131.55.( P band 4) 2 - 94.335( P band 4 ) + 18.838
(5),
1 P hand 2 P hand 2
where p hand 4 and p hand 2 are surface reflectance of near infrared and green bands LANDSAT multispectral image.
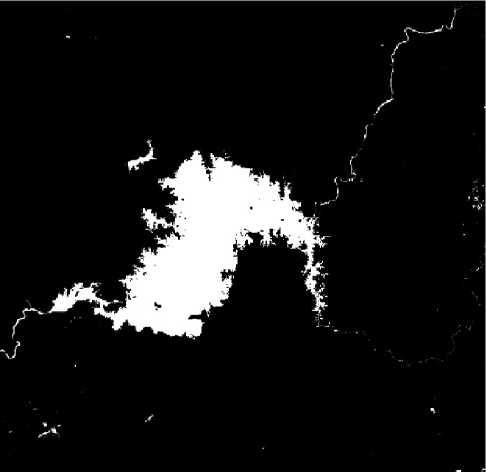
Figure 4 - Coastline extraction from LANDSAT multispectral image
SS(mg/l)
a)
SS(mg/l)
c)
SS(mg/l)
d)
Figure 5 - The relationship between SSC (mg/l) and ratio of surface reflectance band 4 and band 2 LANDSAT image (a – linear, b – exponential, c – polynomial with order 2, d – polynomial with order 3 regression)
Retrieval of SSC spatial distribution. To convert the digital numbers into SSC we use the calculating module of ERDAS Imagine 9.3. To show how the empirical relation (equation 5) behaves when applied to the surface water, we extract the SSC distribution map (fig. 6) for regions in southwest Dong Nai province using LANDSAT ETM+ image. Figure 6 shows SSC variations along the Tri An lake on 12 February 2010. In this example, the estimation of SSC ranges from 1.5 to 88.0 (mg/l). The dark blue area has the highest SSC value, which indicates the highest turbidity. In the contrary, the light blue area corresponds low turbidity on the water surface. The highest SSC is located in coastal region and the lowest SSC is located in centre of Tri An lake.
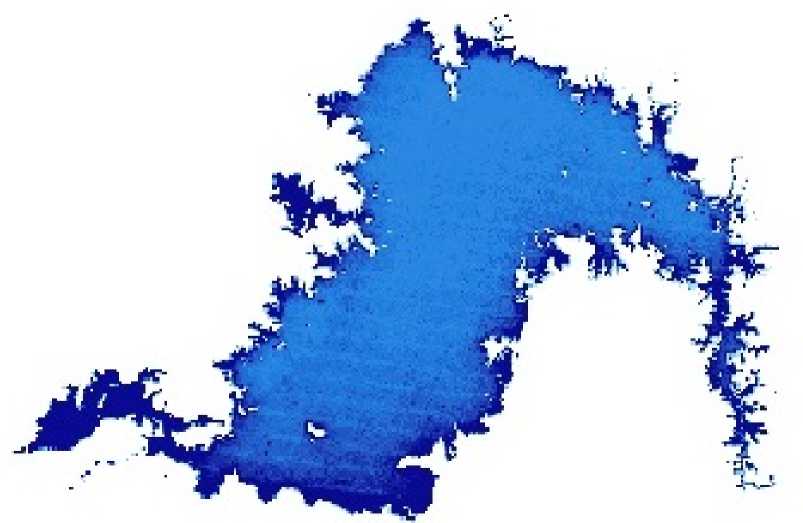
1.5(mg/l) 88.0(mg/l)
Figure 6 - SSC generated using developed algorithm
CONCLUSIONS
Nowadays, water pollution has become a global issue, directly caused by human populations grow, industrial and agricultural activities and climate change. A simple and operational method is presented to estimate the suspended sediment concentration in turbid estuarine water using satellite images.
The model to estimate suspended sediment concentration from reflectance ratios band4/band2 of LANDSAT multispectral image is used in the study and proved useful for the surface water in Tri An lake. Water quality mapping using remote sensing images shows a general pattern of decreasing SSC outward from the coastline. This can be a powerful information for water management authorities for water quality assessment, and the design of monitoring program to target the most dynamic and problematic area.
References Estimating suspended sediment concentrations in surface water of Tri An lake (Vietnam) using landsat multispectral images
- Chavez, P.S. (1996). Image-based atmospheric corrections -revisited and improved. Photogrammetric Engineering and Remote Sensing 62(9):1025-1036.
- David Doxaran, Jean -Marie Froidefond, Samantha Lavender, Patrice Castaing (2007). Spectral signature of highly turbid waters application with SPOT data to quantify suspended particulate matter concentrations, Remote sensing of Enviroment, Vol. 81, pp. 149 -161.
- Emmanuel Olet (2010). Water quality monitoring of Roxo reservior using LANDSAT images and In -situ measurements, International institude for geo -information science and earth observation enschede, the Netherlands, 69 pp.
- Moran, M.S. et al. (1992). Evaluation of simplified procedures for retrieval of land surface reflectance factors from satellite sensor output, Remote Sensing of Environment 41:169-184.
- Trinh Le Hung, Vu Danh Tuyen (2014). Monitoring coastal dynamics using LANDSAT multi-temporal images, Vestnik OrelGAU, 1(46), pp. 46 -55.
- Vilmaliz Rodriguez -Guzman, Fernando Gilbes -Santaella (2009). Using MODIS 250m Imagery to Estimate Total suspended sediment in a Tropical open bay, International journal of systems applications, engineering & development, Issue 1, Vol. 3, pp. 36 -44.
- Weiqi He et al. (2008). Water quality monitoring in slightly -polluted body through remote sensing -a case study in Guanting Reservoir Beijing, China, Front. Environ. Sci. Engin, Vol. 1, 11 pp.
- Dongnai Department of Natural resources and Environment, www.tnmtdongnai.gov.vn/.
- LANDSAT 7 science data user’s handbook (NASA), 186 pp.
- Electronic source: http://www.eslstation.net
