Estimation of chlorophyll content of barley and oats crops based on reflectance spectra obtained by ground-based remote measurements

Author: Sidko Alexander F., Pisman Tamara I., Botvich Irina Yu., Shevyrnogov Anatoly P.
Journal: Журнал Сибирского федерального университета. Серия: Техника и технологии @technologies-sfu
Article in issue: 8 т.9, 2016.
Free access
The purpose of this study is analysis of relationship between chlorophyll content and chlorophyll photosynthetic potential of oats and barley cultivars. For this aim we used ground remote sensing and laboratory data. Ground data were obtained at the experimental fields, located in the Krasnoyarsk region. Experiments were carried out in different seasons, under various lighting conditions with the control of plants state. Spectral measurements were done by double-beam spectroradiometer. It is installed on the mobile work platform at heights of 5 to 18 m. The study showed good correlation between chlorophyll photosynthetic potential and chlorophyll content for different oats and barley cultivars. The value of chlorophyll photosynthetic potentials is different for barley and oats cultivars during the growing season.
Chlorophyll photosynthetic potentials, chlorophyll, barley and oats
Short address: https://sciup.org/146115167
IDR: 146115167 | UDC: 528. | DOI: 10.17516/1999-494X-2016-9-8-1333-1339
Оценка содержания хлорофилла посевов ячменя и овса на основе спектров отражения при наземном дистанционном зондировании
Целью данного исследования является анализ взаимосвязи между содержанием хлорофилла и хлорофилльным фотосинтетическим потенциалом посевов ячменя и овса. Для этого были использованы данные наземного дистанционного зондирования и лабораторные данные. Наземные данные были получены на экспериментальных полях, расположенных в Красноярском крае. Эксперименты проводились в разное время года при различных условиях освещения с контролем состояния посевов растений. Спектральные измерения проводили при использовании двухлучевого спектрорадиометра. Он был установлен на подвижной рабочей платформе на высоте от 5 до 18 м. Проведенное исследование показало хорошую корреляцию между хлорофилльным фотосинтетическим потенциалом и содержанием хлорофилла для различных сортов ячменя и овса. Показано, что величина хлорофилльного фотосинтетического потенциала различна для овса и ячменя в период вегетации.
Text of the scientific article Estimation of chlorophyll content of barley and oats crops based on reflectance spectra obtained by ground-based remote measurements
Material and methods
Barley ( Hordeum disticxon L.) cultivar Viner and oats ( Owena sativa L.) cultivars Mutant and Orel were used as model crops. They have different chlorophyll content, yield and timing of maturation.
Field studies were performed on fields situated in the central and southern regions of Krasnoyarskii Krai (Russia) during the growing season from 2002 to 2012. The areas of the test plots were 200 – 600 m2. The test plots differed in the amount of fertilizers added to the soil per square meter.
The calculation of the chlorophyll photosynthetic potential is based on registration of the reflectance factor, ρ l crops using a PDSP double-beam spectrophotometer installed on the elevated work platform at heights of 5 to 18 m under sunny conditions [9].
The double-beam differential spectrophotometer was designed by the authors [10]. It records two fluxes – from the object studied and from the reference surface (etalon), which are used in the calculation of the reflectance factor, ρ l . As a reference surface, we used 1 m2 aluminum plate coated with magnesium oxide MgO. The spectra were taken every 2-4 days. The spectral resolution of the spectrophotometer is 2 nm in the range between 400 and 850 nm. The scanning rate in the spectral range from 400 to 850 nm was 60 s. The photometered area were0.5 – 2 m2. In generally, nadir measurements were taken. In order to obtain an accurate estimate of the distribution ofthe reflectance factor, ρ l over the canopy, we recorded 20 – 30 spectra and calculated their average values [11]. Every year, at least 10 test plots were studied.
From the values of the reflectance factor, ρ l calculated chlorophyll photosynthetic potential – parameter S (equation 1).
5 = 90 - ( р 73О ( t ) + р 550 ( t ) ) - J Р ( Л , t ) d X (1)
where 90 is the multiplier equal to the half-width of the chlorophyll absorption band between 550 and 730 nm, ρ 550 and ρ 730 are values of the reflectance factor of the wheat canopy at λ = 550 nm and λ = 730 nm.
Concentration of total chlorophyll (a and b) of the leaves in the laboratory was determined in the upper tiers of plants by a conventional spectrophotometric method, in ethanol extracts of 0.5-0.8-dm2 leaf sections, on a SPECORD UN VIS spectrophotometer Jena Carl Zeiss [12]. Content of chlorophyll was evaluated every 5-8 days throughout the growing season.
Results and discussion
Figures 1 and 2 shows the comparative dynamics of the reflectance factor for barley and oats depending on the wavelength at different periods of the growing season. Analysis of the spectral data of barley and oats canopies showed that the reflectance factor in the wavelength range between 550 and 730 nm demonstrate the most considerable variations throughout the growing season. A change in the reflectance factor in this region of the spectrum is essentially determined by chlorophyll content of the plants. At the initial stage of the growing season (June, July) curves of spectra of the brightness have the largest decrease and then increase in the red region of the spectrum. This is caused by of chlorophyll accumulation in plant canopies. Figure 1 shows that shape dynamics curve of the reflectance factor during the active growth phase (middle of June) is the same for barley and oats. The values of the reflectance factor are the same for barley and oats at test wavelengths (460, 550, 680 and 800 nm).
Green plant leaves typically display very low reflectance and transmittance in visible regions of the spectrum (i.e., 400 to 700 nm) due to strong absorptance by photosynthetic plant pigments. By contrast, reflectance and transmittance are both usually high in the near-infrared regions (NIR, 700 to 1300 nm) because there is very little absorptance by pigments [8, 13].
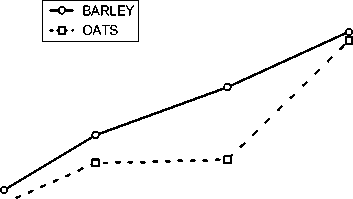
However, at the end of the growing season (beginning of August) curve dynamics of the reflectance factor barley rectified (Fig. 2). This is due to a decrease in chlorophyll content and the earlier period of ripening barley. Curve dynamics of the reflectance factor oats rectified later (end of August, September). Thus, shown the possibility of identification of crops with different maturation period (barley and oats) at the end of the growing season.
The main aim of the research was to study of the relationship between chlorophyll content of the leaves in the barley and oats upper layer and chlorophyll photosynthetic potential. For each
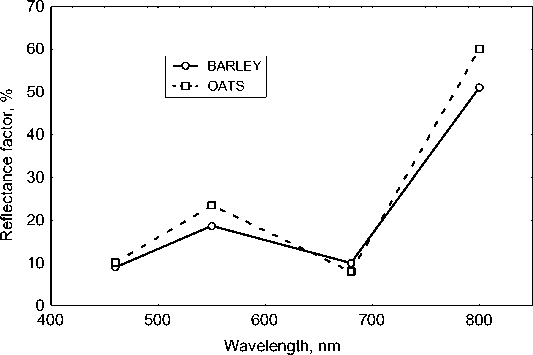
Fig. 1. The dynamics of the reflectance spectra of barley and oats crops at the beginning of the growing season (15.06)
ф
ё 30
га о га
ОТ
400 500 600 700 800
Wavelengs, nm
Fig. 2. The dynamics of the reflectance spectra of barley and oats crops at the end of the growing season (06.08)
cultivar of barley and oats during the growing season was remotely measured the dependence of the reflectance factor from the wavelength. On the basis of the brightness spectra of the crop calculated chlorophyll photosynthetic potential, S(t) by equation (1) during the growing season [14].
Fig. 3 show a graph of correlation dependence of chlorophyll content from chlorophyll photosynthetic potential for barley and oats canopy during the growing season. For the reliability of these parameters were measured and calculated for 10 years under different growing conditions. Our results showed a good correlation (R2 = 0.9) between chlorophyll content and chlorophyll photosynthetic potential of the barley and oats plants over the growing season.
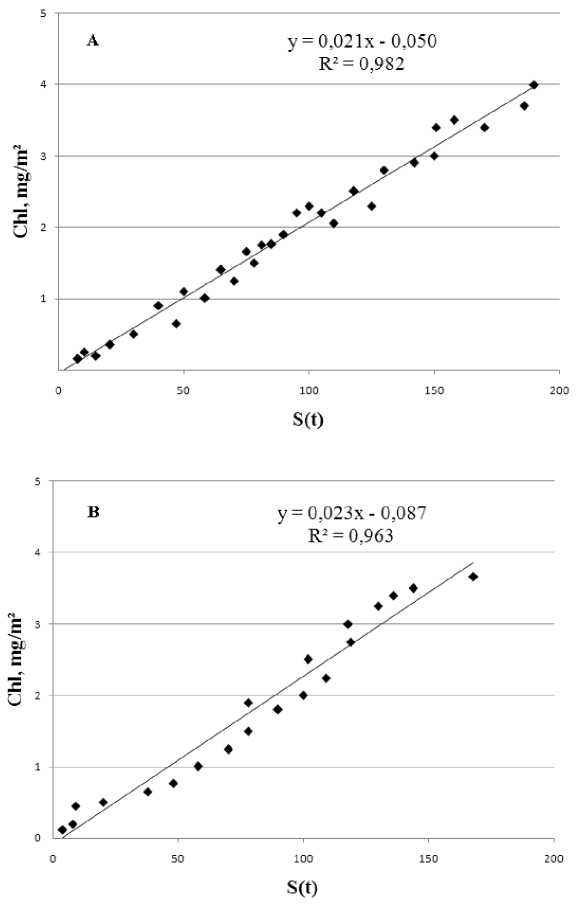
Fig. 3. Relations between chlorophyll photosynthetic potential, S(t ) and chlorophyll content, Chl for barley (A) and oats (B) canopy during the growing season
It should be noted that the value of chlorophyll photosynthetic potential for barley more than the value of chlorophyll photosynthetic potential for oats with the same content of chlorophyll. This is due to the physiological characteristics of the studied crops. Width and area barley leaf are greater than the width and the area of oats. As a result the projective cover of barley more the projective cover of oats during the active phase of growth.
Thus, results showed the advantage represented by ground-based remote method. The study of chlorophyll photosynthetic potential showed that this parameter, which was calculated by using high-resolution spectra (2 nm), was less variable over the growing season. At low spectral resolution is difficult to consider the influence of weather conditions. Chlorophyll photosynthetic potential defined as the area (S) makes it possible to estimate the chlorophyll content of barley and oats crops with good accuracy.
Conclusion
The work shows the high efficiency of chlorophyll photosynthetic potential in combination with traditional spectrophotometric measurements to assess chlorophyll content of crops. The efficiency of the method is confirmed by a large number of field measurements and their corresponding methods of statistical processing. The magnitude of chlorophyll photosynthetic potential makes possible to estimate the physiological condition of barley and oats crops and it allows for their identification at the end of the growing season.
The main results:
-
1 . The study showed good correlation (R2 = 0.9) between chlorophyll content and chlorophyll photosynthetic potential for barley and oats canopy during the growing season.
-
2 .Chlorophyll photosynthetic potential is different for barley and oats cultivars during the growing season.
References Estimation of chlorophyll content of barley and oats crops based on reflectance spectra obtained by ground-based remote measurements
- Jorgensen R. N., Hansen P. M., Bro R. Exploratory study of winter wheat refl ectance during vegetative growth using three-mode component analysis.Int. J. Remote Sensing, 2006, 27(5), 919-937.
- Broge N.H., Mortensen J.V. Deriving green crop area index and canopy chlorophyll density of winter wheat from spectral refl ectance data.Remote Sens. Environ.,2002,81, 45-57.
- Gitelson A. A., MerzlyakM. Remote estimation of chlorophyll content in higher plant leaves. Int. J. Remote Sens.,1997, 18, 291-298.
- Shibayama M., Akiyama T. A. Exploring the usability of fi eld measurements of middle infrared refl ectance using a portable band-pass fi lter-type radiometer to assess paddy rice yields. International Journal of Remote Sensing, 32, 3589-3609.
- Dash J., Curran P.J. The MERIS terrestrial chlorophyll index.International Journal of Remote Sensing, 2004, 25 (23), 5403-5413.
- Gitelson A. A. et al. Remote estimation of canopy chlorophyll content in crops. Geophysical Research Letters, 2005, 32, 1-4.
- Gajjar R.B., Shekh A.M., Dave A.J., Patel C.T.et al. Assessment of crop growth parameters of wheat under stress condition through ground based spectral data. Journal of the Indian Society of Remote Sensing,2005, 33 (1), 147-152.
- Chapelle E.W., Kim M.S., McMurtery J.E. Ratio analysis of refl ectance spectra (RARS): an algorithm for the remote estimation of the concentrations of Chl a, b and carotenoids in soybean leaves. Remote Sensing of Environment, 1992, 39, 239-247.
- Sid`ko A. F., Botvich I. Yu., Pisman T.I., Shevyrnogov A. Analysis of polarization characteristics of plant canopies using ground-based remote sensing measurements. Journal of Quantitative Spectroscopy and Radiative Transfer, 2014, 144, 117-122.
- Sid`ko A. F., Filimonov V. C., Sid`ko F. Ya.Field differential spectrometer.Zhrn. Prikl. Spektroskopii,1978, 29(5), 943-948
- Pugacheva I.Yu., Sid'ko A.F., Shevyrnogov A. P. A study of backscattered spectra dynamics of agricultural crops during growth period on the territory of the KrasnoyarskiiKrai. (Russia).Adv. Space Res, 2010, 45, 1224-1230.
- Andrianova Y.E., Tarchevsky I.A.Khlorofi ll I produktivnostrasteniy (Chlorophyll and plant productivity). Moscow: Nauka, 2000,
- Slaton M.R., Hunt E.R. and Smith W.K. Estimating near-infrared leaf refl ectance from leaf structural characteristics.American Journal of Botany, 2001, 88(2), 278 -283.
- Botvich I.Yu.,Sid`ko A.F., Pisman T.I., Shevyrnogov A.P.Determination of chlorophyll photosynthetic potential in vegetation using ground-based and satellite methods.Journal of Siberian Federal University. Engineering & Technologies, 2012, 1, 87-97.
