Evaluating freezing resistance in barley ( Hordeum vulgare L.) using molecular markers and some physiological traits
Автор: Sofalian Omid, Behi Maryam
Журнал: Журнал стресс-физиологии и биохимии @jspb
Статья в выпуске: 3 т.9, 2013 года.
Бесплатный доступ
To evaluate the freezing resistance and genetic diversity in barley physiological traits, molecular markers and their relationship in 20 barley genotypes were assessed in field and greenhouse condition. The analysis of variance showed a significant difference among studied genotypes. The effect of acclimation temperature on prolin content, quantum efficiency of photosystem II, chlorophyll and soluble sugars content were studied as physiological traits. Freezing treatments were -4, -7, -10, -13 and -16 °C temperatures that applied in a 3 replicated randomized complete block design. Then their lethal temperature at which 50% of plant were died (LT 50) was determined. To estimate FSI (Field Survival Index) index, the 20 genotypes were cultured in a separate experiment on field with 3 replications. The results showed negative significant correlation (-0.601) between field survival index and LT 50. Cluster analysis using physiological traits, genotypes of F-A1-1, F-A1-2, F-A2-11, F-GRB-85-5, Sahra, Sahand, Dasht and Makouei were categorized in a distinct group and had a high FSI and low LT 50. Makouei cultivar having LT 50=-17.66 °C and the highest percentage of winter survival in the field, was the most resistant genotype. 10 ISSR markers from 35 primers sequences were selected and used. These 9 ISSR primers produced 50 polymorphic bands. PIC and MI average index for all primers were 0.37 and 1.72 respectively. Cluster analysis of molecular data using Jaccard similarity coefficient categorized the genotypes to four distinct groups. Associations between molecular markers and traits were assessed by multiple regression analysis. Some informative markers related to FSI and also LT 50 was determined. So it may be possible to use these markers for selection of resistant lines or genotypes in breeding programs.
Barley, freezing resistance, genetic diversity, molecular marker, physiological traits
Короткий адрес: https://sciup.org/14323763
IDR: 14323763
Текст научной статьи Evaluating freezing resistance in barley ( Hordeum vulgare L.) using molecular markers and some physiological traits
Between abiotic stresses, cold and freezing had the most vulnerable effect to agriculture (Vagujfalvi et al., 1999). During cold acclimation in fall important biochemical and metabolic changes occurred. As a result of acclimation plants stored protective substance for freezing conditions (Mahfoozi et al., 2005). Root in the annual winter Cereals is the place of meristems that had been exposed to repair ability of cold and freezing damages (Bridger et al., 1996). Sugars accumulation such as Sucrose, Raffinose, Sorbitol and Fructan are frequently observed during plants acclimation. Some of these compounds caused protein and membrane stability during dehydration that occurred during freezing or drought condition (Breton et al., 2000). Rong-hu et al. (2006) in a study on barley cultivars showed that one quick and indirect way to measure photosynthetic activity, chlorophyll fluorescence and chlorophyll index are estimation by SPAD (Bhardway and Singhal, 1981). There are different ways to assessment of freezing resistance in crop plants. Field evaluation method is widely used for determine freezing tolerant in crop plants. In this way filed survival index (FSI) is noticeable and used as main index (Fowler, 1982). Determining of the LT50 based on crown tissue is the best method to estimate survival in the field, because crown is the most susceptible part of cereals and had a crucial role in regrowth after winter (Gusta et al., 1982). Expression of a low temperature tolerance gene is affected not only by environment, but also by the poliotropic effects of other genes or QTLs (Fowler, 2002). Today the molecular marker systems is an effective tools and serve as supplementary method for traditional plant breeding that was mostly used in quantitative traits selection programs (Lander and Botstein, 1987). Against molecular marker system, RAPD marker had low repeatability and AFLP marker is expensive and SSR required primary information about target sequence, so ISSR marker system can overcome these limitations and represent higher level of polymorphism (Terzopoulos and Bebeli, 2008). Plant breeders are always followed by genetic and biochemical markers using in quantitative trait breeding programs. In this experiment genetic diversity of some barley cultivars were investigated using ISSR markers and the relation of this marker loci with physiological traits in associated with freezing resistance were studied.
MATERIALS AND METHODS
This experiment was conducted in randomized complete blocks with 3 replications in research field of Mohaghegh Ardabili University in autumn of 2011. Plant materials that used in this study were 20 genotypes of improved barley (Table 1). Additionally winter survival index (FSI) was calculated separately. Also barley genotypes were grown under greenhouse conditions. After 3-4 leaf stage (2-3 week after planting), pots were transferred from greenhouse to a growth chamber and acclimated for 3 week in 4±1 °C. Then freezing test was performed on crown region according to methods of Limin and Fowler (1988) and Naghavi et al., (2010). After temperature treatments (in 5 levels -4, -7, -10, -13 and -16 °C) were placed in incubator with 4 °C for 24 hours. After 2 weeks survived plants were counted and evaluated. Lethal temperature for 50% was determined with probit analysis. Measurements of soluble sugars were done with method of (Irigoyen et al., 1992). As well as proline concentration in leaf tissue was fully developed and measured with (Bates et al., 1973) method. Absorption rate of each solution was recorded by spectrophotometry at a wavelength of 625 nm for soluble sugar and 520nm for proline. Using standard solution for each of them and regression relationship between concentration and absorption, the soluble sugars rate of samples were calculated on mg. proline concentration for each sample is termed of micro gram proline in each gram of leaf fresh weigh. Measurement of chlorophyll fluorescence (Fv/Fm) was done with use fluorometer optic science os-30p USA. With using special clamps, plant leafs placed in dark for 30 minutes then fluorescence of 3 genotypes was evaluated. Chlorophyll content measurements were done with SPAD-502. In order to reduce errors each treatment were read 3 times, and means of them were used for each treatment. DNA extraction was done with CTAB (Saghai-Maroof et al., 1984). 9 ISSR primers with suitable striped patterns and several forms were selected for molecular analysis. Polymerase chain reaction with the components was listed in Table 2. Separation of amplified products was conducted using agarose gel electrophoresis with a concentration of 1.2 percent. Staining of PCR products were done with using Ethidium bromide. For statistical analysis SPSS 16 were used. Means of comparison was done with LSD test in 5% of probability. Analysis if molecular data were done using NTSYS2.2, GenAelex 6.4 and PopGen 1.32 soft wares.
RESULTS AND DISCUSSION
Variance analysis of LT50 and FSI were shown in Table 3. Between genotypes LT50 and FSI was significant in 0.01 and 0.05 percent respectively. Also analysis of variance of physiological traits was shown in Table 4. Interaction of temperature and genotype in soluble sugar and proline was significant, for Chlorophyll content trait genotypes was significant and for fluorescence rate (Fv/Fm) interaction effect of genotype to temperature has significant effect. Means comparison of genotypes for FSI, LT50, Fv/Fm and chlorophyll amount was shone in Table 5. According to results Makouei cultivar with having minimum LT50 (-17.66) and the highest amount of FSI (86.42%) is the most resistant genotype, but genotype STIPA/PETUNIA1...(b) with highest rate of LT50 (-5) and lowest rate of FSI (59.44%) was the most sensitive genotype to freezing. Genetic differences between genotypes in barley have been reported by other researchers (Fowler et al., 1981). The amount of Fv/Fm decreased after acclimation. In the investigation of cold acclimation period on quantum efficiency of photosystem II in spring and winter oat varieties it was founded that exposure these plants to acclimation conditions, quantum efficiency level of photosystem II decreased firstly but increased in continue and then return to its first levels (Rizza et al., 2001).
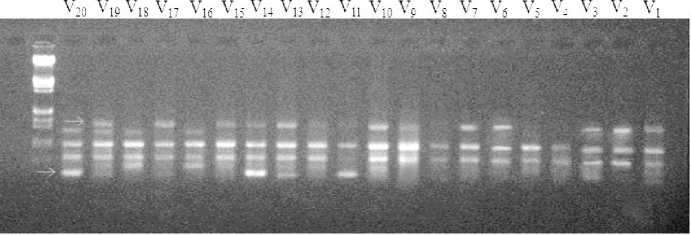
In the present study, there was not a certain changes in chlorophyll content during thermal stress but it can be observed that STIPA/PETUNIA1...(b) STIPA/PETUNIA1...(c), GLORIA-BAR/COPAL… and STIPA/PETUNIA1... (a) genotypes have the lowest chlorophyll content. These genotypes had somewhat lowest percent of survival on a farm and had the highest amount of LT50. Because of significant interaction effect of soluble sugar and proline, means compassion results is bring in Figure 1 and 2. Soluble sugars in all genotypes increased in acclimation period except for F-A-1-1 genotype. There were not observed any specific trend between resistant genotypes and susceptible ones in soluble sugars. Livingston and Premakumar (2002) In study of concentrations of soluble carbohydrate in crown tissues of two oat cultivars that had different reaction to two stages of acclimation, researchers found that, in first stage of acclimation, apoplastic liquid was consist of 2 percent of rot carbohydrates. After one day placement in the second stage of acclimation the percent of apoplast carbohydrates increase to 0.5 percent of total carbohydrate of root. They resulted that increasing apoplastic carbohydrate is a mechanism that let winter cereals to survive in freezing temperature. Prolin amount and survival percent before and after acclimation in Makouei had the highest value and LT50 had lowest amount. The lowest rates of proline had been shown in genotype of 10 and before acclimation that had the minimum surviving in field. According to Figure 1 and 2 it can be stated that in most genotypes proline increase after acclimation. Petcu and Terbea (1995) reported that free proline content in not acclimated plants is very little and after two weeks in control condition this values increased in all wheat genotypes. In this experiment proline accumulation in the resistant genotype was more than sensitive ones. The correlation between LT50 and FSI was relatively high, negative and statistically significant equal to (r=-0.601) (Table 6). Prasil et al. (2007) in studying 39 cultivars of barley showed that significant correlation between the average five-year survivals and LT50 of field condition and LT50 of acclimated plant in growth chamber. There was positive and significant correlation between chlorophyll content and FSI (r=0.599). There was negative and significant correlation between LT50 and chlorophyll fluorescence amount after acclimation and prolin amount after and before acclimation, r values was respectively -0.504, -0.472, -0.493. Petcu and Terbea, (1995) High correlation (-0.71) between damage percentage of cold and proline content has been reported in 50 genotype of winter wheat after two weeks acclimation. According to cluster analysis by physiological traits and LT50 (Figure 3), genotypes of F-A1-1, F-A1-2, F-A2-11, F-GRB-85-5, Sahra, Sahand, Dasht and Makouei were categorized in a distinct group and had a high mean for Prolin amount before and after acclimation, chlorophyll content and FSI and low LT50. Nine studied primers were produced 61 bands with means of 6.78 bands per each primer. Among them there was 11 monomorph band and 50 polymorphs with means of 5.56 polymorphs band per each primer. Polymorphism percent was ranged from 62.5 % for pp13 primer and 100 % for pp1 and pp9. Means of polymorphism percent for all used primer was 82.29 %. Primer banding pattern of pp19 is shown in Figure 4. The polymorphism information content (pic) for used primers in ISSR analysis was varied from 0.29 in pp19 primer to 0.46 in pp9 (Table 7). PIC amount in this study showed the primers performance in differential of used genotype that can be advisable for similar studies. Also marker index (MI) as an effective measure that used for determine the polymorphism, was ranged between 0.99 for pp16 primer and 3.51 for pp1 in this study. In order to classification of barley genotypes on the base of ISSR data, cluster analysis was used with the method of complete linkage and according to Jacquard similarity coefficient (Figure 5) and showed suitable grouping. Suitability of cluster analysis was determined considering to significant cophenetic correlation (0.68) in 1 percent of probability. In this analysis studied genotypes were divided to four distinct groups. A research was conducted on 16 barley cultivar with using 10 ISSR markers (Fernandez, 2002). The cluster analysis can easily conformed the well-known barley origin also it can divide fall and spring cultivars and Two and six-row of barley. ISSR molecular markers relations were evaluated with studied traits. In this stage stepwise regression was performed for all traits (Table 8). Sugar solution after habituation was associated with a marker with corrected coefficient equal to 0.33. The lowest variation was explained by markers. The marker of pp5m7 had positive correlation with soluble sugar content after acclimation. After regression analysis for LT50, pp2m2, pp5m2 and pp19m3 markers was interred to model with positive and pp2m5 and pp16m4 with negative effects and can explain 94% of variations. In FSI index, pp1m9 and pp19m3 markers with positive and pp1m8, pp19m2 and pp19m5 with negative effects interred to model and determined 94% of variations. Today’s using correlation between molecular markers and controlling genes for quantitative traits can accelerate the process of plant breeding (Gebhardt, 2004).
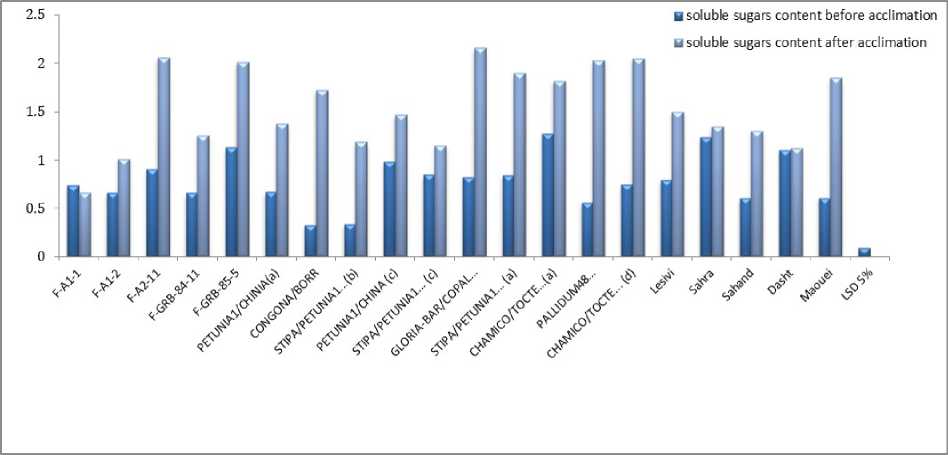
Figure 1. Means comparison genotype acclimation using for soluble sugars content in studied barley
genotype
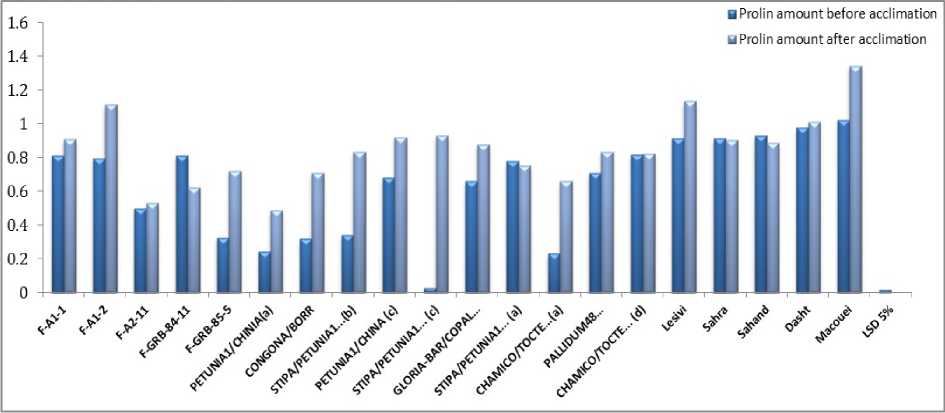
Figure 2. Means comparison genotype acclimation using for prolin content in studied barley
genotype

Sahand Dasht Sahra
F-A2-11
FGRB-85-5
F Al 1
F-Al-2
Macouei
STIPA/PETUNIAl.., (c)
STIPA/PETUNIAl... (a)
STIPA/PETUNIAl ...(b) CHAMICO/TOCTE.. .(a)
F GRB 84 11
PETUNIA l/CHINA(c)
PALLIDUM48..
|
Number |
Genotype |
Number |
Genotype |
|
1 |
F-A1-1 |
11 |
GLORIA-BAR/COPAL//BEN.4D/3/S.P-B/4/DC-B/SEN/5/CONGONA |
|
2 |
F-A1-2 |
12 |
STIPA/PETUNIA1//KOLLA/BBSC (a) |
|
3 |
F-A2-11 |
13 |
CHAMICO/TOCTE//CONGONA (a) |
|
4 |
F-GRB-84-11 |
14 |
PALLIDUM48//NORDIC/563.6.5/3/CEL-B… 2/MZQ//CEL-B/5/LINO/6/CONGONA |
|
5 |
F-GRB-85-5 |
15 |
CHAMICO/TOCTE//CONGONA (d) |
|
6 |
PETUNIA1/CHINIA(a) |
16 |
Lesivi |
|
7 |
CONGONA/BORR |
17 |
Sahra |
|
8 |
STIPA/PETUNIA1//KOLLA/BBSC(b) |
18 |
Sahand |
|
9 |
PETUNIA1/CHINA (c) |
19 |
Dasht |
|
10 |
STIPA/PETUNIA1//KOLLA/BBSC (c) |
20 |
Lesivi |
Table 2. PCRreaction contents for barley DNA samples propagation by using ISSR primers
|
1unit, (microliteres) |
|
|
contents |
ISSR |
|
PCR buffer (1X) |
2 |
|
MgCl2(0.05Mm) |
0.8 |
|
dNTP(0.05mM) |
0.2 |
|
Primer |
1.6 |
|
Taq DNA polymerase |
0.26 |
|
DNA(25 ng) |
2 |
|
DdH 2 O |
11.4 |
|
Volume Total |
18μL |
Table 3. Analysis of variance for FSI & LT50 in studied barley genotype
Table 4. Analysis of variance for physiological traits in studied barley genotype
Table 5. Means comparison table for using studied barley genotype
|
Genotype |
Chlorophyll (SPAD) Fv/Fm FSI LT50 (%) ( (C |
|
F-A1-1 |
39.85 0.827 77.35 -14.68 |
|
F-A1-2 |
40.43 0.817 76.85 -15.52 |
|
F-A2-11 |
38.6 0.824 69.55 -12.70 |
|
F-GRB-84-11 |
39.1 0.816 78.57 -8.39 |
|
F-GRB-85-5 |
39.67 0.822 78.94 -13.62 |
|
PETUNIA1/CHINIA(a) |
42.08 0.820 67.34 -7.60 |
|
CONGONA/BORR |
43.05 0.819 73.44 -5.22 |
|
STIPA/PETUNIA1...(b) |
35.78 0.813 59.44 -4.57 |
|
PETUNIA1/CHINA (c) |
39.8 0.818 66.39 -8.80 |
|
STIPA/PETUNIA1... (c) |
36.25 0.811 45.83 -7.58 |
|
GLORIA-BAR/COPAL… |
35.52 0.820 52.18 -8.18 |
|
STIPA/PETUNIA1... (a) |
36.85 0.819 62.22 -6.72 |
|
CHAMICO/TOCTE…(a) |
39.97 0.823 71.86 -7.89 |
|
PALLIDUM48… |
41.37 0.826 65.14 -9.21 |
|
CHAMICO/TOCTE... (d) |
40.27 0.818 72.22 -8.13 |
|
Lesivi |
41.13 0.813 69.92 -9.08 |
|
Sahra |
40.3 0.824 69.3 -10.64 |
|
Sahand |
41.25 0.818 65.25 -11.34 |
|
Dasht |
40.83 0.822 68.57 -11.50 |
|
Macouei |
40.33 0.823 86.42 -17.66 |
|
%LSD(p<5) |
0.717 0.015 5.01 0.98 |
Table 6. Correlation between physiological traits for studied barley genotypes
|
SOV |
Soluble Soluble Prolin Prolin Fv/Fm Fv/Fm sugars sugars amount amount Chloro- before after content content before after phyll LT 50 FSI acclima- acclima- before after 50 acclima- acclima- amount tion tion acclima- acclimation tion tion tion |
|
Fv/Fm before acclimation Fv/Fm after acclimation Prolin amount before acclimation Prolin amount after acclimation Chlorophyll amount Soluble sugars content before acclimation Soluble sugars content after acclimation LT 50 FSI |
1 0.434 1 0.136 0.283 1
0.135 *0.454 0.235 0.029 1 0.147 0.374 0.014 -0.065 -0.021 1 0.260 0.138 -0.099 -0.233 -0.173 0.116 1
0.333 0.393 0.398 0.145 **0.599 0.001 -0.017 **-0.601 1 |
* and **: significance at p<0.05 and significant at p<0.01 respectively
Table 7. Primer sequences, polymorphic bands and PIC and MI values in ISSR analysis
|
Sequence 5’ to 3’ |
Number of Primer |
Cod |
(PIC) |
MI |
Total number of fragments |
Number of polymorphic fragments |
Polymorphism (%) |
|
5’ AGAC AGACGC 3’ |
1 |
pp1 |
0.39 |
3.51 |
9 |
9 |
100 |
|
5’ GACAGACAGACA GACA 3’ |
2 |
pp2 |
0.35 |
2.24 |
10 |
8 |
80 |
|
5’ AACAACAACGC 3’ |
5 |
pp5 |
0.35 |
1.46 |
6 |
5 |
83.33 |
|
5’GAGAGAGAGAGAGAGAT 3’ |
7 |
pp7 |
0.40 |
1.28 |
5 |
4 |
80 |
|
5’ TCTCTCTCTCTCTCTCC 3’ |
9 |
pp9 |
0.46 |
2.30 |
5 |
5 |
100 |
|
5’ ACACACACACACACACYG 3’ |
13 |
pp13 |
0.34 |
1.06 |
8 |
5 |
62.5 |
|
5’ CACACACACACAAG 3’ |
16 |
pp16 |
0.31 |
0.99 |
5 |
4 |
80 |
|
5’ AGAGAGAGAGAGAGAGT 3’ |
19 |
pp19 |
0.29 |
1.21 |
6 |
5 |
83.33 |
|
5’ AGAGAGAGAGAGAGAC 3’ |
32 |
pp32 |
0.41 |
1.46 |
7 |
5 |
71.43 |
|
Average |
0.37 |
1.72 |
6.78 |
5.56 |
82.29 |
Table 8. Regression analysis based on physiological traits, LT50 and FSI using ISSR markers in studied barley genotypes
|
Prolin amount Prolin Soluble sugars |
|
|
markers |
Fv/Fm after Chlorophyll before amount after content after LT 50 FSI acclimation amount 50 acclimation acclimation acclimation |
|
Intercept pp1m8 |
0.8 0.8 1.29 0.97 0.83 -15.19 78.82 -0.78 -0.68 |
|
pp1m9 |
1.1 0.37 |
|
pp2m2 |
0.22 |
|
pp2m5 |
-0.34 |
|
pp5m1 |
1.61 |
|
pp5m2 |
0.42 |
|
pp5m4 |
-0.25 |
|
pp5m5 |
0.40 |
|
pp7m4 |
-0.63 |
|
pp9m2 |
0.35 |
|
pp9m5 |
-0.35 |
|
pp16m1 |
-0.60 -0.61 |
|
pp16m2 |
-0.47 -0.55 |
|
pp16m4 |
0.57 -0.81 |
|
pp19m1 |
-0.7 -0.38 |
|
pp19m2 |
-0.20 |
|
pp19m3 |
0.25 0.48 0.49 |
|
pp19m5 |
-0.53 |
|
pp32m1 |
0.31 |
|
R2 |
0.93 0.56 0.87 0.67 0.33 0.94 0.94 |
CONCLUSION
relatively high, negative and significant at
The correlation between LT50 and traits are probability level of one percent (r= 0.601). After regression analysis for LT50, pp5m2, pp2m2, pp19m3 markers with positive effect and pp2m5 and pp16m4 with negative effect and nearly, 94% of variance could have been explained. Therefore, the negative regression coefficient markers are ideal markers for LT50 and can be used for selection of resistant genotypes for freezing. In FSI index, pp1m9, pp19m3 markers with positive effect and pp19m2, pp1m8, pp19m5 with negative effect totally determined 94% variation. Therefore it could deduce that ISSR molecular marker can be serving as powerful marker system in the freezing tolerance selection perspectives.
Список литературы Evaluating freezing resistance in barley ( Hordeum vulgare L.) using molecular markers and some physiological traits
- Bates, L.S., Waldren, R.P., Teare, I.D. (1973) Rapid determination of free prolin for water-stress studies. Plant and Soil, 39:205-207.
- Bhardway, R., Singhal, G. (1981) Effect of water stress on photochemical activity of chloroplasts during greening etiolated barley seedlings. Plant Cell Physiol., 22:155-162.
- Breton, G., Danyaluk, J., Ouellet, F., Sarhan, F. (2000) Biotechnological application of plant freezing associated proteins. Biotechnol. Ann Rev., 6:57-82.
- Bridger, G.M., Falk, D.E., Mc Kersie, B.D., Smith, D.L. (1996) Crown freezing tolerance and field winter survival of winter cereals in Eastern Canada. Crop Sci., 35:150-157.
- Fernandez, M.E., Figueiras, A.M., Benito, C. (2002) The use of ISSR and RAPD markers for detecting DNA polymorphism, genotype identification and genetics diversity among barly cultivars whith known origin. Theor Appl Genet., 104:845-851.
- Fowler, D.B. (1982) Date of seedling, fall growth and winter survival of winter wheat and rye. Agron J., 74:1060-1063.
- Fowler, D.B. (2002) Winter Cereal Production. Crop Development Center, University of Saskatchewan, Canada. URL:http://www.usask.ca/agriculture/cropsci/winter_cereals/.
- Fowler, D. B., Gusta, L.V., Tyler, N.J. (1981) Selection for winter hardiness in wheat. III. Screening methods. Crop Sci., 21:896-900.
- Gebhardt, C., Ballvora, A., Walkemeier, B., Oberhagemann, P., Schuler, K. (2004) Assessing genetic potential in germplasm collections of crop plants by marker-trait association: A case study for potatoes with quantitative variation of resistance to late blight and maturity type. Mol Breed., 13:93-102.
- Gusta, L.V., Fowler, D.B., Tyler, N.J. (1982) Factors influencing hardening and survival in winter wheat. In: Li PH, Sakai A (eds) Plant cold hardiness and freezing stress: mechanisms and crop implication Academic New York 2:23-40.
- Irigoyen, J.J., Emerich, D.W., Sanchez-Diaz, M. (1992) Water stress induced changes in concentrations of proline and total soluble sugars in nodulated alfalfa (Medicago sativa L.) plants. Physiol Plant., 84:55-60.
- Lander, E.S., Botstein, D. (1987) Mapping mandelian factors underlying quantitative trait using RFLP linkage maps. Genet., 121:179-186.
- Limin, A.E., Fowler, D.B. (1988) Cold hardiness expression in interspecific hybrids and amphiploids of the Triticeae. Genome, 30:361-365.
- Livingston, D.P., Premakumar, R. (2002) Apoplastic carbohydrates do not account for differences in freezing tolerance of two winter oat cultivars that have been second phase cold hardened. Cereal research Commun., 30:375-381.
- Mahfoozi, S., Roustaii, M., Ansari-Maleki, Y. (2005) Determination of low temperature tolerance in some bread wheat, durum wheat and barley genotypes. Seed and Plant, 21:467-483.
- Naghavi, A., Sofalian, O., Asghari, A., Sedghi, M. (2010) Relation between freezing tolerance and seed storage proteins in winter bread wheat (Triticum aestivum L.). Tur J Field Crops, 15:154-158.
- Petcu, E., Terbea, M. (1995) Prolin content and the conductivity test as screening methods for frost tolerance of winter wheat. Plant Physiol, 21:3-11.
- Prasil, I.T., Prasilova, P., Marik, P. (2007) Comparative study of direct and indirect evaluations of frost tolerance in barley. Field Crops Res., 102:1-8.
- Rabbani, M.A., Iwabuchi, A., Murakami, Y., Suzuki, T., Takayanagi, T. (1998) Genetic diversity in mustard (Brassica juncea L.) germplasm from Pakistan as determined by RAPDs. Euphytica, 103:135-242.
- Rizza, F., Pagani, D., Stance, A.M., Cattivelli, L. (2001) Use of chlorophyll fluorescence to evaluate the cold acclimation and freezing tolerance of winter and spring oats. Plant Breed, 120:389-396.
- Rong-hu, A.L., Pei-guo, G., Baum, M., Grando, S., Ceccarelli, S. (2006) Evaluation of cholorofyll content and fluorescence parameters as indicators of drought tolerance in barley. Agric Sci China, 5:751-757.
- Saghai-Maroof, M., Soliman, A., Jorgensen, K., Allard, R.A. (1984) Ribosomal DNA spacer-length polymorphisms in barley: Mendelian inheritance, chromosomal location, and population dynamics. PNAS, 81:8014-8018.
- Vagujfalvi, A., Kerepsi, J., Galiba, G., Tischner, T., Sutka, J. (1999) Frost Hardiness depending on carbohydrate changes during cold acclimation in wheat. Plant Sci, 144:85-92.

