Evaluating Image Recognition Efficiency using a Self-Organizing Map

Author: Rui M. Ligeiro, Andrei B. Utkin
Journal: International Journal of Image, Graphics and Signal Processing(IJIGSP) @ijigsp
Article in issue: 7 vol.8, 2016.
Free access
Recognition and classification of images is an extremely topical interdisciplinary area that covers image processing, computer graphics, artificial intelligence, computer vision, and pattern recognition, resulting in many applications based on contemporary mobile devices. Developing reliable recognition schemes is a difficult task to accomplish. It depends on many factors, such as illumination, acquisition quality and the database images, in particular, their diversity. In this paper we study how the data diversity affects decision making in image recognition, presenting a database driven classification-error predictor. The predictor is based on a hybrid approach that combines a self-organizing map together with a probabilistic logical assertion method. By means of a clustering approach, the model provides fast and efficient assessment of the image database heterogeneity and, as expected, indicates that such heterogeneity is of paramount importance for robust recognition. The practicality of the model is demonstrated using a set of image samples collected from a standard traffic sign database publicly available by the UK Department for Transport.
Image recognition, Unsupervised learning, Self-Organizing Maps, Hierarchical clustering
Short address: https://sciup.org/15013991
IDR: 15013991
Text of the scientific article Evaluating Image Recognition Efficiency using a Self-Organizing Map
Published Online July 2016 in MECS DOI: 10.5815/ijigsp.2016.07.01
Image recognition is an extremely topical area of research that combines techniques acquired from different fields of knowledge, like image processing, computer graphics, artificial intelligence, computer vision, and pattern recognition. Here, the high performance is one of the most important requirements to meet. The recognition speed directly depends on the available computational resources and the imaging equipment, which can vary from a black and white camera to a multisensor, multi-band surveillance system [1][2]. In many circumstances it takes too long to find the correct match among many possibilities, which conveys a negative impression to the user. On the other hand, the advent of low-cost mobile devices with high computational performance, high quality cameras and low energy consumption has given a huge impetus to the smart image-related applications. Such devices are receiving increasing attention in mobile and ubiquitous computing research and it is expected that their role will only grow with time.
A typical application in question analyses a photo taken by a camera and provides some useful context information to the user. The process of recognition is implemented in four successive phases:
-
1) Filtering — to remove unwanted information from the initial image;
-
2) Feature extraction — to acquire useful information;
-
3) Classification — to categorize the information; and
-
4) Matching — to match the image with its counterpart in the database.
Classification is performed using the reduced image information (features) obtained at the second phase, providing this way the required high processing speed. However, application of this methodology can lead to loss of useful information and, eventually, wrong classification. As we claim in section V, the relevance of this fundamental limitation is dependent on the sample heterogeneity.
In the past decade the driver support systems has gained considerable attention from the automotive manufacturers. Having this in mind, this study is aimed, in particular, to give a contribution to the traffic sign recognition problem by analyzing the variance of a traffic signs database. The recognition procedure specifically takes into account the color and visual features of the signs, leaving out of scope the constraints characteristic to natural outdoor environments, such as lightning conditions, perspective distortion, occlusions or bad visibility, just to name a few.
The diversity of the elements in the sample highly affects the performance of the recognition algorithm: similar images in the database cause ambiguity, since the same (or very similar) input data are linked to different outputs. In this context, it is very important to preliminary assess how reliable the data is, taking into account the inherent computational limitations of today’s mobile devices readily available in the market. For such an assessment we present an early warning system (predictor) that evaluates the image database reliability by discovering and reporting to the user the subsets of images that possess a critical degree of similarity and thus can cause problems in their recognition. To address this issue, we use a scheme comprising two phases: a selforganizing map that groups the images by their similarity and a probabilistic logic assertion that decides whether an image should be kept in the database.
The article is organized as follows: Section II reviews the most important aspects of self-organizing maps as well as hierarchical clustering analysis. In section III we discuss the generic tools of image recognition that composes the framework. The predictor model is described in section IV. The obtained results are presented in section V and summarized in the conclusion section VI.
-
II. B asic C oncepts
As mentioned above, the proposed recognition efficiency analysis is primary based on a self-organizing map (SOM). Additionally, to infer about the accuracy of the method, an empirical model was created using a hierarchical representation of the data structures. Finding the optimal configuration of the cluster arrangement, the model represents an essential method to evaluate the efficacy of our approach.
Both SOMs and hierarchical representations have found a wide use in numerous artificial intelligence applications [3].
-
A. Self-Organizing Maps
In our research, SOM constitutes a basis of a powerful technique used in the analysis of datasets containing many natural clusters with varying properties. Also known as Kohonen maps, the self-organizing maps represent a special class of single layer neural networks trained using unsupervised learning, introduced by Tuevo Kohonen in 1982 in [4] and further developed in his subsequent research (see, for instance, [6][7]) .
SOMs have an ability to progressively adapt themselves by using a clustering mechanism that gradually becomes sensitive to different input categories of unlabeled data. The general aspects of SOM-based networks are described in details in [8] and references therein. Later on, many improvements were introduced to the original version of the original Kohonen’s SOM (see, for example, [9][10 ][11]) , but the main features remained unchanged. It is also worth to emphasize the insights of [12][13 ][14] with respect to color segmentation, which is an important feature of our study, as well as the works by Ultsch on visualization of the SOM output [15][16].
The SOM used in the predictor model presented in section IV is briefly described below. The SOM comprises a rectangular lattice composed by nodes (neurons), linked with the input layer (see Fig. 1), each link being associated with a scalar value, the interconnection weight. The neuron is fully characterized by the vector of interconnection weights of its links, whose dimension coincides with the number of input nodes, that is, the dimension of the input data vector.
The training starts with random initialization of the interconnection weights. After that, the algorithm combines three important sequential steps (that are described in details in [8] and thus are discussed here only briefly):
Competition : For each input pattern and all neurons in the grid, one calculates the Euclidean distance between the interconnection weight vector and the pattern vector. The neuron with the smallest weight-to-pattern distance is designated as the best matching unit (BMU).
Cooperation : A neighborhood of neurons centered in the BMU is chosen. All neurons in the neighborhood are subjected to collective adjustment described in the next step.
Adaptation : For each neighboring neuron, its weights are adjusted to make their values close to the input vector. The closer a neuron is to the BMU, the bigger is the adjustment.
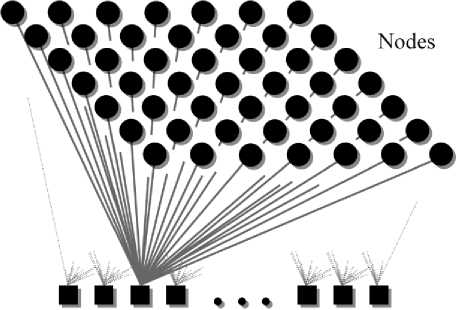
Input layer
Fig.1. Schematic Representation of the Self-Organizing Map.
-
B. Hierarchical Clustering
Identifying homogeneous groups (clusters) of objects is of great interest in numerous applications, varying from biology [17] to astrophysics [18] and from the marketing research [19] to the diagnostics of Attention Deficit Hyperactive Disorder [20]. In many cases, the cluster identification helps to reveal some underlying internal structure or hierarchy of the objects under study. The hierarchical clustering approach [21] is more computationally expensive technique than the developed SOM-based algorithm. Being more straightforward, in the present study it is used for verification of the assessments obtained by the self-organizing maps.
Hierarchical algorithms are subdivided into divisive and agglomerative. The divisive ones resort to a topdown clustering method: all samples are initially concentrated in one cluster, which is recursively split down to the hierarchy. At each step the division is performed for the largest available cluster, until all the clusters are broken into a single object. The agglomerative algorithms use bottom-up joining of initially separated objects, which is repeated until all of them belong to a unique cluster.
The main tool for illustrating the arrangement of objects produced by hierarchical clustering is a dendogram, which represents the grouping process in the form of a tree. The widest top raw, tree crown, represents nodes of individual objects. Subsequent rows represent the clustering dynamics as a process of combining previous nodes (individual objects or smaller clusters) into bigger clusters — via branches whose lengths are proportional to the value of the intergroup dissimilarity. Proceeding this way, one represents the clustering dynamics as a sequence of successive merges, which ends up in building a single cluster containing all the objects, the tree’s root.
-
III. I mage R ecognition M odel
For the purpose of the present study, the generic model of image recognition by a mobile device briefly described in the Introduction was adapted to a publicly available database [22] of traffic-sign images.
The recognition algorithm assesses the proximity between an acquired image and each reference image in the database using the Euclidean distance in the feature space. For convenience, the mobile application only suggests the top three matches, giving to the user an option to choose one. The distance from the input image to the best-match image, characterizing the recognition uncertainty, is supposed to be significantly less than that to reference images. However, this does not happen for databases with a lack of sample diversity.
To reduce the noise, each image is filtered by applying a Gaussian blur. This effect smooths the image, providing more stable feature extraction at the next phase. Naturally, there is a trade-off between the stability and the loss of information inevitably accompanying the image blurring.
The feature extraction provides efficient compression of the image information, reducing the vast array of image pixels to a far more restrictive set of special (key, interest, contour, etc.) points. In the case in question, we used the contour-point extraction algorithm by Satoshi Suzuki and Keiichi Abe [23]. For more information on image segmentation see [24].
Direct treating the sets of key points poorly meets the requirements of algorithm stability and fast processing: 1) in many cases the key point description still results in large amount of information and 2) the number of key points varies significantly from image to image. As well, concrete distributions of the key points differ significantly from one feature extraction procedure to another. Meanwhile, these distributions do not differ dramatically at the global scale as the key points always have a tendency to concentrate in the regions with rich information contents. This opens an opportunity to map the structurally changeable set of numerous key points {x} into a fixed set of weights {wi} of i = 1,2,..., imax, imax = GridWidth x GridHeight (1)
knots of a fixed rectangular grid (see Fig. 2) .
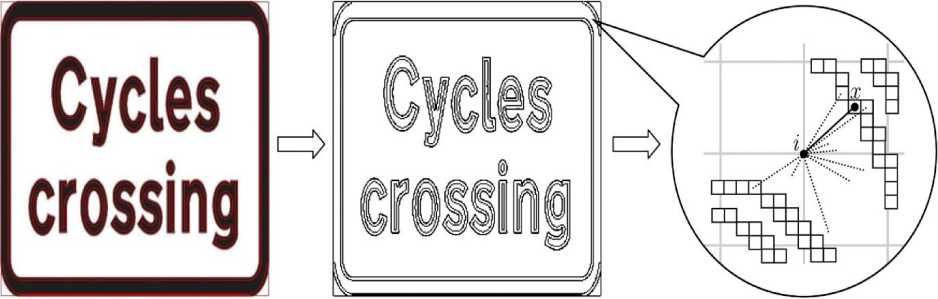
Fig.2. Feature (Here, the Contour Points) Extraction from a Traffic-Sign Image and Subsequent Grid Mapping.
Akin mappings are traditionally used in lidar return recognition [25][26] and data processing with radial-basis function networks (see, e.g., [27]). The peculiarity of current application is that the grid is relatively sparse and is used for data transform to lower, rather than to higher, dimension. The weight wi , associated with the i -th grid node is defined by a sum of the Gaussian functions w=X exp
x

2 52n d J
where i , x stands for the Euclidean distance between the knot and the key (here, the contour) point x . The adjustable constant parameter 5 grid defines the radius of a neighborhood in which the knot is sensitive to the presence of key points. Note that for all images the transformation { x } ^ { w i } , governed by relation (2) , yields a weight array of the same size i max .
An important supplementary factor of image differentiation, the color information, is added through two additional knots corresponding to the relative mean red and green intensities
R w = Int =---------, imax +1 red R + G + B
G w = Intgreen = --^--^7
i max + 2 g R + G + B
(here R , G , and B represent the total RGB intensities of the recorded image). As far as Int red + Intgreen + Intblue = 1 , onlY two independent relative intensities were chosen. The sample structure is composed by arrays — one per image — stored in a lightweight text file (JSON format), that concatenates a collection of attributes described above with their corresponding values.
Every time a user activates the recognition process, the signature of the acquired photo
W = { w1, w2,.., wimax, w+1 = Intred, wU+2 = Intgreen } is computed in real time and compared with all databaseimage signatures. Only in very rarely occasions a user takes a photo whose frame coincides exactly with that of the corresponding sample. For this reason, the matrix of knots is shifted in both vertical and horizontal directions, being dislocated one step at a time in rows/columns (left to right, up to down). For every shift, the pairwise dissimilarity function Dis (W(I), W(S)) between the image I and the sample S is calculated according to the formula imax
Dis 2 ( W ( I ) , W ( S ) ) = | W ( I ) - W ( S ) | = £ ( w ( I ) - w ( S ) )
= 1
i max + 2 q
+Krgb 2 (-P- w?))2, i = imax + 1
where the adjustable constant parameter KRGB takes into account the difference of importance and units of measure in the w -feature and RGB spaces. Once defined, the dissimilarity function (4) can be subsequently used for measuring the distance between two vectors in the joint w- RGB feature space.
-
IV. T he P redictor M odel
The goal of the predictor is to estimate the likelihood of an image to be incorrectly recognized. This is particularly relevant for databases with large amount of similar images. Knowing in advance groups (clusters) of images with such similarity allows to take preventive measures, such as selecting only a particular group of truly heterogeneous samples, taking new samples, or making necessary substitutions. The developed SOMbased predictor groups the sample images by similarity, calculating the position of an image on a map (for the case in question, two dimensional lattice of Kohonen nodes {rj = (Xj, yj )} , j = 1,2,..., J whose dimension J is defined by the quantity of images) via an iterative process that brings similar images together and moves away the dissimilar ones. If a particular node has several associated samples, it indicates that they have similar signatures. Mapping a sample in a non-shared node gives reason to believe that it will be recognized properly. An important feature of the sample clustering process is its unsupervised nature. The predictor combines the SOM with a probabilistic logic assertion that takes the decision whether an image should be included in the database or not. The SOM reveals sample similarities whose nature and origin are not known in advance, allowing, due to its 2D topology, their visual representation.
As was discussed in section II, the sequential process starts from random initialization of the weights of the links connecting the Kohonen nodes { r j } J with the input layer whose i max + 2 nodes represent the components of the image feature vector W = { w i } i max + 2 , whose structure is illustrated in Fig. 3.
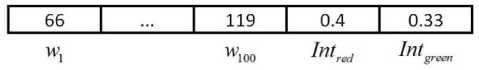
Fig.3. Example of an Input Vector which Concatenates Two Kinds of Image Attributes: 10×10 Grid Knot Weights and Red/Green Relative Mean Intensities.
At all, one has a matrix of J x ( i max + 2 ) weights
-
V . j ) }■ ' = ^ ( , и) = IJ (5)
= 1
The unsupervised learning strategy consists in an iterative adjustment of the neuron weight vectors { v ( j ) } . During this process, the neurons in the lattice compete for the best matching with the current input vector W . The winner — from here on characterized by the index j = jw — is the one closest to the input in terms of the distance between the feature vectors Dis ( W , V ) defined by Eq. (4)
jw
= argmin Dis ( W , V ( j ) )
The winner node rj is also called the best matching unit (BMU). All the nodes in the BMU neighborhood are adjusted by shifting their weight vectors towards the input vector, the closer the node is to the BMU, the bigger is the adjustment
V ( j ) ( t + 1 ) = V ( j ) ( t ) + a ( t ) h j , k ( t ) ( W ( t ) - V ( j ) ( t ) ) (7)
Here the arguments t and t + 1 refer to the current and next iteration steps while the exponentially decaying factor
5 (t) = 5o exp

a (t) = ao exp

represents the learning rate ( a 0 and Ta are adjustable constants characterizing the initial learning rate and the decay speed). The spatiotemporal neighborhood function
hj , j w ( t ) = exP
।r j - r jw |2 2 5 2 ( t )
is a Gaussian centered at the BMU, whose spread decreases with time in a manner similar to a ( t )
The mapping process comprises iterative application of the updating rule (7) with progressively less influence upon the node weights (5) due to exponential decrease of the factors a ( t ) and h j j ( t ) . At each iteration, the mapping accuracy expressed as a mean quantization error (MQE, the mean of the distance (4) between the input vectors and corresponding BMUs) is calculated. The iterative process is stopped when the MQE decreases below a predefined limiting value (”MQE threshold”, e.g., 0.001). Due to (8) - (10) , in most situations the MQE rapidly decreases at the first iteration and then slowly converges to zero.
After the training, a new sample image can be presented to the SOM, which is able to define its position in the map (assigned BMU) at a very little computational cost. Then, a decision about accepting or rejecting the sample as a member of constructing database can be taken on the basis of the number of previous samples, already associated with the BMU. All steps of the corresponding algorithm are depicted in the diagram of Fig. 4.
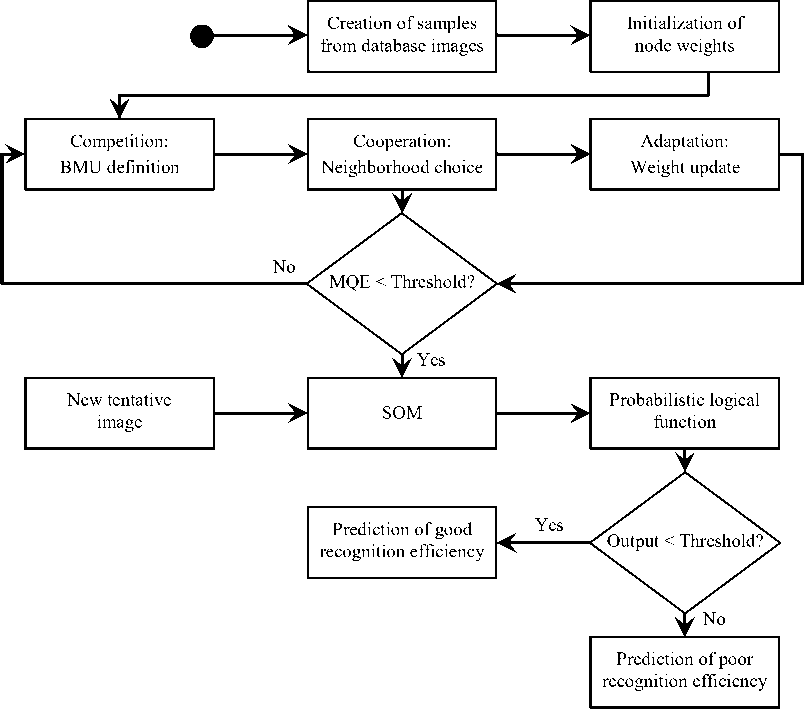
Fig.4. Predictor Flow Chart.
-
V. R esults
The practicality of the developed predicting tool is demonstrated using a set of traffic sign images collected from the collection publicly available by the UK Department for Transport [22]. Signatures serving as input data for both the SOM and the hierarchical clustering were derived from these images by successive application of Gaussian filtering (blur), keypoint extraction, and computation of the average RGB intensity values.
-
1. Bus and cycle signs: 45 images
-
2. Direction and tourist signs: 96 images
-
3. Information signs: 61 images
-
4. Low bridge signs: 7 images
-
5. Motorway signs: 59 images
-
6. On street parking: 85 images
-
7. Pedestrian, cycle, equestrian: 11 images
-
8. Pedestrian zone signs: 5 images
-
9. Regulatory signs: 45 images
-
10. Road works and temporary: 41 images
-
11. Signs for cyclists and pedestrians: 16 images
-
12. Speed limit signs: 23 images
-
13. Tidal flow lane control: 12 images
-
14. Traffic calming: 20 images
-
15. Tram signs: 9 images
-
16. Warning signs: 120 images
-
17. Level crossing signs: 22 images
To infer about the accuracy of the predictor, an empirical model was created. The model uses a bruteforce algorithm that calculates the sample-to-sample distance for all possible pairs of the images in the database. The distance in the w -RGB feature space is measured in accordance to formula (4) used in the image recognition model of section III. The brute-force algorithm describes the proximity among images by creating a dendrogram that illustrates the optimal configuration of the cluster arrangement. By using a single linkage criterion, one gets a symmetric matrix of the distances between all database samples, to which the method of hierarchical clustering analysis is applied. It is a more exact but exhaustive method, involving significant computational effort, whose application was only related to the need to assess the predictor's accuracy (notably, as the database grows, each new sample has to be compared with all previous and then the new dendrogram must be generated from scratch).
Comparative view of the dendrogram and 10×10 SOM clustering for “bus and cycle signs” group is shown in Fig. 5. Multiple experiments with different traffic signs groups demonstrated about 85% coincidence of the two clustering methods. At the same time, SOM clustering demonstrates nearly linear, rather than quadratic increase of the calculation time with the increase of the number of images in the database, thus yielding faster results. For example, for the group 16 (Warning signs: 120 images), the hierarchical clustering executes five times longer than the predictor model.
As seen from the results illustrated in Fig. 5, the grouping of the traffic signs corresponds well to their visual similarity. It is also important to mention that empty cells provide good indication of the relative distance between the image related ones in a hypothetic “visual perception” space: cells with more dissimilar sets of images are separated by greater number of empty cells.
-
VI. C onclusion
We applied the clustering capacity of SOM for discovering subsets of images that possess a critical degree of similarity. The study made it possible to better identify the image databases that might cause uncertainty in recognition, by fast unsupervised grouping similar images into clusters.
The diversity of the elements in the sample highly affects the performance of the recognition algorithm. In general, for a family of recognition algorithms described in section III a reasonable threshold is five images grouped in one node: a subset (cluster) of six or more images corresponding to the same Kohonen unit tends to result in ambiguity at recognition.
The good accuracy of the predictor is supported by both the results of hierarchical clustering (dendrogram) and by visual inspection. The proposed clustering method is very flexible and can be easily adapted to other kinds of databases.
For future research, we plan to carry out optimization of the proposed strategy aiming to suggest combinations of subsets of a database according to an aleatory objective rate of recognition. We are also going to extend our study to other complicated man-made and natural objects.
A cknowledgment
The presented research was supported in part by Quadro de Referência Estratégico Nacional (QREN) with the framework of Project #24649 UMG (Universal Museum Guide).
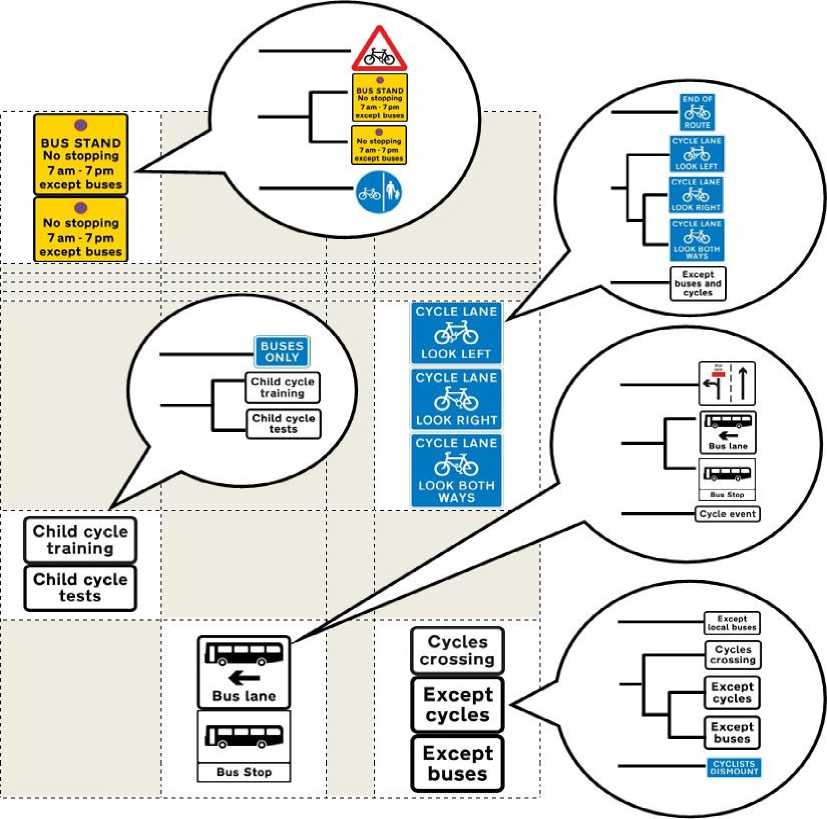
Fig.5. Comparison between the Dendrogram-Based and SOM-Based Clustering Methods. The Table Cells Correspond to a Fragment of 10×10 Kohonen Node Structure. Corresponding Dendrogram Fragments Are Shown in Callouts.
References Evaluating Image Recognition Efficiency using a Self-Organizing Map
- C. Beyan, "A multimodal approach for individual tracking of people and their belongings," Imaging Science Journal, vol. 63, no. 4, pp. 192-202, July 2015.
- A. Javed, "Face recognition based on principal component analysis," International Journal of Image, Graphics and Signal Processing, vol. 5, no. 2, pp. 38–44, February 2013.
- O. Nali, "High-speed Image compression based on the combination of modified self organizing maps and back-propagation neural networks," International Journal of Image, Graphics and Signal Processing, vol. 6, no. 5, pp. 28–35, April 2014.
- J. Senthilnath, Nitin Karnwal, and D. Sai Teja, "Crop type classification based on clonal selection algorithm for high resolution satellite image," International Journal of Image, Graphics and Signal Processing, vol. 6, no. 9, pp. 11–19, August 2014.
- T. Kohonen, "Self-organized formation of topologically correct feature maps," Biological Cybernetics, vol. 43, no. 1, pp. 59–69, January 1982.
- T. Kohonen, Self-Organization and Associative Memory, 3rd. ed., Berlin: Springer (Springer Series in Information Sciences, Vol. 8), 2012.
- T. Kohonen, "The Self-Organizing Map," Proceedings of the IEEE, vol. 78, no. 9, pp. 1464–1480, September 1990.
- T. Kohonen, Self-Organizing Maps, Berlin: Springer, 1995.
- J. Vesanto and E. Alhoniemi, "Clustering of the self-organizing map," IEEE Transactions on Neural Networks, vol. 11, no. 3, pp. 586–600, May 2000.
- M. Johnsson, Applications of Self-Organizing Maps, Lund, SE: Lund University Press, 2012.
- M. Resta, "Assessing the efficiency of health care providers: a SOM perspective," in Advances in Self-Organizing Maps, Berlin: Springer, 2011, pp. 30–39.
- X. Y. Zhang, J. S. Chen, and J. K. Dong "Color clustering using self-organizing maps," Proceedings of the International IEEE Conference on Wavelet Analysis and Pattern Recognition, vol. 3, pp. 986–989, 2007.
- S. H. Ong, N. C. Yeo, K. H. Lee, Y. V. Venkatesh, and D. M. Cao, "Segmentation of color images using a two-stage self-organizing network", Image and Vision Computing, vol. 20, no. 4, 279–289, April 2002.
- J. Moreira and L. D. F. Costa, "Neural-based color image segmentation and classification using self-organizing maps," Annals of IX Brazilian Symposium on Computer Graphics, Patterns and Images (SIBGRAPI), pp. 47–54, 1996.
- A. Ultsch and H. P. Siemon. "Kohonen's Self Organizing Feature Maps for Exploratory Data Analysis", Proceedings of the International Neuron Network Conference, pp. 305–308, 1990.
- A. Ultsch, U*-matrix: A Tool to Visualize Clusters in High Dimensional Data, Berlin: Fachbereich Mathematik und Informatik, 2003.
- A. Sturn, J. Quackenbush, and Z. Trajanoski, "Genesis: cluster analysis of microarray data", Bioinformatics, vol. 18, no. 1, pp. 207–208, January 2002.
- A. Hajian, M. A. Alvarez, and J. R. Bond, "Machine learning etudes in astrophysics: selection functions for mock cluster catalogs", Journal of Cosmology and Astroparticle Physics, vol. 1, art. 038, January 2015.
- L. Agostini, A. Nosella, and B. Soranzo, "The impact of formal and informal appropriability regimes on SME profitability in medium high-tech industries", Technology Analysis & Strategic Management, vol. 27, no. 4, pp. 405–419, April 2015.
- J. Anuradha and B. K. Tripathy, "Hierarchical Clustering Algorithm based on Attribute Dependency for Attention Deficit Hyperactive Disorder," International Journal of Intelligent Systems and Applications, vol. 6, no. 6, pp. 37–45, May 2014.
- S. C. Johnson, "Hierarchical Clustering Schemes", Psychometrika, vol. 32, no. 2, pp. 241–254, September 1967.
- UK Government, Department for Transport, "Traffic-sign images for reproduction in printed matter, on screen or in other media. Images in JPG format," May 2013. [Online] Available: https://www.gov.uk/traffic-sign-images#images-in-jpg-format. [Accessed: 02-Apr-2016.]
- S. Suzuki, "Topological structural analysis of digitized binary images by border following", Computer Vision, Graphics, and Image Processing, vol. 30, no. 1, pp. 32–46, April 1985.
- C. K. Santle and V. K. Govindan. "A review on graph based segmentation," International Journal of Image, Graphics and Signal Processing, vol. 4, no. 5, pp. 1–13, June 2012.
- D. Bhattacharya, S.R. Pillai, and A. Antoniou, "Waveform classification and information extraction from LIDAR data by neural networks", IEEE Transactions on Geoscience and Remote Sensing, vol. 35, no. 3, pp. 699–707, May 1997.
- A. B. Utkin, A. V. Lavrov and R. M. Vilar "Low-cost active optical system for fire surveillance," Optics and Spectroscopy, vol. 106, no. 6, pp. 926–936, June 2009.
- J. Ghosh and A. Nag, "An Overview of Radial Basis Function Networks," in Radial Basis Function Networks 2: New Advances and Design, Berlin: Springer-Verlag, 2001, pp. 1–36.
